

Abstract
Cytotoxic T-lymphocyte-associated protein 4 (CTLA-4) is expressed on the surface of activated T cells and some tumor cells, and is the target of the clinically-approved monoclonal antibody ipilimumab. In this study, we investigate specific binding of radiolabeled ipilimumab to CTLA-4 expressed by human non-small cell lung cancer cells in vivo using positron emission tomography (PET). Ipilimumab was radiolabeled with 64Cu (t1/2 = 12.7 h) through the use of the chelator 1,4,7,10-tetraazacyclododecane-1,4,7,10-tetraacetic acid (DOTA) to formulate 64Cu-DOTA-ipilimumab. CTLA-4 expression in three non-small cell lung cancer (NSCLC) cell lines (A549, H460, and H358) was verified and quantified by Western blot and enzyme-linked immunosorbent assays (ELISA). A receptor binding assay was utilized to monitor the binding and internalization of 64Cu-DOTA-ipilimumab in the NSCLC cell lines. Next, the biodistribution of 64Cu-DOTA-ipilimumab was mapped by longitudinal PET imaging up to 48 h after injection. Ex vivo biodistribution and histological studies were employed to verify PET results. By in vitro analysis, CTLA-4 was found to be expressed on all three NSCLC cell lines with A549 and H358 showing the highest and lowest level of expression, respectively. PET imaging and quantification verified these findings as the tracer accumulated highest in the A549 tumor model (9.80 ± 0.22 %ID/g at 48 h after injection; n=4), followed by H460 and H358 tumors with uptakes of 9.37 ± 0.26 %ID/g and 7.43 ± 0.05 %ID/g, respectively (n=4). The specificity of the tracer was verified by injecting excess ipilimumab in A549 tumor-bearing mice, which decreased tracer uptake to 6.90 ± 0.51 %ID/g at 48 after injection (n=4). Ex vivo analysis following the last imaging session also corroborated these findings. 64Cu-DOTA-ipilimumab showed enhanced and persistent accumulation in CTLA-4-expressing tissues, which will enable researchers further insight into CTLA-4 targeted therapies in the future.
Keywords: CTLA-4 (cytotoxic T-lymphocyte-associated protein 4), immunotherapy, PET (positron emission tomography), lung cancer, immune checkpoint inhibitor
Graphical abstract
INTRODUCTION
Cytotoxic T-lymphocyte-associated protein 4 (CTLA-4) is a transmembrane inhibitory receptor found on activated T-lymphocytes that is homologous to the co-stimulatory molecule CD28. Upon ligation of CD28 by CD80 or CD86, both of which are expressed on the surface of antigen presenting cells, CD28 provides positive modulatory signals leading to T-cell activation and proliferation1. However, CTLA-4 is quickly upregulated in response to T-cell activation and competes with CD28 for the ligation of CD80 and CD86. Since CTLA-4 displays 500-2,500-fold higher affinity for CD80 and CD86 in comparison to CD28, CTLA-4 outcompetes CD28, leading to the inhibition of intracellular signaling involved in T-cell activation. By effectively blocking the co-inhibitory receptor CTLA-4 using “checkpoint-blocking” antibodies, T-cells remain active and lead to a greater cytotoxic immune response in the tumor microenvironment2. Currently, ipilimumab is the only FDA-approved CTLA-4 antibody, while tremelimumab is also under investigation as an anti-CTLA-4 therapy3, 4.
While primarily confined to immune cells, it was recently discovered that CTLA-4 is differentially expressed on some malignant tissues, and correlates with overall patient survival in some instances5–7. Additionally, CTLA-4 is constitutively expressed on the surface of more than 88% of human-derived cancer cell lines, and incubation of these cells with recombinant CD80 and CD86 has been found to result in caspase-3/caspase-8-mediated apoptosis8. This expression of CTLA-4 by tumor tissues lends itself to exploration with molecular imaging techniques, which are suitable for monitoring expression levels of receptors in a dynamic and noninvasive fashion9, 10. With the increase in immunotherapy treatments, researchers are investigating new imaging strategies to better investigate the complex interactions between tumors and the immune system. For example, Larimer et al. recently discovered that enhanced tumor uptake of a CD3-targeted PET tracer in CTLA-4-expressing tumor-bearing mice was a predictive biomarker of response as it correlated with reduced tumor size11. The primary role for clinically-relevant CTLA-4 imaging is expected to rely heavily upon the activation and biodistribution of T-cells in vivo; however, limited studies have investigated the molecular imaging of immunotherapy targets in cancer9. Certainly, T-cell infiltration is a major player for immunotherapeutics; yet, direct imaging of immune checkpoint receptors, such as CTLA-4, may provide further insight into their mechanism of action, ultimately leading to the discovery of second-generation CTLA-4-targeted therapies9.
Lung cancer is the most commonly diagnosed cancer in the world, accounting for 20% of cancer-related deaths each year. While it remains the most preventable forms of cancer, there will be more than 220,000 new cases of lung cancer diagnosed in the United States in 2016 alone12. Dismal survival rates have been attributed to several factors, including the lack of effective prescreening strategies, the aggressiveness of lung malignancies, and the challenge of drug sensitivity versus resistance13. The development of new treatment strategies plays an essential role in increasing 5-year survival rates, and recent developments in the field of immunotherapy may assist in this endeavor. Ipilimumab, or Yervoy® (Merck & Co., Inc.), is currently in phase III clinical trials (NCT01285609) for squamous non-small cell lung cancer (NSCLC). In previous phase II studies in lung cancer, treatment with phased ipilimumab plus paclitaxel and carboplatin improved patient survival from 8.3 months with chemotherapy alone to 12.2 months, increasing the overall response rates by 2-fold from 14% to 32%, when compared to patients treated without ipilimumab14.
The expression of CTLA-4 by cancer cells is of debatable importance; however, the known presence of CTLA-4 in these tissues provides a convenient, albeit artificial, model for validating our CTLA-4 PET tracer. To this end, this study evaluates the biodistribution of 64Cu-labeled (t1/2: 12.7 h) ipilimumab in murine subcutaneous models of NSCLC using cancer cells known to express surface-bound CTLA-4 at different levels. Overall results indicate that 64Cu-labeled ipilimumab may be used to noninvasively monitor CTLA-4-expressing tissues in vivo and may come to be a useful tool in the understanding and further exploration of immune checkpoint inhibition treatments.
MATERIALS AND METHODS
Cell Culture
A549, NCI-H358 (H358), NCI-H460 (H460), CALU-1, NCI-H23 (H23), and (NCI-H522) cell lines were obtained from the American Type Culture Collection (ATCC). A549 cells were grown in F-12K medium, while CALU-1 cells were grown in ATCC-formulated McCoy’s 5a medium. The other cell lines (H358, H460, H23, and H522) were cultured in Roswell Park Memorial Institute (RPMI)-1640 medium. All media was supplemented with 10% fetal bovine serum (FBS; Gibco, ThermoFisher Scientific) and 1% penicillin-streptomycin solution (Gibco, ThermoFisher Scientific). Cells were grown in a humidified incubator at 37 °C with 5% CO2 and utilized for studies at 60–70% confluency.
CTLA-4 ELISA
CTLA-4 expression was quantitatively assessed via an enzyme-linked immunosorbent assay kit (R&S Systems). The procedures were outlined in the manufacturer’s protocol. Briefly, 10 μL of cell lysate was added to wells in triplicate with sample diluent. Next, the biotin-conjugate was added to wells and incubated at room temperature for 2 h with shaking at 400 rpm. Wells were washed three times before the diluted Streptavidin-HRP was added to the wells. The plate was sealed and incubated at room temperature for 1 h with shaking at 400 rpm. Again, wells were then washed three times. The TMB substrate solution was added to the wells and incubated at room temperature for 10 min with no light exposure. The enzyme reaction was halted by adding the stop solution to the wells. The optical density was measured at 450 nm using a microtiter plate reader (BioTek).
Western Blot
Cells were lysed using Radio Immuno Precipitation Assay (RIPA) buffer (Boston BioProducts) supplemented with 1:100 Halt Inhibitor Cocktail (Thermo Fisher Scientific) for 10 min at 4 °C. Next, the cells were centrifuged and protein concentration was measured using the Pierce Coomassie (Bradford) Protein Assay kit (Thermo Fisher Scientific). Twenty micrograms of total protein were loaded into the wells of a 4–12% Bolt Bis-Tris Plus gel (Thermo Fisher Scientific). Following electrophoresis at 120 mV for 45 min at 4 °C, proteins were transferred to a nitrocellulose membrane using the iBlot 2 system (ThermoFisher Scientific). The membrane was blocked in the Odyssey PBS Blocking Buffer (LI-COR Biosciences) for 12 h at 4 °C. The iBind Western Device (Thermo Fisher Scientific) was prepared by adding the primary and secondary antibody solutions and washes to the corresponding chambers. In accordance with the manufacturers’ protocol, dilutions of 1:200 and 1:400 were made of the goat-derived CTLA-4 antibody (Novus Biotechnologies) and mouse β-actin (LI-COR Biosciences) with the iBind Fluorescent Detection Solution Kit (Thermo Fisher Scientific). Similarly, the secondary antibodies (donkey anti-goat 800CW and donkey anti-mouse IRDye 680RD) were obtained from LI-COR and diluted at 1:10,000 before being placed into their corresponding chamber. The membrane was removed from the iBind system after 12 h and scanned using the LI-COR Odyssey Infrared Imaging System (LI-COR Biosciences).
In Vitro Binding Assays
Ipilimumab was incubated with 800CW dye (LI-COR Biosciences) at a 1:3 ratio at room temperature for 2 h, then passed through a PD-10 size-exclusion column (GE Healthcare Life Sciences) for purification. Next, 100,000 cells were plated onto 24-well plates supplemented with the proper media for each cell line. For the internalization assay, a solution of dye-conjugated ipilimumab in media was generated, and 1 mL was added to each well. After 0.5, 1, 8, or 24 h of incubation, media was removed and 0.2 M sodium acetate was added to each well to remove the surface-bound antibody. After one minute, the acetate was also removed and cells were rinsed with PBS. Cells were then trypsinized and removed from the well plate. Fluorescence intensity was quantified in each of these fractions using the IVIS optical imaging system (PerkinElmer), and data were presented as the total fluorescence in the internalized fraction, normalized to fluorescence in the removed media.
Human Lung Adenocarcinoma Xenograft Mouse Model
All animal studies were conducted under a protocol approved by the University of Wisconsin Institutional Animal Care and Use Committee. Once the cells reached 60-70% confluency, they were detached using Accutase (Innovative Cell Technologies) and 100 μL (1 × 10⁶ cells) of a 1:1 mixture of lung cancer cells and Matrigel Matrix Basement Membrane (Corning) were subcutaneously implanted into the lower flank of 4 to 7-wk-old female athymic nude mice (Crl: NU(NCr)-Foxn1nu; Envigo). Tumor sizes were monitored until they reached 5–8 mm diameter, at which time the mice were used for imaging studies.
Chelation and 64Cu-labeling of CTLA-4 antibody
Ipilimumab (Bristol-Myers Squibb) was obtained commercially in the clinically-available I.V. injectable form, buffer-exchanged to PBS, and conjugated with DOTA (1,4,7,10-tetraazacyclododecane-1,4,7,10-tetraacetic acid, Macrocyclics) for radiolabeling with 64Cu (t1/2 = 12.7 h) using previously reported methods at a 10:1 ratio15. 64Cu was produced via the 64Ni(p,n)64Cu reaction using a PETrace cyclotron from GE Healthcare16. Briefly, 64Cu (~37 MBq) was diluted with sodium acetate and mixed with DOTA-ipilimumab (~1 mg/mL). Following 1 h incubation at 37 °C with constant shaking, the solution was purified using a PD-10 column (GE Healthcare).
PET Imaging and Biodistribution
Longitudinal PET studies were performed using the microPET/microCT Inveon rodent model scanner (Siemens Medical Solutions USA, Inc.) with 40 million counts being obtained at various time points following intravenous injection of 5–10 MBq of 64Cu-DOTA-ipilimumab. Quantification of regions-of-interest was performed using the Inveon Research Workplace (Siemens Medical Solutions USA, Inc.) and recorded as %ID/g (mean ± SD). After imaging studies, mice were sacrificed by CO2 euthanasia and various organs were harvested, wet-weighted, and placed in a WIZARD2 automatic gamma counter (PerkinElmer) for determination of radioactive content. Uptake was reported as %ID/g (mean ± SD). Receptor blocking studies were also performed in A549 tumor-bearing mice to verify the specificity of 64Cu-DOTA-ipilimumab binding. For the blocking studies, A549 tumor-bearing mice (n=3) were injected with excess ipilimumab (50 mg/kg) 24 h prior to injection of 5–10 MBq 64Cu-DOTA-ipilimumab. Imaging time points, quantification, and biodistribution studies were then performed as described for other mice groups.
Fluorescence Immunohistochemistry with Confocal Microscopy
Fluorescence immunohistochemistry was performed to confirm CTLA-4 expression levels in ex vivo lung cancer xenograft tissues. Tumor tissues were collected, frozen in Optimal Cutting Temperature compound (Sakura Finetek), and sectioned in 5 μm slices. For staining, slides were dried for 15 min at room temperature and fixed in 4% paraformaldehyde (Santa Cruz Biotechnologies), then washed twice with 1X PBS. Slides were then permeabilized in 0.2% Triton X (Sigma-Aldrich) in PBS for 15 min, washed with PBS, and blocked for 2 h in blocking solution at room temperature (5% donkey serum, 0.3% Triton X in PBS). Primary incubation with ipilimumab (25 μg/mL) in the blocking solution was performed overnight at 4°C. To reduce background, slides were then washed twice with 0.2% Triton X for 30 min and washed with PBS prior to incubation with goat anti-human 800CW secondary dye (LI-COR) for 1 h. Slides were subsequently washed twice with 0.2% Triton X for 20 min and twice with PBS for 5 min, mounted with VectaShield hard mount containing DAPI (Vector Laboratories) and coverslipped. Imaging was performed with a Nikon A1R confocal microscope.
Statistical Analysis
All quantitative data are presented as mean ± standard deviation. Using the Student t-test, p-values less than 0.05 were considered statistically significant.
RESULTS
CTLA-4 protein expression in lung cancer cells
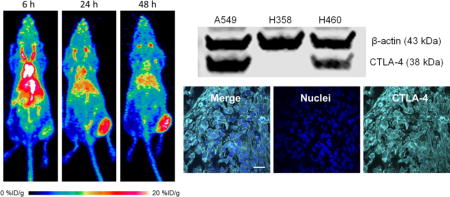
Both ELISA and Western blot studies were performed to determine the abundance of CTLA-4 in the lung cancer cell lines. Before choosing three cell lines for animal studies, six lung cancer cell lines were screened by ELISA for CTLA-4 expression (Fig. 1A). The cell lines showed different levels of CTLA-4 expression, with A549 displaying the highest concentration of CTLA-4 at 39.92 ± 1.46 ng per 20 μg total protein. The second highest was H460, which expressed CTLA-4 at 30.76 ± 4.61 ng per 20 μg total protein. Next, H358 and H522 showed similar CTLA-4 expression levels at 15.76 ± 2.48 and 16.22 ± 2.09 ng per 20 μg total protein, respectively. The lowest levels of CTLA-4 expression were detected in CALU-1 and H23 cell lines. A549, H460, and H358 cell lines were chosen for the remainder of the study. Before implanting mice, the ELISA results were verified using Western blot analysis (Fig. 1B). For the Western blot, β-actin was used as a control with a band near 43 kDa, while CTLA-4 was expected to produce a band slightly lower at 38 kDa. The most intense band for CTLA-4 was seen from A549 cells, followed by H460 with a moderate band, further validating the results obtained from ELISA. Lastly, H358 only showed a negligible band for CTLA-4. These in vitro tests provided the foundation for further in vivo analysis of the three cell lines.
Figure 1.
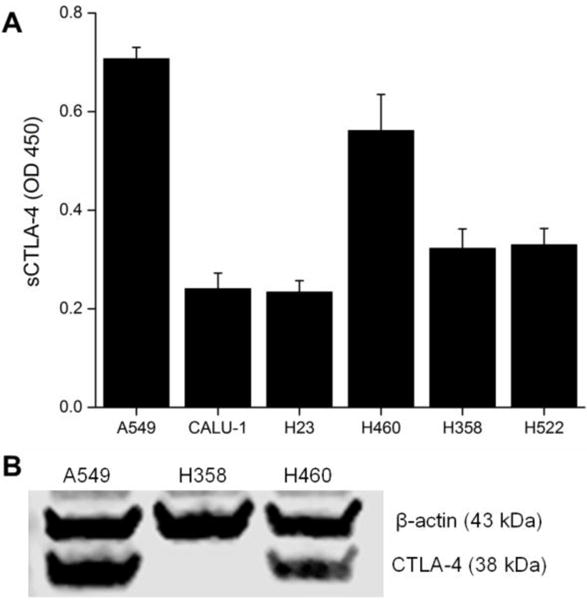
In vitro determination of CTLA-4 expression in lung cancer cell lines. (A) An ELISA revealed that CTLA-4 expression varied between six different lung cancer cell lines, with A549 and H460 showing the highest levels. (B) Western blot for CTLA-4 in the three non-small cell lung cancer (NSCLC) cell lines chosen for further experiments.
Binding Assay
Fluorescent internalization assays were performed on the three lung cancer cell lines to further verify that ipilimumab would bind and internalize in the three lung cancer cell lines. The binding and internalization of fluorescent-labeled ipilimumab was monitored for 24 h (Fig. 2). A549 cells displayed higher binding and internalization of ipilimumab over both H460 and H358 cells at the 24 h timepoint (n=4, p < 0.05). As expected, the amount of ipilimumab that was bound or internalized increased over time in highly CTLA-4-expressing A549 cells.
Figure 2.
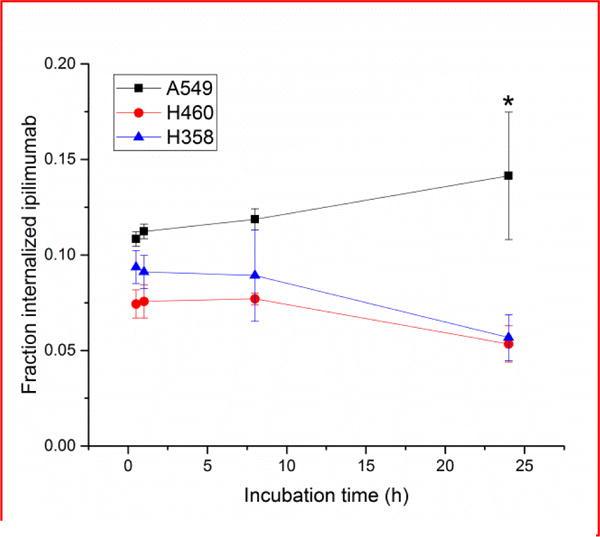
Internalization assays with lung cancer cells revealed higher binding and internalization fractions of ipilimumab to A549 cells over H460 and H358. *p < 0.05.
PET imaging and biodistribution in lung cancer xenografts
PET imaging was utilized to examine the biodistribution and pharmacokinetic properties of the CTLA-4 tracer, 64Cu-DOTA-ipilimumab, in mice bearing lung cancer xenografts. Maximum intensity projections of the PET images allowed for clear visual delineation of tumor margins in CTLA-4-expressing tissues, with A549 and H460 tumor xenografts showing higher uptake than H358 (Fig. 3). PET region-of-interest analysis verified the in vitro results (Fig. 4; Supplemental Table S1), with A549 tumor uptake peaking after 48 h at 9.80 ± 0.22 %ID/g, H460 at 9.37 ± 0.26 %ID/g, and H358 at 7.43 ± 0.05 %ID/g (n=3–4). To ensure that tracer accumulation in the tumor was specific, the CTLA-4 receptor was blocked by injecting excess cold ipilimumab 24 h prior to the injection of radiolabeled ipilimumab in A549 tumor-bearing mice. Blocking of the receptor demonstrated decreased tracer uptake of 6.90 ± 0.51 %ID/g at 48 h post-injection (n=4). Both A549 and H460 tumors displayed statistically significant increased uptake over H358 tumors at all time points. Statistically significant decreased uptake was also evident in the blocking group tumors compared to A549 (n=4; p<0.05). Since the tracer remained in circulation for the length of the study, tumor uptake increased over time in all groups. Notable accumulation was also observed in the liver, as it serves as the primary antibody clearance organ, with other off-target organs displaying minimal uptake. Tumors were easily delineated at all time points due to high tumor-to-muscle ratios in all groups. A549, H358, and the blocking group demonstrated peak tumor-to-muscle ratios at 48 h (9.51, 5.87, and 6.29, respectively) while H460 peaked at 24 h p.i. at 5.90. Similarly, A549 tumors demonstrated the highest tumor-to-blood ratio of 1.16 at 48 h post-injection, followed by H460 at 0.79, H358 at 0.71, and the blocking group at 0.66.
Figure 3.
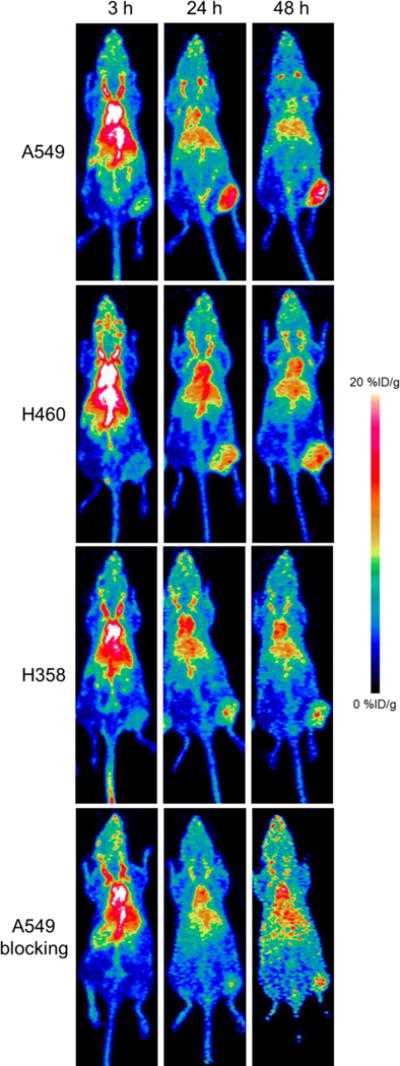
Representative maximum intensity projection images of longitudinal PET imaging in lung cancer xenograft – bearing mice. A549 tumors displayed the highest uptake of 64Cu-DOTA-ipilimumab at all timepoints.
Figure 4.
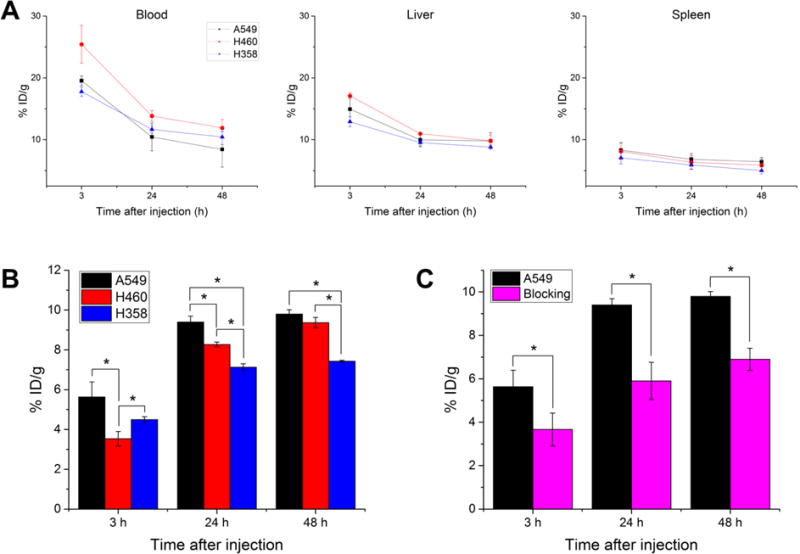
Quantification of PET regions-of-interest for several tissues over time. (A) The tracer remained in circulation over the length of the study for all three groups, while liver and spleen uptake were similar in all study groups. (B) Tumor uptake of 64Cu-DOTA-ipilimumab was higher in A549 and H460 at both 24 and 48 h p.i. (C) Injection of excess unlabeled ipilimumab prior to the tracer resulted in decreased tumor uptake at all timepoints in A549 tumors. *p < 0.05.
After the terminal imaging time point at 48 h after injection, mice were sacrificed and various organs were harvested, wet-weighted, and their radioactive content was determined through gamma counting (Fig. 5). The uptake values calculated from this study verified the trends found in the PET region-of-interest quantification, as A549 had the highest uptake (9.5 ± 2.4 %ID/g), followed by H460 (7.6 ± 1.2 %ID/g), the blocking group (6.8 ± 0.5 %ID/g), and the H358 mice (4.6 ± 1.3 %ID/g). The liver remained the organ with the highest off-target accumulation, ranging from 5–10 %ID/g. Other organs showed minimal tracer accumulation considered as background signal.
Figure 5.
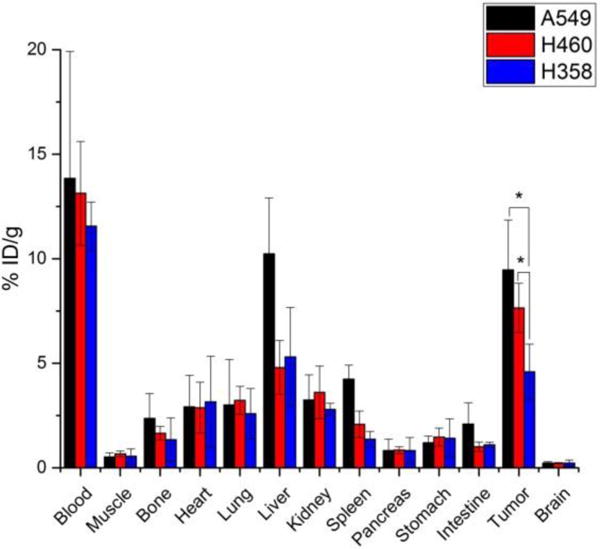
Ex vivo biodistribution studies at 48 h after injection of 64Cu-DOTA-ipilimumab. A549 and H460 tumors had significantly higher uptake than H358 tumors. *p<0.05.
Ex vivo tumor tissue analysis
Immunofluorescence staining of ex vivo xenograft tissues further validated the varying expression levels of CTLA-4 in lung cancer. Both CTLA-4 and nuclei were stained to determine the relative location of CTLA-4 on the cells (Fig. 6). A549 tissues displayed the highest staining levels, which was primarily localized to the surface of the cells as shown through the merged images. H460 tumor sections showed slightly lower staining of CTLA-4, which was more heterogeneously expressed. Lastly, H358 showed the lowest staining intensity, suggesting the lowest expression of CTLA-4, further validating previous in vitro assays and PET imaging. This tissue analysis corroborated the finding that the cancer cells themselves, rather than just tumor-infiltrating lymphocytes, express varying levels of CTLA-4.
Figure 6.
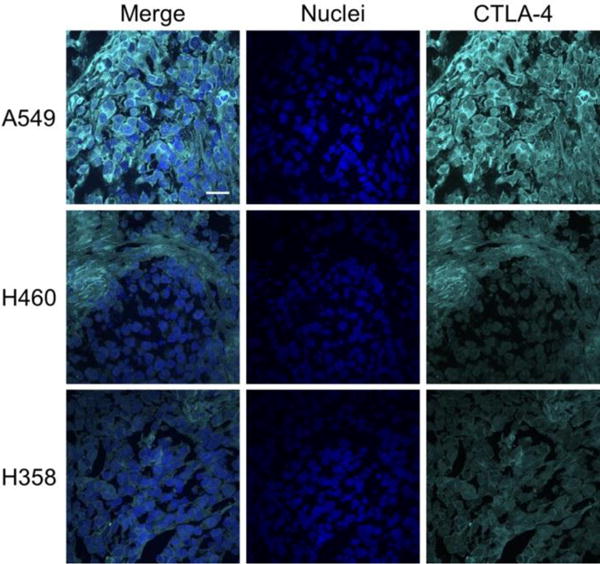
Immunohistochemical staining of ex vivo tumor tissues. A549 tumors displayed the highest staining levels for CTLA-4, followed by H460 and H358. Scale bar: 20 μm.
DISCUSSION
In recent years, immunotherapy has increasingly become a major player in the management of many cancers. The immune system is programmed to recognize foreign and invasive cells, while at the same time protecting host tissues which express self-antigens. However, many cancers hijack these protection mechanisms in order to escape detection by the immune system, effectively impeding both innate and adaptive immune responses17. Interventional interference with these protection pathways has been found to reactivate the immune system toward malignant cells and can lead to cancer remission in some patients18. CTLA-4, expressed by activated T-cells, has recently been recognized as an important target in cancer immunotherapy treatments. Blockade of this receptor has been shown to improve patient survival in several cancers, using the FDA-approved antibody ipilimumab3, 14. The efficacy of CTLA-4-targeted therapy is closely correlated to activated lymphocyte expression of CTLA-4, yet other factors may play a role in the overall success of immunotherapies. For example, it was recently determined that many tumor cell lines express CTLA-4, yet limited studies have investigated the role of CTLA-4 expression in tumor cells, making this expression still of debatable import7, 8. In this study, we evaluated the biodistribution of 64Cu-labeled ipilimumab in mice bearing CTLA-4-expressing tumor xenografts. The presence of CTLA-4 on tumor cells provides a simple, albeit artificial, model for tracking of CTLA-4 expression in this study, as CTLA-4 expression was solely localized on these tumor cells in the mice.
To validate that CTLA-4 was expressed in our lung cancer cell lines, we employed both ELISA and Western blot assays (Fig. 1). Both assays confirmed that CTLA-4 was expressed in the cancer cells, but did not provide insight into the subcellular localization of the protein. It has been extensively documented that CTLA-4 may be found on both intracellular membranes and the cell surface, yet our tracer would only have access to CTLA-4 expressed on the cell surface19. For this reason, we did not expect to find a linear correlation between tracer uptake and total CTLA-4 expression and PET imaging confirmed our thoughts. While A549 was shown to have higher CTLA-4 expression through in vitro studies, PET imaging revealed that both A549 and H460 showed similar tumor uptakes of 64Cu-DOTA-ipilimumab (Fig. 3–4). Also, binding of ipilimumab to H358 cells, and those in the blocking experiment, seems to be mostly nonspecific, as H358 cells were found to have low CTLA-4 expression levels. The use of these human lung cancer cell line xenografts provided a simple in vivo model to monitor CTLA-4 levels as a proof-of-concept for CTLA-4 PET imaging. Only the tumor exhibited specific binding of 64Cu-DOTA-ipilimumab, as this is the only tissue with human CTLA-4 expression (Fig. 3). Enhanced results may also be seen in future studies that will employ NOTA (1,4,7-triazacyclononane-1,4,7-trisacetic acid) as the Cu-64 chelator, as this compound has demonstrated enhanced radiolabeling stability20. Additionally, the use of Zr-89 (t1/2 = 78.4 h) and desferrioxamine chelator will allow extended imaging in order to further map the biodistribution of ipilimumab. In human studies, this tracer is expected to demonstrate a different biodistribution, as large sinks of CTLA-4 expression are found in tissues such as the spleen and lymph nodes21.
Currently, there have been few investigations into the molecular imaging of immunotherapy targets, especially CTLA-49. Previously, Higashikawa et al. developed an murine CTLA-4 antibody for imaging of CTLA-4-expressing tumor-infiltrating lymphocytes in CT-26-derived mouse colon cancer using murine subcutaneous xenograft models22. In this study, the tracer only bound to CTLA-4 expressed by tumor-infiltrating lymphocytes, as no uptake was seen in immunodeficient mice or in cell culture. By radiolabeling the murine antibody with 64Cu, the authors showed that 64Cu-DOTA-anti-CTLA-4 allowed for clear delineation of CT-26 tumors (SUVmax = 1.3). The biodistribution of other immune checkpoint targets have also been visualized with molecular imaging techniques, including PD-123, which is expressed by activated lymphocytes, and PD-L124, often found on tumor cells. In the future, molecular imaging of multiple targets may provide further insight into mechanisms, as combination therapies consisting of PD-1 and CTLA-4 therapies have shown enhanced efficacy in clinical trials25.
Treatment response to immunotherapeutic agents has been traditionally monitored using general molecular imaging tracers, including 18F-FLT during anti-CTLA-4 therapy with tremelimumab26 and 18F-FDG after nivolumab treatment against PD-127. While these tracers are well-studied in cancer, they may be limited by inflammatory responses, infections, and malignant tissues with low FDG avidity28. For patients treated with immunotherapies, the infiltration of lymphocytes and reactivation of the immune response will naturally result in some local inflammation, making distinction of response versus progression difficult with these tracers29. Hence, these tracers may not be effective for imaging of patient response to immunotherapies and targeting of specific cell surface receptors may provide additional benefit. As new evaluation criteria are being developed for immunotherapy treatments30, molecular imaging may come to be a staple in these evaluations if adequate tracers are developed.
A recent study evaluated CTLA-4 expression in tumor tissues of lung cancer patients. Higher expression levels were found in squamous cell carcinomas and in higher TNM stages5. Worse overall survival was predicted for patients with higher CTLA-4 expression levels, as determined by Affymetrix microarrays, using both a univariate and multivariate analysis (hazard ratio: 1.15 and 1.96, respectively). Determination of these levels may thus give physicians guidance in determining treatment regimens and possibly elucidate mechanisms of response. The importance of this tumor expression of CTLA-4 is still a topic of debate, as traditional checkpoint immunotherapy treatment utilizing the CTLA-4 pathway does not depend on expression of CTLA-4 by tumor cells. Rather, the inducible expression of the receptor on T-cells is of utmost importance for these treatments. Thus, the direct imaging of tumor cells explored in this study is not a direct analysis of immune checkpoint treatments; however, this CTLA-4 PET tracer has the potential to be an invaluable research tool preclinically for the development of new antibodies and small molecules, increasing the understanding of checkpoint blockade mechanisms, and mapping the biodistribution of CTLA-4 in therapeutic settings. Certainly, a greater understanding of a patient’s disease will allow physicians to make more informed treatment decisions. As we have herein verified that our tracer binds to CTLA-4-expressing tissues, it may find future application in clinically-relevant situations such as tracking CTLA-4+ T-cell populations, and may enable expedited clinical translation as it is founded upon an already clinically-approved antibody. To this end, the CTLA-4 PET tracer presented herein, 64Cu-DOTA-ipilimumab, has potential to be a highly specific imaging tracer in the arsenal of personalized medicine.
CONCLUSION
The PET tracer, 64Cu-DOTA-ipilimumab, was found to accumulate in CTLA-4-expressing tumors in vivo. Ipilimumab was found to bind to CTLA-4 expressed by the tumor cells themselves, as verified through Western blot, ELISA, binding assays, and ex vivo tissue analysis. This tracer holds great promise to aid in further understanding of immune checkpoint blockade therapy and the development of future CTLA-4-targeted treatments.
Acknowledgments
This work was supported, in part, by the University of Wisconsin - Madison, the National Institutes of Health (NIBIB/NCI 1R01CA169365, 1R01EB021336, T32GM008505, T32CA009206, P30CA014520), and the American Cancer Society (125246-RSG-13-099-01-CCE).
References
- 1.Buchbinder E, Hodi FS. Cytotoxic T lymphocyte antigen-4 and immune checkpoint blockade. J Clin Invest. 2015;125(9):3377–3383. doi: 10.1172/JCI80012. [DOI] [PMC free article] [PubMed] [Google Scholar]
- 2.Callahan MK, Wolchok JD. At the Bedside: CTLA-4- and PD-1-blocking antibodies in cancer immunotherapy. J Leukoc Biol. 2013;94(1):41–53. doi: 10.1189/jlb.1212631. [DOI] [PMC free article] [PubMed] [Google Scholar]
- 3.Kim DW, Trinh VA, Hwu W-J. Ipilimumab in the treatment of advanced melanoma – a clinical update. Expert Opin Biol Ther. 2014;14(11):1709–1718. doi: 10.1517/14712598.2014.963053. [DOI] [PubMed] [Google Scholar]
- 4.Ribas A, Kefford R, Marshall MA, Punt CJA, Haanen JB, Marmol M, Garbe C, Gogas H, Schachter J, Linette G, Lorigan P, Kendra KL, Maio M, Trefzer U, Smylie M, McArthur GA, Dreno B, Nathan PD, Mackiewicz J, Kirkwood JM, Gomez-Navarro J, Huang B, Pavlov D, Hauschild A. Phase III randomized clinical trial comparing Tremelimumab with standard-of-care chemotherapy in patients with advanced melanoma. J Clin Oncol. 2013;31(5):616–622. doi: 10.1200/JCO.2012.44.6112. [DOI] [PMC free article] [PubMed] [Google Scholar]
- 5.Deng L, Gyorffy B, Na F, Chen B, Lan J, Xue J, Zhou L, Lu Y. Association of PDCD1 and CTLA-4 Gene Expression with Clinicopathological Factors and Survival in Non–Small-Cell Lung Cancer: Results from a Large and Pooled Microarray Database. J Thorac Oncol. 2015;10(7):1020–1026. doi: 10.1097/JTO.0000000000000550. [DOI] [PubMed] [Google Scholar]
- 6.Antczak A, Pastuszak-Lewandoska, Dorotarski P, Domaska D, Migdalska-Sk M, Czarnecka K, Nawrot E, Kordiak J, Brzeziaska E. CTLA-4 Expression and Polymorphisms in Lung Tissue of Patients with Diagnosed Non-Small-Cell Lung Cancer. BioMed Res Int. 2013;2013:8. doi: 10.1155/2013/576486. [DOI] [PMC free article] [PubMed] [Google Scholar]
- 7.Salvi S, Fontana V, Boccardo S, Merlo DF, Margallo E, Laurent S, Morabito A, Rijavec E, Dal Bello MG, Mora M, Ratto GB, Grossi F, Truini M, Pistillo MP. Evaluation of CTLA-4 expression and relevance as a novel prognostic factor in patients with non-small cell lung cancer. Cancer Immunol Immunother. 2012;61(9):1463–1472. doi: 10.1007/s00262-012-1211-y. [DOI] [PMC free article] [PubMed] [Google Scholar]
- 8.Contardi E, Palmisano GL, Tazzari PL, Martelli AM, Falà F, Fabbi M, Kato T, Lucarelli E, Donati D, Polito L, Bolognesi A, Ricci F, Salvi S, Gargaglione V, Mantero S, Alberghini M, Ferrara GB, Pistillo MP. CTLA-4 is constitutively expressed on tumor cells and can trigger apoptosis upon ligand interaction. Int J Cancer. 2005;117(4):538–550. doi: 10.1002/ijc.21155. [DOI] [PubMed] [Google Scholar]
- 9.Ehlerding EB, England CG, McNeel DG, Cai W. Molecular Imaging of Immunotherapy Targets in Cancer. J Nucl Med. 2016 doi: 10.2967/jnumed.116.177493. [DOI] [PMC free article] [PubMed] [Google Scholar]
- 10.MacManus M, Everitt S, Hicks RJ. The Evolving Role of Molecular Imaging in Non–Small Cell Lung Cancer Radiotherapy. Semin Radiat Oncol. 2015;25(2):133–142. doi: 10.1016/j.semradonc.2014.12.001. [DOI] [PubMed] [Google Scholar]
- 11.Larimer BM, Wehrenberg-Klee E, Caraballo A, Mahmood U. Quantitative CD3 PET imaging predicts tumor growth response to anti-CTLA-4 therapy. J Nucl Med. 2016 doi: 10.2967/jnumed.116.173930. ePub ahead of print. [DOI] [PMC free article] [PubMed] [Google Scholar]
- 12.Society, A.C. Cancer Facts & Figures 2016. American Cancer Society; 2016. [Google Scholar]
- 13.Malik PS, Raina V. Lung cancer: Prevalent trends & emerging concepts. Indian J Med Res. 2015;141(1):5–7. doi: 10.4103/0971-5916.154479. [DOI] [PMC free article] [PubMed] [Google Scholar]
- 14.Lynch TJ, Bondarenko I, Luft A, Serwatowski P, Barlesi F, Chacko R, Sebastian M, Neal J, Lu H, Cuillerot JM, Reck M. Ipilimumab in Combination With Paclitaxel and Carboplatin As First-Line Treatment in Stage IIIB/IV Non–Small-Cell Lung Cancer: Results From a Randomized, Double-Blind, Multicenter Phase II Study. J Clin Oncol. 2012;30(17):2046–2054. doi: 10.1200/JCO.2011.38.4032. [DOI] [PubMed] [Google Scholar]
- 15.Hong H, Yang Y, Zhang Y, Engle JW, Barnhart TE, Nickles RJ, Leigh BR, Cai W. Positron emission tomography imaging of CD105 expression during tumor angiogenesis. Eur J Nucl Med Mol Imaging. 2011;38(7):1335–1343. doi: 10.1007/s00259-011-1765-5. [DOI] [PMC free article] [PubMed] [Google Scholar]
- 16.Nickles RJ, Avila-Rodrigues MA, Nye JA, Houser EN, Selwyn RG, Schueller MJ, Christian BT, Jensen M. Sustainable production of orphan radionuclides at Wisconsin. Q J Nucl Med Mol Imaging. 2008;52(2):134–139. [PMC free article] [PubMed] [Google Scholar]
- 17.Pardoll DM. The blockade of immune checkpoints in cancer immunotherapy. Nat Rev Cancer. 2012;12(4):252–264. doi: 10.1038/nrc3239. [DOI] [PMC free article] [PubMed] [Google Scholar]
- 18.Topalian Suzanne L, Drake Charles G, Pardoll Drew M. Immune checkpoint blockade: A common denominator approach to cancer therapy. Cancer Cell. 2015;27(4):450–461. doi: 10.1016/j.ccell.2015.03.001. [DOI] [PMC free article] [PubMed] [Google Scholar]
- 19.Atlas, T.H.P., CTLA-4. proteinatlas.org, 2017.
- 20.Zhang Y, Hong H, Engle JW, Bean J, Yang Y, Leigh BR, Barnhart TE, Cai W. Positron Emission Tomography Imaging of CD105 Expression with a 64Cu-Labeled Monoclonal Antibody: NOTA Is Superior to DOTA. PLOS ONE. 2011;6(12):e28005. doi: 10.1371/journal.pone.0028005. [DOI] [PMC free article] [PubMed] [Google Scholar]
- 21.The Human Protein Atlas: CTLA-4. 2017.
- 22.Higashikawa K, Yagi K, Watanabe K, Kamino S, Ueda M, Hiromura M, Enomoto S. (64)Cu-DOTA-Anti-CTLA-4 mAb enabled PET visualization of CTLA-4 on the T-cell infiltrating tumor tissues. PLoS ONE. 2014;9(11):e109866. doi: 10.1371/journal.pone.0109866. [DOI] [PMC free article] [PubMed] [Google Scholar]
- 23.England CG, Ehlerding EB, Hernandez R, Rekoske BT, Graves SA, Sun H, Liu G, McNeel DG, Barnhart TE, Cai W. Preclinical Pharmacokinetics and Biodistribution Studies of 89Zr-labeled Pembrolizumab. J Nucl Med. 2016 doi: 10.2967/jnumed.116.177857. [DOI] [PMC free article] [PubMed] [Google Scholar]
- 24.Hettich M, Braun F, Bartholoma MD, Schirmbeck R, Niedermann G. High-Resolution PET imaging with therapeutic antibody-based PD-1/PD-L1 checkpoint tracers. Theranostics. 2016;6(10):1629–1640. doi: 10.7150/thno.15253. [DOI] [PMC free article] [PubMed] [Google Scholar]
- 25.Das R, Verma R, Sznol M, Boddupalli CS, Gettinger SN, Kluger H, Callahan M, Wolchok JD, Halaban R, Dhodapkar MV, Dhodapkar KM. Combination therapy with anti–CTLA-4 and anti–PD-1 leads to distinct immunologic changes in vivo. J Immunol. 2015;194(3):950–959. doi: 10.4049/jimmunol.1401686. [DOI] [PMC free article] [PubMed] [Google Scholar]
- 26.Ribas A, Benz MR, Allen-Auerbach MS, Radu C, Chmielowski B, Seja E, Williams JL, Gomez-Navarro J, McCarthy T, Czernin J. Imaging of CTLA4 Blockade–Induced Cell Replication with 18F-FLT PET in Patients with Advanced Melanoma Treated with Tremelimumab. J Nucl Med. 2010;51(3):340–346. doi: 10.2967/jnumed.109.070946. [DOI] [PubMed] [Google Scholar]
- 27.Higuchi M, Owada Y, Inoue T, Watanabe Y, Yamaura T, Fukuhara M, Hasegawa T, Suzuki H. FDG-PET in the evaluation of response to nivolumab in recurrent non-small-cell lung cancer. World J Surg Oncol. 2016;14(1):238. doi: 10.1186/s12957-016-0998-y. [DOI] [PMC free article] [PubMed] [Google Scholar]
- 28.Griffeth LK. Use of PET/CT scanning in cancer patients: technical and practical considerations. Proc (Bayl Univ Med Cent) 2005;18(4):321–330. doi: 10.1080/08998280.2005.11928089. [DOI] [PMC free article] [PubMed] [Google Scholar]
- 29.Perng P, Marcus C, Subramaniam RM. 18F-FDG PET/CT and Melanoma: Staging, Immune Modulation and Mutation-Targeted Therapy Assessment, and Prognosis. American Journal of Roentgenology. 2015;205(2):259–270. doi: 10.2214/AJR.14.13575. [DOI] [PubMed] [Google Scholar]
- 30.Hodi FS, Hwu WJ, Kefford R, Weber JS, Daud A, Hamid O, Patnaik A, Ribas A, Robert C, Gangadhar TC, Joshua AM, Hersey P, Dronca R, Joseph R, Hille D, Xue D, Li XN, Kang SP, Ebbinghaus S, Perrone A, Wolchok JD. Evaluation of Immune-Related Response Criteria and RECIST v1.1 in Patients With Advanced Melanoma Treated With Pembrolizumab. J Clin Oncol. 2016;34(13):1510–1517. doi: 10.1200/JCO.2015.64.0391. [DOI] [PMC free article] [PubMed] [Google Scholar]