Abstract
Objective
The objective of this study was to evaluate increasing doses of a novel microbial phytase (Cibenza Phytaverse, Novus International, St. Charles, MO, USA) on standardized total tract digestibility (STTD) of P in canola meal (CM), corn, corn-derived distiller’s dried grains with solubles (DDGS), rice bran (RB), sorghum, soybean meal (SBM), sunflower meal (SFM), and wheat.
Methods
Two cohorts of 36 pigs each (initial body weight = 78.5±3.7 kg) were randomly assigned to 2 rooms, each housing 36 pigs, and then allotted to 6 diets with 6 replicates per diet in a randomized complete block design. Test ingredient was the only dietary source of P and diets contained 6 concentrations of phytase (0, 125, 250, 500, 1,000, or 2,000 phytase units [FTU]/kg) with 0.4% of TiO2 as a digestibility marker. Feeding schedule for each ingredient was 5 d acclimation, 5 d fecal collection, and 4 d washout. The STTD of P increased (linear or exponential p≤0.001) with the inclusion of phytase for all ingredients.
Results
Basal STTD of P was 37.6% for CM, 37.6% for corn, 68.6% for DDGS, 10.3% for RB, 41.2% for sorghum, 36.7% for SBM, 26.2% for SFM, and 55.1% for wheat. The efficiency of this novel phytase to hydrolyze phytate is best described with a broken-line model for corn, an exponential model for CM, RB, SBM, SFM, and wheat, and a linear model for DDGS and sorghum. Based on best-fit model the phytase dose (FTU/kg) needed for highest STTD of P (%), respectively, was 735 for 64.3% in CM, 550 for 69.4% in corn, 160 for 55.5% in SBM, 1,219 for 57.8% in SFM, and 881 for 64.0% in wheat, whereas a maximum response was not obtained for sorghum, DDGS and RB within the evaluated phytase range of 0 to 2,000 FTU/kg. These differences in the phytase concentration needed to maximize the STTD of P clearly indicate that the enzyme does not have the same hydrolysis efficiency among the evaluated ingredients.
Conclusion
Variations in enzyme efficacy to release P from phytate in various feedstuffs need to be taken into consideration when determining the matrix value for phytase in a mixed diet, which likely depends on the type and inclusion concentration of ingredients used in mixed diets for pigs. The use of a fixed P matrix value across different diet types for a given phytase concentration is discouraged as it may result in inaccurate diet formulation.
Keywords: Digestibility, Ingredients, Pig, Phosphorus, Phytase
INTRODUCTION
myo-Inositol is a cyclic alcohol derivative from glucose that provides the backbone for phytate. Phytic acid is the primary form of phosphorus in seeds, the common name for myo inositol-1,2,3,4,5,6-hexakisphosphate (IP6), and can account for up to 75% of total P present in seeds [1]. There are 2 conformational forms of phytic acid, 5ax/1eq and 1ax/5eq, with the latter being the sterically favorable form containing 1 axial phosphate and 5 equatorial phosphates. Form 5ax/1eq is sterically hindered, generally referred to as phytin, and can be stabilized upon formation of salt complexes with metal cations [2]. These complexes reduce the bioavailability of P and other essential mineral cations for monogastrics, due to low levels of endogenous phytase present in seeds as well as in the gastro-intestinal tract of monogastrics. The hexakisphosphoric acid ester of myo-inositol or phytate is another common structure of phytic acid. myo-Inositol-hexakisphosphate phosphohydrolase (EC 3.1.3.8) is the endogenous seed enzyme responsible for phytate degradation during germination to release phosphorus and other cation metals. Thus, animal diets containing seeds as dietary ingredients will have low level of endogenous phytase activity, because vertebrates’ low secretion of endogenous phytase and low endogenous phytase activity in grains and grain byproducts result in low standardized total tract digestibility (STTD) of P present in vegetable feedstuffs [3]. Grain byproducts obtained from fermentation processes, such as distillers dried grains with solubles (DDGS), have considerably higher STTD of P [3,4] compared with corn.
The efficacy of fungal- and bacterial-derived phytases have been extensively researched over the last decades in complete diets [5], but few studies have focused on its P releasing effects on individual ingredients [4,6,7]. Previous results indicate that the response of phytase supplementation on bone ash [8] or STTD of P in diets [9] can be explained by fitting either quadratic or broken-line curves to determine the inflexion or break-point, both of which correspond to the maximal concentration of phytase needed to reach a plateau in the response variable. Therefore, the objectives of this work were to quantify as well as to fit linear, quadratic, exponential or broken-line curves for STTD of P in individual ingredients commonly used in swine diets with increasing concentrations of a novel bacterial-derived 6 phytase supplementation.
MATERIALS AND METHODS
Animals and housing, and experimental design
All animal protocols were reviewed and approved by a licensed veterinarian, and followed guidelines indicated in the Guide for the Care and Use of Agricultural Animals in Research and Teaching [10] with the exception of floor space. A total of 72 TR4×C22 (PIC, Hendersonville, TN, USA) castrated males (initial body weight [BW] 78.5±3.7 kg) were obtained from a commercial facility in Auxvasse, MO and individually housed in plastic-coated floor pens that limited their ability to turn around to avoid contact of the mouth with feces. Pens were located above a shallow pit, equipped with an automated scrapper and inside a mechanically ventilated building. Eight independent experiments were conducted using two cohorts of 36 pigs each (72 pigs in total). The experimental design for each ingredient consisted of a randomized complete block design using 6 individually housed pigs for each of 6 concentrations (i.e., 0, 125, 250, 500, 1,000, and 2,000 phytase units [FTU]/kg) of phytase supplementation (36 pigs per ingredient). Pigs were allotted to diets based on BW. Two ingredients were simultaneously but independently tested, one ingredient in each pig cohort. Ingredient testing order was randomly assigned with alternation between proteinaceous and cereal ingredients. Testing order for cohort 1 was soybean meal (SBM), sorghum, sunflower meal (SFM), and wheat; and for cohort 2 was corn, canola meal (CM), rice bran (RB), and DDGS. Room temperature was set at 22°C and lighting regime was 16 h light:8 h dark with lights on at 0600.
Diets and feeding regimen
The test ingredient was the only dietary source of P in all semi-purified diets [4,11]. Dietary requirements for vitamins, and minerals except P, were met or exceeded for all diets [3]. Phytase (Cibenza Phytaverse, Novus International, St. Charles, MO, USA) was added at the expense of cornstarch (Table 1). All diets included 0.4% of TiO2 as digestibility marker to determine apparent total tract digestibility (ATTD) of P. Pigs were fed at a level of 3 times their estimated ME needs for maintenance (197 kcal/kg BW0.60; [12]) to ensure a quick consumption of feed allowance to minimize orts and wastage. Daily feed allowance was divided into 2 equal meals provided at 0600 and 1600; water was available at all times. Pigs were fed experimental diets for 10 d, of which the first 5 d were considered the adaptation period for each diet. Afterwards, pigs were fed a washout diet for 4 d that exceeded all nutrient needs [3]. Testing of low CP (i.e., corn, sorghum, wheat, and RB) and proteinaceous (i.e., SBM, CM, SFM, and DDGS) was alternated, and testing order of ingredients was randomly assigned within each group of ingredients.
Table 1.
Ingredient and analyzed nutrient composition of basal diets (as-fed basis)1)
| Items | Basal diets | |||||||
|---|---|---|---|---|---|---|---|---|
|
| ||||||||
| Canola meal | Corn | DDGS | Rice bran | Sorghum | Soybean meal | Sunflower meal | Wheat | |
| Ingredient (%) | ||||||||
| Test ingredient | 48.00 | 96.40 | 50.00 | 50.00 | 96.40 | 50.00 | 50.00 | 96.40 |
| Cornstarch | 28.35 | 0.10 | 25.50 | 25.70 | 0.10 | 35.85 | 25.95 | 0.10 |
| Sucrose | 20.00 | - | 20.00 | 20.00 | - | 10.00 | 20.00 | - |
| Soy oil | 2.00 | 1.00 | 2.00 | 2.00 | 1.00 | 2.00 | 2.00 | 1.00 |
| Limestone | 0.55 | 1.40 | 1.40 | 1.20 | 1.40 | 1.10 | 0.95 | 1.40 |
| Vitamin-mineral premix2) | 0.30 | 0.30 | 0.30 | 0.30 | 0.30 | 0.30 | 0.30 | 0.30 |
| Salt | 0.40 | 0.40 | 0.40 | 0.40 | 0.40 | 0.40 | 0.40 | 0.40 |
| TiO2 | 0.40 | 0.40 | 0.40 | 0.40 | 0.40 | 0.40 | 0.40 | 0.40 |
| Analyzed nutrients (%) | ||||||||
| DM | 93.7 | 93.5 | 94.1 | 95.0 | 88.4 | 91.9 | 93.6 | 89.8 |
| Calcium | 0.62 | 0.66 | 0.66 | 1.19 | 0.59 | 0.53 | 0.57 | 0.49 |
| Total phosphorus | 0.61 | 0.24 | 0.43 | 0.91 | 0.28 | 0.28 | 0.52 | 0.38 |
DDGS, distillers dried grains with solubles derived from corn; DM, dry matter.
Bacterial-derived phytase (Cibenza Phytaverse, Novus International Inc., St. Charles, MO, USA) was added to each diet at the expense of cornstarch to provide 125, 250, 500, 1,000, or 2,000 FTU/kg.
Provided the following quantities of vitamins and trace minerals per kg of complete diet: Vitamin A as retinyl acetate, 11,128 IU; vitamin D3 as cholecalciferol, 2,204 IU; vitamin E as DL-α-tocopheryl acetate, 66 IU; vitamin K as menadione nicotinamide bisulfate, 1.42 mg; thiamin as thiamine mononitrate, 0.24 mg; riboflavin, 6.58 mg; pyridoxine as pyridoxine hydrochloride, 0.24 mg; vitamin B12, 0.03 mg; D-pantothenic acid as D-calcium pantothenate, 23.5 mg; niacin as nicotinamide, 1.0 mg, and nicotinic acid, 43.0 mg; folic acid, 1.58 mg; biotin, 0.44 mg; Cu, 10 mg as copper sulfate; Fe, 125 mg as iron sulfate; I, 1.26 mg as calcium iodate; Mn, 60 mg as manganese sulfate; Se, 0.3 mg as sodium selenite; and Zn, 100 mg as zinc sulfate.
Sample collection, analytical procedures, and calculations
During the 5 d of fecal collection, samples were collected after each feeding bout and immediately placed in a heated oven (NHP-PD-ECO, Win-Holt, Woodbury, NY, USA) at 65°C [4] for 12 to 18 h. Dried feces were stored at room temperature. At the end of the study diets, all dried fecal samples were ground using a rotor mill (Pulverisette 14, Fritsch GmbH, Idar-Oberstein, Germany) fitted with a 1-mm screen. Grounded feces and diets were thoroughly homogenized and a sample was collected for analyses. Diets and fecal samples were analyzed for dry matter (DM, method 930.15; [13]), phytase activity (method 30024; [14]), and dry ash (method 942.05; [13]), and solubilized in 12.1 M HCl (for P) or 7.4 M H2SO4 (for Ti), and analyzed for P using inductively coupled plasma spectroscopy (method 985.01; [13]) and using spectrophotometry at 410 nm for Ti [15]. The ATTD of P for each diet was calculated using the following equation [16]:
Where PFeces is P concentration in dry feces, PDiet is P concentration in diet, TiO2Diet is TiO2 concentration in diet, and TiO2Feces is TiO2 concentration in feces; all values are g/kg in DM basis. The STTD of P was calculated according to the following equation [3]:
Where PDiet is g of P per kg of DM diet and EPLBasal are basal endogenous phosphorus losses (EPL), which are fairly constant [4,17] and an estimated of 190 mg of P per kg dry matter intake (DMI) was used [3].
Statistical analysis
The proc univariate procedure of SAS (version 9.4; SAS Inst. Inc., Cary, NC, USA) was used to tested data for normality and outliers (values outside 1.5 interquartile range from greater and lesser quartiles) were removed from the data set. The model included diet as the fixed effect and block as a random effect. Linear and quadratic responses to the inclusion of increasing concentrations of phytase to the diets were determined by orthogonal polynomial contrasts. Coefficients for unequally spaced concentrations of supplemental phytase were obtained using the interactive matrix language procedure (proc iml) of SAS. For each ingredient, a single-slope broken line model (proc nlin) was first fitted to determine the coefficients to be used in the nonlinear mixed approach (proc nlmixed) using pig as a random variable [18]. Regression equations were obtained using the proc glm (linear and quadratic) or proc nlmixed (broken line and exponential) procedure of SAS. The goodness of fit for each regression equation was determined by calculating the Schwarz’s Bayesian information criteria index (BIC; [19]) using proc nlmixed (for broken-line and exponential regressions) or proc mixed (for linear and quadratic regressions) procedures of SAS. The pig was the experimental unit for all analyses and an alpha level of 0.05 was used to assess significant differences among means.
Phosphorus value (STTD P) of phytase by type of diet
The practical P value (STTD P) of the phytase used in this study was determined by formulating three commercially relevant diets and to generate a final diet STTD P value as postulated in this study depending on phytase dose (Table 6). These three diets were formulated to meet or exceed the nutrient requirements of 25-kg pigs [3], except for STTD P, which was solely provided by plant feed ingredients in each diet. The feed ingredients used in each diet were chosen to reflect plausible ingredient choices and inclusion levels fed to pigs. In this simulation, phytase was supplemented to each of the 3 diets at concentrations within the range (i.e., from 0 to 2,000 FTU/kg) used in this experiment and appropriate response curves to STTD of P were applied to each ingredient based on best-fit regression equations determined in this experiment for each particular feed ingredient (Table 4). The amount of STTD P release for each diet was then calculated by subtracting the STTD P in the basal diet from the STTD P at any given phytase concentration within the same diet type.
Table 6.
Ingredient and nutrient composition of hypothetical diets
| Items | Diet | ||
|---|---|---|---|
|
| |||
| A | B | C | |
| Ingredient (%) | |||
| Corn | 45.00 | 40.00 | 70.14 |
| Rice bran | - | 20.11 | - |
| Sunflower meal | 19.58 | - | - |
| Soybean meal | 11.37 | 30.69 | 25.85 |
| Canola meal | 8.72 | - | - |
| Wheat, soft | 5.00 | - | - |
| Soybean oil | 7.50 | 6.39 | 1.05 |
| Limestone | 1.27 | 1.40 | 1.48 |
| Dicalcium phosphate | - | - | - |
| Others1) | 1.56 | 1.41 | 1.48 |
| Nutrients | |||
| ME (kcal/kg) | 3,350 | 3,350 | 3,350 |
| CP (%) | 19.51 | 21.84 | 18.65 |
| SID Lys (%) | 1.10 | 1.10 | 1.10 |
| Ca (%) | 0.71 | 0.71 | 0.71 |
| Total P (%) | 0.49 | 0.70 | 0.37 |
| Basal STTD P (%) | 0.166 | 0.137 | 0.112 |
| Phytase STTD P (%)2) | 0.287 | 0.228 | 0.198 |
ME, metabolizable energy; CP, crude protein; SID, standardized ileal digestible; P, phosphorus; STTD, standardized total tract digestibility; FTU, phytase units.
Includes vitamins, minerals, amino acids, salt, etc.
Phytase inclusion at 500 FTU per kg of feed.
Table 4.
Bayesian information criterion (BIC) for the regression models evaluated1)
| Ingredient | Method | |||
|---|---|---|---|---|
|
| ||||
| Broken-line | Linear | Quadratic | Exponential | |
| Canola meal | 223.7 | 256.1 | 256.3 | 218.1 |
| Corn | 243.2 | 258.1 | 268.3 | 245.1 |
| DDGS | 191.4 | 188.0 | 200.6 | 188.0 |
| Rice Bran | 174.6 | 174.5 | 197.3 | 169.8 |
| Sorghum | 254.9 | 252.5 | 271.9 | 252.5 |
| Soybean meal | 263.3 | 270.2 | 287.2 | 261.1 |
| Sunflower meal | 219.8 | 230.7 | 237.6 | 215.5 |
| Wheat | 239.6 | 239.3 | 259.2 | 237.4 |
DDGS, distillers dried grains with solubles derived from corn.
A lower value for BIC indicates the best model to describe the data.
RESULTS AND DISCUSSION
The analyzed concentration of total P in the tested feed ingredients is presented in Table 2. Analyzed results are in close agreement with previously reported values and were determined to be within±1 standard deviation [3]. Exogenous phytases have been successfully used in the swine and poultry industries for many decades for the improvement of P utilization [5]. Phytases are generally produced from microbes or they may originate from plants [9]. It is well-known, however, that phytases originating from different organisms exert different physical and biochemical properties, which dictate the efficacy of exogenous phytases in swine and poultry [20]. Thus, as new sources of phytase are developed, evaluation of its efficacy in improving P utilization in monogastric animals is warranted. The phytase used in the present study is a novel bacterial-derived 6-phytase expressed in Psedomonas fluorescens and to the best of our knowledge, no data is available demonstrating its efficacy in improving P digestibility in feed ingredients commonly fed to pigs.
Table 2.
Analyzed concentration of total phosphorus in test ingredients
| Ingredient | Present study | Swine NRC, 20121) |
|---|---|---|
| Canola meal | 1.27 | 1.08±0.07 |
| Corn | 0.25 | 0.26±0.05 |
| DDGS | 0.84 | 0.60±0.20 |
| Rice bran2) | 1.74 | 1.89 |
| Sorghum | 0.28 | 0.27±0.06 |
| Soybean meal | 0.57 | 0.71±0.09 |
| Sunflower meal | 1.04 | 0.95±.09 |
| Wheat, soft | 0.36 | 0.30±0.03 |
DDGS, distillers dried grains with solubles derived from corn; SD, standard deviation.
Values refer to mean±SD.
Value for SD not reported.
Values for the STTD of P determined for each tested feed ingredient without the addition of phytase are in agreement with values reported in the literature ([3,21]; Table 2). For all feed ingredients tested in this experiment, the STTD of P increased with graded concentrations of phytase (Table 3). Using BIC, it was determined the best model that describes the relationship between phytase dose supplementation and STTD of P was broken-line for corn, exponential for CM, RB, SBM, SFM, and wheat, and linear and exponential were equally good for DDGS and sorghum (Table 4). The concentration of phytase needed to maximize the STTD of P for both DDGS and sorghum was estimated to be greater than 2,000 FTU/kg, which is outside the studied range for the enzyme, and hence it is concluded that a linear model is the best fit (Table 5). Quadratic regression had the highest BIC value for all ingredients indicating the poorest goodness of fit (Table 4). The STTD of P increased from 37.6% to 69.0% in CM, 37.6% to 73.9% in corn, 68.6% to 77.0% in DDGS, 10.3% to 33.1% in RB, 41.2% to 72.7% in sorghum, 36.7% to 55.1% in SBM, 26.2% to 59.6% in SFM, and 55.1% to 66.6% in wheat when phytase was supplemented at 0 or 2,000 FTU/kg, respectively (Table 3). Almeida and Stein [11] reported linear and quadratic response for the STTD of P in corn when phytase was supplemented from 0 to 1,100 FTU/kg. In the present study, STTD of P increased with graded concentrations of phytase in corn in a broken-line manner (i.e., lowest BIC score). Thus, both studies indicate that the amount of P released from corn depends on the amount of phytase included in the diet. However, the ability of different phytases to increase STTD of P and best regression model to describe each enzyme response in different ingredients needs to be evaluated simultaneously in vivo. The response measured for the STTD of P in DDGS in the present experiment; however, does not agree with previously reported data [11], in which phytase did not improve the STTD of P in DDGS. Importantly, the STTD of P in DDGS reported by [11] was 76.9%, which is higher than the determined STTD of P for DDGS in this experiment (68.6%). Thus, it is possible that phytase responded differently in this experiment because of a higher concentration of phytate in DDGS used herein, although the present experiment did not measure phytate concentration or due to differences in the ability of phytases to hydrolyze phytate in DDGS.
Table 3.
Effects of increasing phytase supplementation concentration on the standardized total tract digestibility (STTD) of P in ingredients commonly fed to pigs1)
| Items | Feed ingredient | |||||||
|---|---|---|---|---|---|---|---|---|
|
| ||||||||
| Canola meal | Corn | DDGS | Rice bran | Sorghum | Soybean meal | Sunflower meal | Wheat | |
| Phytase (FTU/kg) | ||||||||
| 0 | 37.6±0.9 | 37.6±2.1 | 68.6±1.2 | 10.3±1.6 | 41.2±1.8 | 36.7±1.9 | 26.2±3.5 | 55.1±1.4 |
| 125 | 46.1±1.2 | 37.0±3.0 | 68.0±2.3 | 13.4±0.7 | 52.4±3.8 | 51.0±5.0 | 34.8±3.0 | 50.9±1.5 |
| 250 | 52.6±2.0 | 47.9±2.3 | 69.4±1.0 | 16.8±0.8 | 43.7±2.9 | 64.8±5.1 | 40.0±2.5 | 56.4±2.6 |
| 500 | 63.3±0.7 | 68.0±2.6 | 63.6±2.1 | 18.5±1.3 | 54.5±4.1 | 54.3±3.2 | 46.4±2.1 | 64.4±1.8 |
| 1,000 | 63.4±1.8 | 62.6±2.8 | 66.2±0.4 | 23.6±1.2 | 67.5±4.1 | 59.9±3.7 | 58.0±4.7 | 63.8±4.3 |
| 2,000 | 69.0±2.7 | 73.9±3.7 | 77.0±1.9 | 33.1±1.1 | 72.7±5.7 | 55.1±5.1 | 59.6±1.8 | 66.6±3.9 |
| p-value | ||||||||
| Linear | <0.001 | <0.001 | 0.001 | <0.001 | <0.001 | 0.25 | <0.001 | <0.001 |
| Quadratic | <0.001 | <0.001 | <0.001 | <0.001 | <0.001 | 0.04 | <0.001 | <0.001 |
| Exponential | <0.001 | <0.001 | 0.003 | <0.001 | <0.001 | <0.001 | <0.001 | <0.001 |
| Broken-line | <0.001 | <0.001 | 0.001 | <0.001 | <0.001 | <0.001 | <0.001 | <0.001 |
DDGS, distillers dried grains with solubles derived from corn; FTU, phytase units.
Data are means of 6 observations per treatment±standard error.
Table 5.
Phytase concentration needed to maximize the standardized total tract digestibility (STTD) of P in various feed ingredients determined by best goodness of fit regressions, and the first intercept of quadratic and exponential models with the plateau of the broken-line model
| Ingredient | Best model1) | STTD of P (%) | Phytase (FTU/kg) | |||
|---|---|---|---|---|---|---|
|
|
|
|||||
| Basal2) | Maximum | Maximum3) | Quadratic | Exponential | ||
| Canola meal | Exponential | 37.9 | 64.3 | 735 | 810 | 837 |
| Corn | Broken-line | 33.4 | 69.4 | 550 | 896 | 1,042 |
| DDGS4) | Linear | 66.6 | - | - | ND5) | ND |
| Rice bran | Exponential | 12.1 | - | - | ND | ND |
| Sorghum6) | Linear | 42.7 | - | - | 1,741 | 1,825 |
| Soybean meal | Exponential | 36.7 | 55.5 | 160 | 547 | NE7) |
| Sunflower meal | Exponential | 28.3 | 57.8 | 1,219 | 1,019 | 1,440 |
| Wheat | Exponential | 51.8 | 64.0 | 881 | 956 | 1,175 |
DDGS, distillers dried grains with solubles derived from corn; FTU, phytase units; ND, not determined; NE, not estimated.
Lowest Bayesian information criterion, see Table 4 for details.
Basal refers to values for STTD of P without phytase supplementation.
At plateau for broken line or 95% of upper asymptote for exponential (Robbins et al [25]).
Linear equation: STTD of P = 66.6+0.004×phytase dose in FTU/kg, r2 = 0.33, p = 0.001.
A broken-line plateau was not obtained within the evaluated range of phytase supplementation of 0 to 2,000 FTU/kg.
Sorghum linear equation: STTD of P = 45.36+0.0156×phytase dose in FTU/kg, r2 = 0.55, p<0.001.
Soybean meal exponential model did not intercept with the plateau of broken-line model.
The phytase concentration (FTU/kg) needed to maximize the STTD of P in the tested feed ingredients determined by the best regression model (Table 4) is shown in Figures 1 to 6 for CM, corn, RB, SBM, SFM, and wheat. When determined by broken line analysis, the estimated minimum phytase dose (FTU/kg) needed to plateau STTD of P was, respectively, 454 for 65.2% in CM, 550 for 69.4 in corn, 194 for 58.9% in SBM, 785 for 58.9% in SFM, and 603 for 65.3% in wheat. The break-point for RB, sorghum, and DDGS was determined to be 2,000 FTU/kg indicating that a plateau was not obtained. The quadratic regressions indicate that the phytase dose (FTU/kg) needed for highest STTD of P was, respectively, 1,494 for 71.6% in CM, 1,547 for 74.5% corn, 732 for 65.4% in DDGS, 1,968 for 73.2% in sorghum, 1,153 for 63.8% in SBM, 1,530 for 62.7% in SFM, and 1,565 for 67.6% in wheat; estimates for RB were outside the studied range. Using an exponential model, the calculated phytase dose (FTU/kg) needed for highest STTD of P defined as 95% of the upper asymptote [18] was, respectively, 735 for 64.3% in CM, 1,112 for 70.0% in corn, 160 for 55.5% in SBM, 1,219 for 57.8% in SFM, and 881 for 64.0% in wheat; estimates for DDGS, sorghum, and RB were outside the evaluated range indicating the enzyme follows a fairly linear response within the range studied for these three ingredients.
Figure 1.
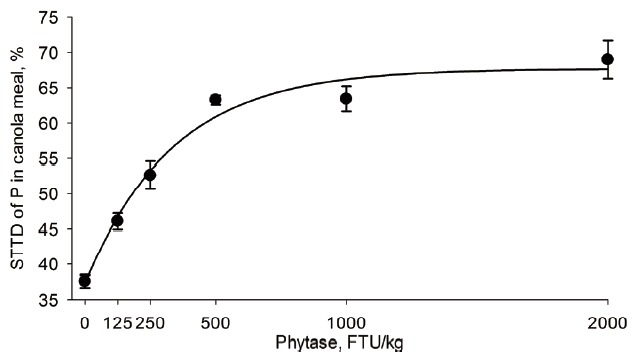
Fitted exponential model of standardized total tract digestibility (STTD) of P in canola meal as a function of concentration of exogenous phytase in the diet. Treatment means (●) and standard error are shown. STTD of P = 37.2309+30.4873×[1−exp(−0.003 ×phytase dose in FTU/kg)], r2 = 0.98, p<0.001. The concentration of phytase needed to maximize (i.e., to obtain 95% of the upper asymptote) the STTD of P at 64.3% was calculated to be 735 FTU/kg. FTU, phytase units.
Figure 6.
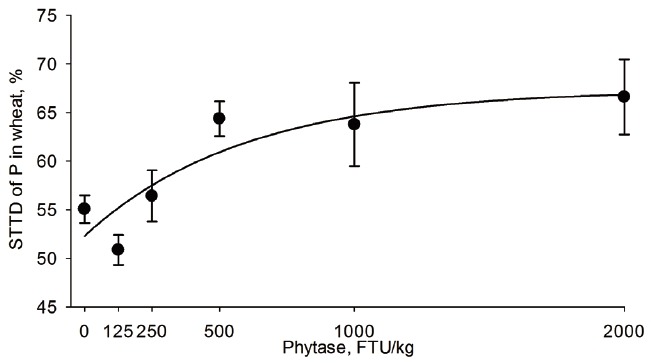
Fitted exponential model of standardized total tract digestibility (STTD) of P in wheat as a function of concentration of exogenous phytase in the diet. Treatment means (●) and standard error are shown. STTD of P = 52.2951+15.0552×[1−exp(−0.0017 ×phytase dose in FTU/kg)], r2 = 0.80, p<0.001. The concentration of phytase needed to maximize (i.e., to obtain 95% of the upper asymptote) the STTD of P at 64.0% was calculated to be 881 FTU/kg. FTU, phytase units.
The broken-line analysis has been used elsewhere to determine the phytase concentration needed to maximize the STTD of P in complete diets [9]. To the best of our knowledge, this approach has not been used for individual feed ingredients in pigs or other species. Under other scenarios (e.g., determination of AA requirements) the robustness of estimates based on broken line analysis has been questioned, as this analysis tends to underestimate the requirement for a significant portion of the population [22,23]. The reason for this is because the broken line regression estimates the breakpoint at an average for the test population [24]. Conversely, the quadratic model is believed to overestimate the requirement for the majority of the sample population [24]. It has been previously reported that linear and nonlinear models (e.g., exponential) used to determine nutrient requirements using growth data results in similar estimates when adequate fits are obtained for both models [25]. Nonetheless, the better goodness of fit of the exponential model makes it a better approach to describe and interpret the data [25]. These concerns are obvious in the present study, in which there are differences among the phytase dose (FTU/kg) needed to maximize the STTD of P using different approaches (e.g., 550 for broken line, 1,547 for quadratic, and 1,125 for exponential in corn). However, for other ingredients like SBM the estimated phytase dose (FTU/kg) needed to maximize the STTD of P is similar between broken-line and exponential models (194 vs 160, respectively). Thus, to mitigate some of the shortcomings of models when estimating the optimum concentration for a given response criterion, a combination of model approach has been proposed [22,23]. In these analyses, the requirement for a given response variable is defined as the first intercept of the quadratic or exponential regression with the plateau of the broken-line. The first intercept between the plateau of the broken line with the quadratic and exponential models is commonly used as conciliatory values among models and those estimates are presented in Table 5. It should be noted again that the quadratic model had the highest BIC score for all ingredients indicating the poorest goodness of fit for this regression approach. Thus, the applicability of the intercept of the plateau of the broken-line model with the quadratic model could be debatable. Although the aforementioned approaches serve to indicate the maximum STTD of P achieved in each feed ingredient by phytase supplementation and also illustrate the fact that phytase efficacy differs among different feed ingredients with a given phytase dose, the application of such information in commercial diets is cumbersome. In practical formulation, nutritionists use a given dose of phytase, which as demonstrated here, may not necessarily maximize the STTD of P in all ingredients used in the complete feed. Nevertheless, the regression models developed here may be used to predict the amount of STTD P released by this novel phytase for any complete feed where the ingredients tested here are used. Each ingredient, however, will have a different equation which in some cases could be better described by broken-line, linear, or exponential models according to the lowest BIC values among models (Table 5).
The results from this study indicate that the efficiency of phytase in improving the STTD of P varies among feed ingredients and this might be attributed, in part, to composition, level, and location of phytate within different plant-based feed ingredients [5]. Most of the phytate in corn is located within the germ, whereas in wheat and sorghum phytate is mainly found within the aleurone layers [26,27]. Thus, it is possible that phytate in corn is more easily accessible to exogenous phytases than phytate located within the fibrous matrix of wheat and sorghum. In fact, it was determined that IP6 ileal digestibility in broilers was greater in corn-based diets (51.5%) than in wheat and sorghum-based diets (49.9% and 34.0%, respectively; [28]). In another study with broilers, P released from IP6 with 100 FTU/kg of exogenous phytase in corn was 4.66% compared with 2.69% in wheat [29]. These reports are in agreement with present results, the estimated dose of phytase (FTU/kg) needed to maximize the STTD of P was 550 for corn, 881 for wheat, and the estimated value for sorghum was greater than the maximum tested dose of 2,000 FTU/kg of phytase.
In non cereal seeds such as soybean, canola, and sunflower, most of phytate is present within the protein matrix, but in the case of SBM, phytate is homogenously distributed within the seed, whereas in other oilseeds it accumulates in specific sites [30]. Thus, as determined in this study, it is possible that different responses measured for each oilseed could have been a result of the different interactions between phytate and other nutrients (e.g., protein) in each ingredient [30].
Because phytase supplementation increases the STTD of P differently depending on the feed ingredient, it seems logical that the response to phytase supplementation also varies depending on diet composition. Three plausible diets were formulated and corroborate with this hypothesis (Figure 7). For example, the basal STTD P for plausible Diet A was calculated to be 0.166% and adding 500 FTU/kg of the novel phytase evaluated in this study should increase STTD P to 0.287% (Table 6), meaning that the STTD P value for this phytase in this diet will be 0.12%. Similar calculations for diet B and diet C indicate a STTD P value of 0.091% and 0.086%, respectively. The STTD P value of the enzyme was higher in complex diets that contained SFM and CM than in the simpler corn-SBM diet. Interestingly, in the diets that contained RB, the predicted improvements in STTD P value continue to increase with dose, whereas the other diets did reach a plateau at 750 and 1,000 FTU/kg of phytase providing a maximum of 0.145% and 0.091% STTD P in diet A and diet B, respectively. The implication of our findings and this simulation is that nutritionists should refrain from using a fixed P matrix value indiscriminately as the value of any given phytase will likely depend on the selection of ingredients and their inclusion concentrations within a diet.
Figure 7.
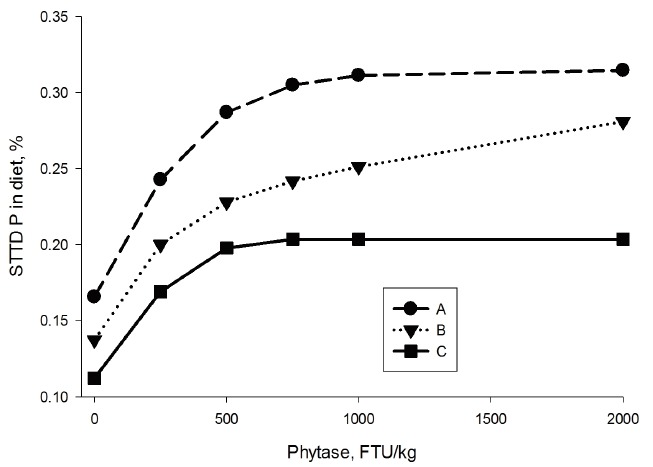
Effect of phytase dose on standardized total tract digestible (STTD) P content in three hypothetical diets fed to 25-kg pigs. Refer to Table 6 for the ingredient and nutrient composition of these hypothetical diets. FTU, phytase units.
In conclusion, our results demonstrate the effectiveness of this novel microbial 6-phytase expressed in Psedomonas fluorescens to improve the STTD of P in various feed ingredients commonly used in swine diets. The efficiency of this novel enzyme to hydrolyze phytate is best described with a broken-line model for corn, an exponential model for CM, SBM, SFM, and wheat, and a linear model for DDGS, RB, and sorghum for the phytase evaluated in the present study within the range of 0 to 2,000 FTU/kg. The concentration of phytase needed to maximize the STTD of P varied for different feed ingredients and this needs to be taken into consideration when determining the matrix values for phytases, depending on the type of ingredients used when mixing complete diets for pigs.
Figure 2.
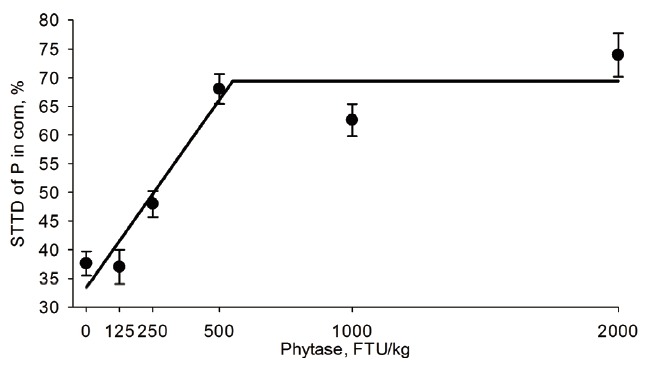
Fitted broken-line model of standardized total tract digestibility (STTD) of P in corn as a function of concentration of exogenous phytase in the diet. Treatment means (●) and standard error are shown. It was calculated that a minimum of 550 FTU/kg of phytase was needed to obtain a STTD of P at a plateau of 69.4%. The linear equation before the break point was STTD of P = 33.4+0.0654×phytase dose in FTU/kg, r2 = 0.95, p<0.001. FTU, phytase units.
Figure 3.
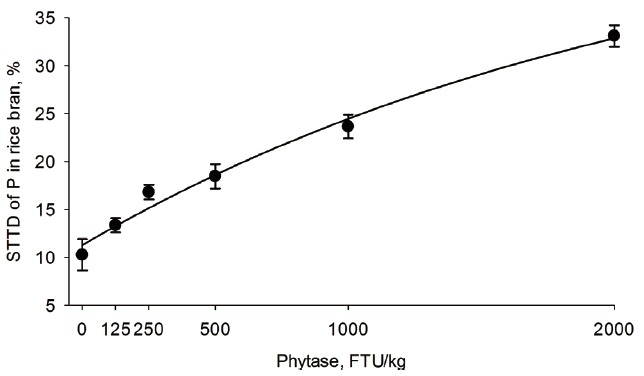
Fitted exponential model of standardized total tract digestibility (STTD) of P in rice bran as a function of concentration of exogenous phytase in the diet. Treatment means (●) and standard error are shown. STTD of P = 11.5406+38.4744×[1−exp (−0.0004×phytase dose in FTU/kg)], r2 = 0.99, p<0.001. The concentration of phytase needed to maximize (i.e., to obtain 95% of the upper asymptote) the STTD of P was estimated to be outside the studied range. FTU, phytase units.
Figure 4.
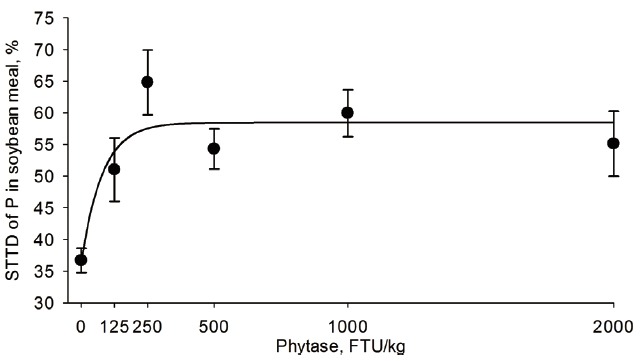
Fitted exponential model of standardized total tract digestibility (STTD) of P in soybean meal as a function of concentration of exogenous phytase in the diet. Treatment means (●) and standard error are shown. STTD of P =36.3283+22.1438×[1−exp(−0.0126 ×phytase dose in FTU/kg)], r2 = 0.80, p<0.001. The concentration of phytase needed to maximize (i.e., to obtain 95% of the upper asymptote) the STTD of P at 55.5% was calculated to be 160 FTU/kg. FTU, phytase units.
Figure 5.
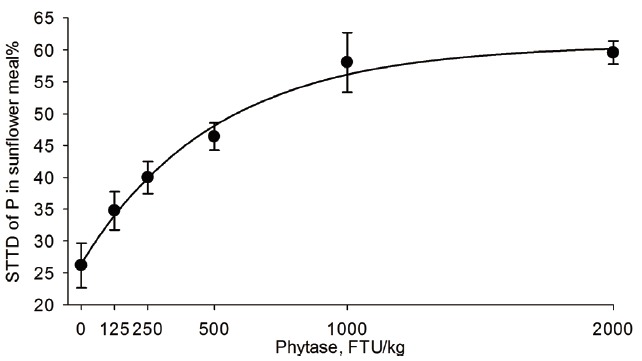
Fitted exponential model of standardized total tract digestibility (STTD) of P in sunflower meal as a function of concentration of exogenous phytase in the diet. Treatment means (●) and standard error are shown. STTD of P =26.441+34.3873×[1−exp(−0.002 ×phytase dose in FTU/kg)], r2 = 0.99, p<0.001. The concentration of phytase needed to maximize (i.e., to obtain 95% of the upper asymptote) the STTD of P at 57.8% was calculated to be 1,219 FTU/kg. FTU, phytase units.
Footnotes
CONFLICT OF INTEREST
We certify that there is no conflict of interest with any financial organization regarding the material discussed in the manuscript.
REFERENCES
- 1.Raboy V. myo-Inositol-1,2,3,4,5,6-hexakisphosphate. Phytochemistry. 2003;64:1033–43. doi: 10.1016/s0031-9422(03)00446-1. [DOI] [PubMed] [Google Scholar]
- 2.Loewus FA, Murthy PPN. myo-Inositol metabolism in plants. Plant Sci. 2000;150:1–19. [Google Scholar]
- 3.NRC. Nutrient requirements of swine: Eleventh revised edition. 11 ed. Washington, DC: National Academies Press; 2012. [Google Scholar]
- 4.Almeida FN, Stein HH. Performance and phosphorus balance of pigs fed diets formulated on the basis of values for standardized total tract digestibility of phosphorus. J Anim Sci. 2010;88:2968–77. doi: 10.2527/jas.2009-2285. [DOI] [PubMed] [Google Scholar]
- 5.Dersjant-Li Y, Awati A, Schulze H, Partridge G. Phytase in non-ruminant animal nutrition: a critical review on phytase activities in the gastrointestinal tract and influencing factors. J Sci Food Agric. 2015;95:878–96. doi: 10.1002/jsfa.6998. [DOI] [PMC free article] [PubMed] [Google Scholar]
- 6.Akinmusire AS, Adeola O. True digestibility of phosphorus in canola and soybean meals for growing pigs: Influence of microbial phytase. J Anim Sci. 2009;87:977–83. doi: 10.2527/jas.2007-0778. [DOI] [PubMed] [Google Scholar]
- 7.Rojas OJ, Stein HH. Digestibility of phosphorus by growing pigs of fermented and conventional soybean meal without and with microbial phytase. J Anim Sci. 2012;90:1506–12. doi: 10.2527/jas.2011-4103. [DOI] [PubMed] [Google Scholar]
- 8.Augspurger NR, Webel DM, Lei XG, Baker DH. Efficacy of an E. coli phytase expressed in yeast for releasing phytate-bound phosphorus in young chicks and pigs. J Anim Sci. 2003;81:474–83. doi: 10.2527/2003.812474x. [DOI] [PubMed] [Google Scholar]
- 9.Almeida FN, Sulabo RC, Stein HH. Effects of a novel bacterial phytase expressed in Aspergillus Oryzae on digestibility of calcium and phosphorus in diets fed to weanling or growing pigs. J Anim Sci Biotechnol. 2013;4:8. doi: 10.1186/2049-1891-4-8. [DOI] [PMC free article] [PubMed] [Google Scholar]
- 10.FASS. Guide for the care and use of agricultural animals in research and teaching. 3 ed. Champaign, IL: Federation of Animal Science Societies; 2010. [Google Scholar]
- 11.Almeida FN, Stein HH. Effects of graded levels of microbial phytase on the standardized total tract digestibility of phosphorus in corn and corn coproducts fed to pigs. J Anim Sci. 2012;90:1262–9. doi: 10.2527/jas.2011-4144. [DOI] [PubMed] [Google Scholar]
- 12.Birkett S, de Lange K. Calibration of a nutrient flow model of energy utilization by growing pigs. Br J Nutr. 2001;86:675–89. doi: 10.1079/bjn2001443. [DOI] [PubMed] [Google Scholar]
- 13.AOAC. Official methods of analysis. Gaithersburg, MD: Association of Official Analytical Chemists; 2007. [Google Scholar]
- 14.International Organization for Standardization (ISO) Animal feeding stuffs: determination of phytase activity. International Organization for Standardization; 2009. [Google Scholar]
- 15.Short FJ, Gorton P, Wiseman J, Boorman KN. Determination of titanium dioxide added as an inert marker in chicken digestibility studies. Anim Feed Sci Technol. 1996;59:215–21. [Google Scholar]
- 16.Stein HH, Sève B, Fuller MF, Moughan PJ, de Lange CFM. Invited review: Amino acid bioavailability and digestibility in pig feed ingredients: terminology and application. J Anim Sci. 2007;85:172–80. doi: 10.2527/jas.2005-742. [DOI] [PubMed] [Google Scholar]
- 17.Stein HH. Standardized total tract digestibility (STTD) of phosphorus; Indianapolis, IN. Midwest Swine Nutrition Conference; 2011. pp. 47–52. [Google Scholar]
- 18.Robbins KR, Saxton AM, Southern LL. Estimation of nutrient requirements using broken-line regression analysis. J Anim Sci. 2006;84:E155–E65. doi: 10.2527/2006.8413_supple155x. [DOI] [PubMed] [Google Scholar]
- 19.Schwarz G. Estimating the dimension of a model. Ann Stat. 1978;2:461–4. [Google Scholar]
- 20.Lei XG, Stahl CH. Biotechnological development of effective phytases for mineral nutrition and environmental protection. Appl Microbiol Biotechnol. 2001;57:474–81. doi: 10.1007/s002530100795. [DOI] [PubMed] [Google Scholar]
- 21.de Blas Beorlegui C, Mateos GG, Rebollar PG Animal FEpeDdlN. FEDNA tables of composition and nutritional value of ingredients for feed manufacturing. 2003. [Google Scholar]
- 22.Baker DH, Batal AB, Parr TM, Augspurger NR, Parsons CM. Ideal ratio (relative to lysine) of tryptophan, threonine, isoleucine, and valine for chicks during the second and third weeks posthatch. Poult Sci. 2002;81:485–94. doi: 10.1093/ps/81.4.485. [DOI] [PubMed] [Google Scholar]
- 23.Parr TM, Kerr BJ, Baker DH. Isoleucine requirement of growing (25 to 45 kg) pigs1. J Anim Sci. 2003;81:745–52. doi: 10.2527/2003.813745x. [DOI] [PubMed] [Google Scholar]
- 24.Mathai J. Effects of fiber on the optimum threonine:lysine ratio for 25 to 50 kg growing gilts [Thesis] Champaign, IL: University of Illinois; 2015. [Google Scholar]
- 25.Robbins KR, Norton HW, Baker DH. Estimation of nutrient requirements from growth data. J Nutr. 1979;109:1710–4. doi: 10.1093/jn/109.10.1710. [DOI] [PubMed] [Google Scholar]
- 26.Doherty C, Faubion JM, Rooney LW. Semiautomated determination of phytate in sorghum and sorghum products. Cereal Chem. 1982;59:373–7. [Google Scholar]
- 27.O’Dell BL, De Boland AR, Koirtyohann SR. Distribution of phytate and nutritionally important elements among the morphological components of cereal grains. J Agr Food Chem. 1972;20:718–23. [Google Scholar]
- 28.Truong HH, Yu S, Peron A, et al. Phytase supplementation of maize-, sorghum- and wheat-based broiler diets with identified starch pasting properties influences phytate (IP6) and sodium jejunal and ileal digestibility. Anim Feed Sci Technol. 2014;198:248–56. [Google Scholar]
- 29.Leske K, Coon C. A bioassay to determine the effect of phytase on phytate phosphorus hydrolysis and total phosphorus retention of feed ingredients as determined with broilers and laying hens. Poult Sci. 1999;78:1151–7. doi: 10.1093/ps/78.8.1151. [DOI] [PubMed] [Google Scholar]
- 30.Adeola O, Sands JS. Does supplemental dietary microbial phytase improve amino acid utilization? A perspective that it does not. J Anim Sci. 2003;81:E78–E85. [Google Scholar]


