Abstract
Hepatocellular carcinoma (HCC) treatment remains lack of effective chemopreventive agents, therefore it is very attractive and urgent to discover novel anti-HCC drugs. In the present study, the effects of chlorogenic acid (ChA) and caffeic acid (CaA) on HCC induced by diethylnitrosamine (DEN) were evaluated. ChA or CaA could reduce the histopathological changes and liver injury markers, such as alanine transarninase, aspartate aminotransferase, alkaline phosphatase, total bile acid, total cholesterol, high density lipoprotein cholesterol and low density lipoprotein cholesterol. The underlying mechanisms were investigated by a data integration strategy based on correlation analyses of metabonomics data and 16 S rRNA gene sequencing data. ChA or CaA could inhibit the increase of Rumincoccaceae UCG-004 and reduction of Lachnospiraceae incertae sedis, and Prevotella 9 in HCC rats. The principal component analysis and partial least squares discriminant analysis were applied to reveal the metabolic differences among these groups. 28 different metabolites showed a trend to return to normal in both CaA and ChA treatment. Among them, Bilirubin, L-Tyrosine, L-Methionine and Ethanolamine were correlated increased Rumincoccaceae UCG-004 and decreased of Lachnospiraceae incertae sedis and Prevotella 9. These correlations could be identified as metabolic and microbial signatures of HCC onset and potential therapeutic targets.
Introduction
Hepatocellular carcinoma (HCC) is a global problem and the second most common cause of cancer related deaths in the world1, 2. Primary prevention of HCC can be achieved with universal vaccination against Hepatitis B virus (HBV) infection3. Owing to their characteristics of high chemical diversity and biochemical specificity, a broad spectrum of phytochemicals including flavonoids, alkaloids and polyphenols, has been isolated and investigated for anti-HBV activities4. Chlorogenic acid (ChA) and caffeic acid (CaA) are abundant polyphenol compounds in the human diet5, 6. CaA is a hydrlysed metabolite of ChA by mucosal and/or microbial esterase in the intestinal tract7. Our previous study had revealed they could protect against polychlorinated biphenyls or tetrachloride-induced hepatotoxicity8. In addition, tea polyphenols provided an effective and promising alternative for the chemoprevention and treatment of HCC9. Tea polyphenols epigallocatechin gallete and the aflavin could restrict mouse liver carcinogenesis through modulation of self-renewal Wnt and hedgehog pathways10. However, the role of ChA or CaA in prevention of HCC is still unclear. And elucidating the underlying mechanisms is crucial for the development of effective strategies to prevent HCC.
The gut and liver are key organs in nutrient absorption and metabolism. The unique immunological environment in the liver has been attributed to its close connection to the gut. The portal vein delivers gut-derived products, such as lipopolysaccharide (LPS), bacterial DNA and peptidoglycan, to the liver. The commensal microbiota plays a beneficial role in maintaining liver homeostasis and preventing liver fibrosis11. Imbalance of the gut microbiota is associated with hepatic diseases, such as lipid accumulation, stellate cell activation, immune cell recruitment12. Growing evidence indicated that gut microbiota was involved in initiation, progression and therapy of HCC13, 14. Our previous study had shown that CaA could restore the reduction of richness of fecal microbiota in experimental colitis15. The effects of CaA or ChA on composition of gut microbiota associated with HCC remain unclear.
Metabolomics is a rapidly evolving technology for identifying novel biomarkers by assessing large numbers of metabolites that are substrates and products in metabolic pathways. In addition, it is also a new avenue for understanding of cellular and organism specific responses to environment, chemicals and drugs perturbations16. The metabolic features of HCC included elevated glycolysis, gluconeogenesis, and β-oxidation with reduced tricarboxylic acid cycle17. Identification of metabolites may highlight how CaA or ChA affect HCC. As well known, gut microbiota is exclusively responsible for several metabolic important functions, such as short chain fatty acid production, bile acid biotansformation, hydrolysis and fermentation of non-digestible substrates18. Indeed, the metabolomics approach has been applied to several studies on the gut microbiota, mostly focused on the exploration of disease-related metabolites in order to obtain detailed information on the gut metabolic pathways19. In the present study, the effects of CaA and ChA on HCC induced by diethylnitrosamine (DEN) were evaluated. The functional relationships between metabolites and gut microbial composition was investigated by a data integration strategy based on correlation analyses of serum metabonomics data and 16 S rRNA gene sequencing data.
Results
Body weight and Histopathological observations
A schematic diagram of the experimental study design was shown in Fig. 1. Compared with the control group, the body weight of DEN group significantly decreased (Fig. 2A). Moreover, DEN treatment significantly increased the relative liver weight. Co-treatment with DEN and CaA or ChA could inhibit the decrease of body weight and the increase of the relative liver weight (Fig. 2B). The liver section from control group showed normal architecture and hepatic cells with granulated cytoplasm, small uniform nuclei and nucleolus (Fig. 2C). HCC group showed loss of architecture and neoplastic cells arranged in lobules. Neoplastic cells were larger than normal cells with granular cytoplasm and larger hyperchromatic nuclei and hyaline globules. CaA or ChA treated group showed nearly normal architecture only with few malignant hepatocytes.
Figure 1.
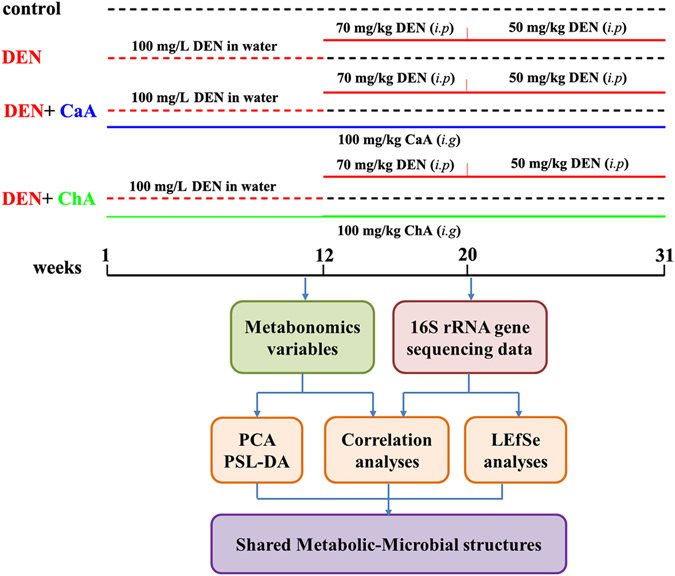
Overview of the experimental design and the analytical strategy.
Figure 2.
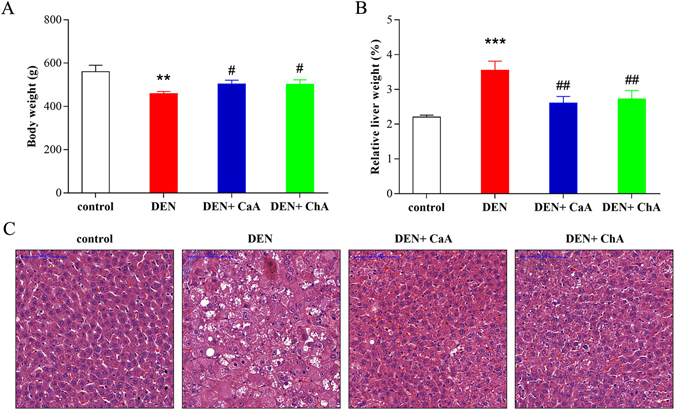
CaA and ChA improved DEN induced HCC in rats. (A) Body weight, relative and (B) relative liver weight were expressed as mean ± SD of 6 rats in each group. **P < 0.01, ***P < 0.001 compared with control group; # P < 0.05, ## P < 0.01 compared with DEN group. (C) Representative images of the liver tissues from control, DEN, DEN + CaA and DEN + ChA group. Formalin fixed, paraffin-embedded 5 μm cross-sections were stained with H&E. Scale bar: 100 μm.
Biochemical analyses
The serum biochemical parameters basically supported the results obtained from histopathological examinations. There was a significant elevation in serum levels of ALT (Fig. 3A), AST (Fig. 3B), ALP (Fig. 3C), TBA (Fig. 3D), CHOL (Fig. 3E), HDL (Fig. 3G) and LDL (Fig. 3H) and in the DEN group in contrast to the control group. Co-treatment with DEN and CaA or ChA significantly decreased serum levels of ALT, AST, ALP, TBA, CHOL, HDL and LDL. However, no significant changes of the LPS levels in serum or liver were observed in DEN groups (Fig. S1).
Figure 3.
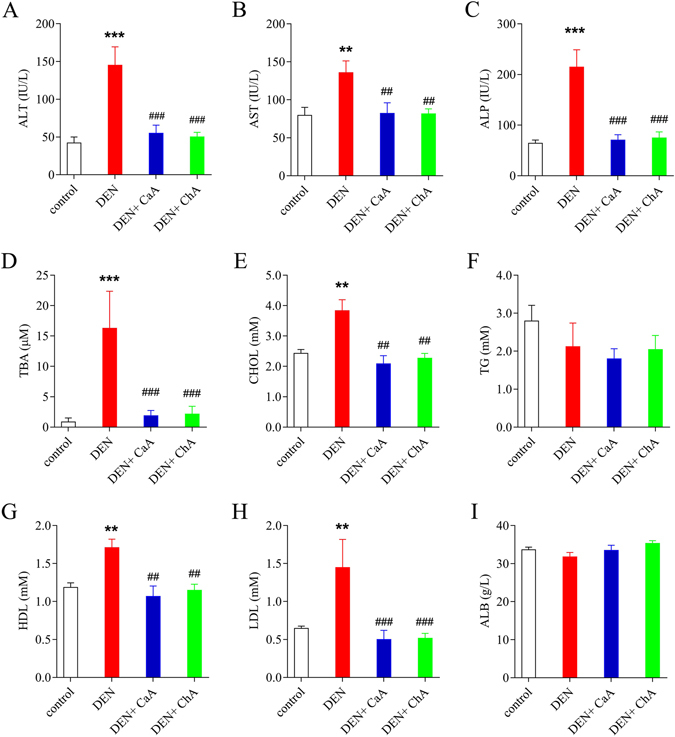
The effects of CaA and ChA on serum biochemical parameters in HCC induced by DEN. (A) alanine transarninase (ALT), (B) aspartate aminotransferase (AST), (C) alkaline phosphatase (ALP), (D) total bile acid (TBA), (E) total cholesterol (TC), (F) triglycerides (TG), (G) high density lipoprotein cholesterol (HDL), (H) low density lipoprotein cholesterol (LDL) and (I) albumin (ALB) were assessed. Data were expressed as mean ± SD of 6 rats in each group. **P < 0.01, ***P < 0.001 compared with control group; ## P < 0.01, ### P < 0.001 compared with DEN group.
Effects of CaA or ChA on fecal microbiota in DEN-treated rats
Compared with the control group, no significant changes of the richness or diversity of fecal microbiota were observed in DEN, CaA or ChA group (Fig. S1). To identify the specific bacterial taxa associated with HCC, we compared the fecal microbiota among these groups using LEfSe (Fig. 4A). The greatest differences in taxa among the four communities are displayed, and several genera could be used as distinguishing biomarkers (Fig. 4B). The changes in the fecal microbiota among these four groups were explored using the Mann-Whitney U test. Lachnospiraceae incertae sedis (Fig. 5A), Prevotella 9 (Fig. 5C) and Prevotellaceae (Fig. 5D) were significantly less abundant in the fecal microbiota of DEN group compared the control group, while Rumincoccaceae UCG-004 (Fig. 5B) was significantly more abundant in the fecal microbiota of DEN group. CaA or ChA treatment could significantly reverse these effects. The ROC curves indicated that Lachnospiraceae incertae sedis (Fig. 5E), Rumincoccaceae UCG-004 (Fig. 5F) or Prevotella 9 (Fig. 5G) could be used as a microbial signature for the differential diagnosis of HCC.
Figure 4.
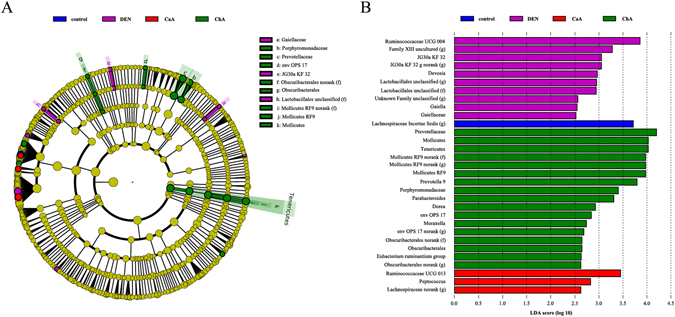
Discriminative taxa of fecal microbiota among control, DEN, DEN + CaA and DEN + ChA group. (A) Cladogram representing the features that are discriminative among these groups using the LDA model results on the bacterial hierarchy. Significantly discriminant taxon nodes are colored and branch areas are shaded according to the highest-ranked variety for that taxon. For each taxon detected, the corresponding node in the taxonomic cladogram is colored according to the highest-ranked group for that taxon. If the taxon does not show significantly differential representation between sample groups, the corresponding node is colored yellow. (B) LDA coupled with effect size measurements identifies the most differentially abundant taxons among these groups.
Figure 5.
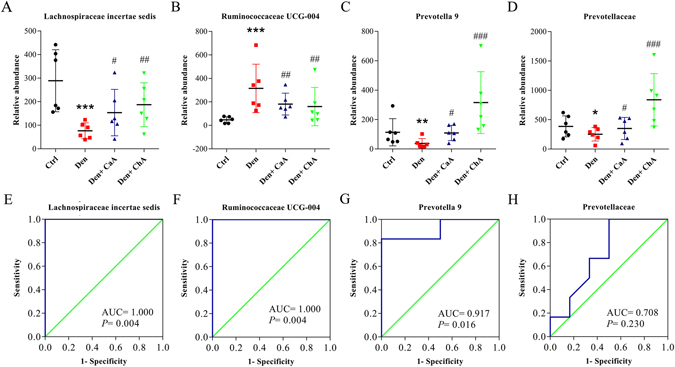
Taxonomic differences of fecal microbiota among control, DEN, DEN + CaA and DEN + ChA group. Comparsion of relative of (A) Lachnospiraceae incertae sedis, (B) Rumincoccaceae UCG-004, (C) Prevotella 9 and (D) Prevotellaceae among these groups. The statistical difference was analyzed by Mann-Whitney U test. *P < 0.05, **P < 0.01, ***P < 0.001 compared with control group; # P < 0.05, ## P < 0.01, ### P < 0.001, compared with DEN group. Receiver operating characteristic (ROC) curves for (E) Lachnospiraceae incertae sedis, (F) Rumincoccaceae UCG-004, (G) Prevotella 9 and (H) Prevotellaceae were used to predict HCC.
Metabolic profiles and correlation analysis between the metabolite and microbiota
The score plot showed a relative good separation between DEN group and other three groups which preliminarily indicated the different metabolic pattern between groups (Fig. 6A,C). The score plots of PLS-DA model also showed a clearly discrimination between DEN group and other three groups (Fig. 6B,D). The cluster of CaA or ChA group was apparently moving towards to that of control group which was consistent with histopathological and biochemical observations, suggesting they could improve HCC. The VIP and t test analyses identified 72 metabolites that were significantly different between controls and DEN groups (Table. S1). There were 41 and 37 significantly different metabolites turned out a trend to return to normal after CaA and ChA treatment, respectively. Among them, 28 metabolites were significantly different in both CaA and ChA groups compared with the DEN groups (Table 1). They could be the biomarkers to evaluate the effects of CaA or ChA from the perspective of metabolomics. Furthermore, the correlation between these 28 metabolites and Prevotella 9, Lachnospiraceae incertae sedis or Rumincoccaceae UCG-004 were investigated. 17 metabolites were correlated with at least one of them in both CaA and ChA groups (Fig. 7). Bilirubin, L-Tyrosine, L-Methionine and Ethanolamine were correlated with all these three bacteria.
Figure 6.
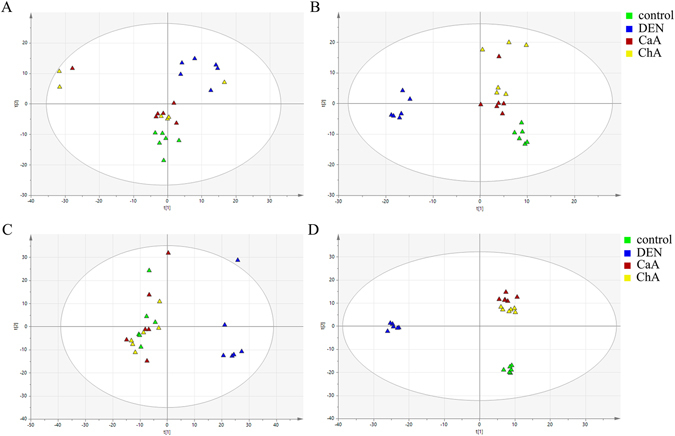
PCA and PSL-DA score scatter plots show metabolic pattern among control, DEN, DEN + CaA and DEN + ChA group. (A) PCA and (B) PLS-DA score plot conducted by GC-MS data (R2Y = 0.952, Q2 = 0.411). (C) PCA and (D) PLS-DA score plot conducted by HPLC-MS data (R2Y = 0.995, Q2 = 0.443).
Table 1.
List of candidate biomarkers for HCC and evaluating the effects of CaA and ChA.
| Metabolites | m/z | VIP score | DEN vs control | CaA vs DEN | ChA vs DEN | Corresponding metabolic pathway | |||
|---|---|---|---|---|---|---|---|---|---|
| fold | p | fold | p | fold | p | ||||
| Glycerophosphocholine | 257.1028 | 2.28 | 1.35 | 0.024 | 1.47 | 0.003 | 1.29 | 0.015 | Glycerophospholipid metabolism |
| Bilirubin | 584.2635 | 2.18 | 8.32 | <0.001 | 0.44 | <0.001 | 0.39 | <0.001 | Porphyrin and chlorophyll metabolism |
| L-Tyrosine | 181.0739 | 2.16 | 1.65 | <0.001 | 0.62 | <0.001 | 0.59 | <0.001 | Phenylalanine, tyrosine and tryptophan biosynthesis, Phenylalanine metabolism |
| Xylitol | 307 | 2.01 | 8.26 | <0.001 | 0.42 | <0.001 | 0.46 | <0.001 | Pentose and glucuronate interconversions |
| Isopropyl-beta-D-thiogalactopyranoside | 361 | 1.90 | 0.71 | <0.001 | 1.33 | <0.001 | 1.37 | <0.001 | Carbohydrate Metabolism |
| D-Glucopyranuronic acid | 292 | 1.90 | 4.32 | <0.001 | 0.44 | <0.001 | 0.39 | <0.001 | |
| Tetradecanoic acid | 285 | 1.87 | 1.86 | <0.001 | 0.65 | <0.001 | 0.71 | 0.005 | energy metabolism |
| Cholic acid | 408.2876 | 1.86 | 9.28 | 0.002 | 0.21 | 0.001 | 0.22 | 0.001 | Primary bile acid biosynthesis |
| Phosphoric acid | 299 | 1.84 | 0.36 | <0.001 | 2.59 | <0.001 | 2.24 | <0.001 | phospholipid metabolism |
| Propanoic acid | 174 | 1.82 | 0.66 | <0.001 | 1.19 | 0.003 | 1.23 | 0.002 | intestinal flora metabolism |
| L-Methionine | 176 | 1.81 | 1.22 | <0.001 | 0.84 | <0.001 | 0.85 | <0.001 | Aminoacyl-tRNA biosynthesis |
| L-Valine | 117.079 | 1.80 | 1.51 | 0.001 | 0.69 | 0.001 | 0.68 | 0.001 | Valine, leucine and isoleucine biosynthesis |
| Ethanolamine | 174 | 1.80 | 1.34 | <0.001 | 0.76 | <0.001 | 0.79 | 0.001 | Glycerophospholipid metabolism |
| L-Histidine | 155.0695 | 1.76 | 1.17 | 0.021 | 0.88 | 0.035 | 0.79 | 0.001 | Aminoacyl-tRNA biosynthesis |
| 2-Phenylacetamide | 135.0684 | 1.74 | 1.42 | <0.001 | 0.75 | 0.001 | 0.72 | <0.001 | Phenylalanine metabolism |
| D-Mannose | 387 | 1.55 | 0.38 | 0.003 | 2.07 | 0.002 | 2.31 | 0.005 | Galactose metabolism |
| Campesterol | 382 | 1.47 | 0.33 | 0.006 | 2.07 | 0.001 | 2.74 | <0.001 | Biosynthesis of terpenoids and steroids |
| Pentanoic acid | 200 | 1.46 | 0.68 | 0.007 | 1.48 | 0.004 | 1.39 | 0.017 | intestinal flora metabolism |
| Glutamic acid | 246 | 1.42 | 1.26 | 0.009 | 0.72 | 0.001 | 0.84 | 0.015 | Tyrosine metabolism |
| d-Fructose | 315 | 1.41 | 0.42 | 0.015 | 1.85 | 0.011 | 2.08 | 0.036 | Fructose and mannose metabolism |
| Serine | 204 | 1.40 | 1.20 | 0.011 | 0.80 | 0.001 | 0.83 | 0.006 | Glycine, serine and threonine metabolism, Methane metabolism |
| Pentanedioic acid | 198 | 1.38 | 1.57 | 0.012 | 0.56 | 0.002 | 0.63 | 0.003 | amino acid metabolism |
| Butanedioic acid | 233 | 1.38 | 1.33 | 0.013 | 0.60 | <0.001 | 0.69 | <0.001 | Citrate cycle (TCA cycle) |
| Indoleacrylic acid | 187.0633 | 1.35 | 0.89 | 0.002 | 1.13 | 0.005 | 1.16 | 0.013 | Tryptophan metabolism |
| cis-9-Hexadecenoic acid | 311 | 1.31 | 1.44 | 0.019 | 0.63 | 0.001 | 0.72 | 0.010 | fatty acid metabolism |
| meso-Erythritol | 217 | 1.26 | 1.17 | 0.026 | 0.83 | 0.001 | 0.78 | <0.001 | |
| Maltose | 361 | 1.24 | 0.44 | 0.029 | 1.40 | 0.002 | 1.47 | 0.032 | Carbohydrate digestion and absorption |
| L-Tryptophan | 204.0899 | 1.23 | 0.89 | 0.009 | 1.11 | 0.005 | 1.13 | 0.033 | Tryptophan metabolism, Aminoacyl-tRNA biosynthesis |
Figure 7.
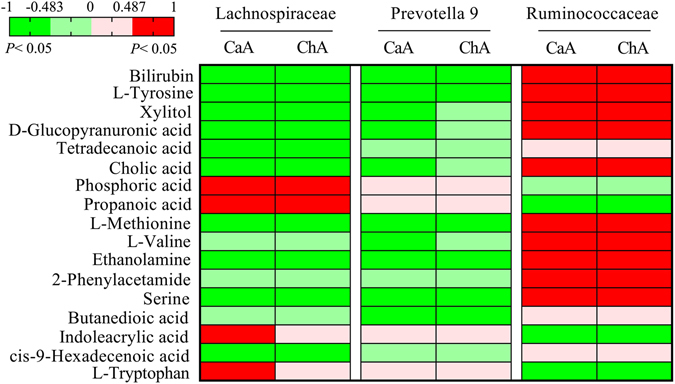
Heatmap with color gradients related to correlation coefficient between the variables. A red cell represents a significant correlation between the corresponding metabolite and microbiota component; green represents a significant anticorrelation between the variables; and other cells indicated no significant correlation. The correlation coefficients were assessed in CaA (control, DEN and DEN + CaA) and ChA (control, DEN and DEN + ChA) group, respectively.
Discussion
Hepatocellular carcinoma (HCC) is a common malignancy worldwide, with ~600,000 newly diagnosed cases, and leading to > 250,000 mortalities annually1, 20. DEN is a potent hepatocarcinogenic nitrosamine that could induce lesion as well as tumors in rodents with marked biochemical, histological and molecular similarity to the progression of HCC in humans21, 22. Although, no chemotherapy agent has better benefit than surgery due to different reasons, including drug resistance and toxicity to normal cells23. The development of innovative novel therapeutics for the management of HCC is particularly urgent. Accumulating evidence has demonstrated that CaA and ChA possessed various pharmacological effects, such as antioxidative, antiviral, antitumor, and anti-inflammatory activities24–26. The aim of this study was to evaluate the effects of CaA and ChA on HCC induced by DEN. To the best of our knowledge, this is the first study using an integrated metabonomics and 16 S rRNA gene sequencing data to investigate gut microbiota signatures of HCC onset and potential therapeutic targets for CaA and ChA.
Accumulative evidence indicated that intestinal microbiota played important role in the pathogenesis of HCC. Previous study had shown significant structural alterations in gut microbiota during the development of HCC, and Atopobium spp., Bacteroides spp., Bacteroides vulgatus, Bacteroides acidifaciens, Bacteroides uniformis, Clostridium Desulfovibrio spp., cocleatum and Clostridium xylanolyticum were increased27. And endotoxin level was increased in DEN induced HCC in rats13. However, no significant changes of diversity and richness of fecal microbiota or endotoxin were observed in the present study. LEfSe and ROC analysis revealed that Lachnospiraceae incertae sedis, Rumincoccaceae UCG-004 and Prevotella 9 could be used as a microbial signature for the differential diagnosis of HCC. Recent study indicated Lachnospiraceae could discriminate non-alcoholic fatty liver disease (NAFLD) patients from controls. And increased Ruminococcus could be a gut microbiota signature of NAFLD onset and NAFLD-NASH (non-alcoholic steatohepatitis) progression28. Prevotella is a beneficial bacterium that can produce short chain fatty acids. Prohep, a novel probiotic mixture, could suppress HCC growth in mice by regulation of the T cells differentiation in the gut, which in turn alters the level of the proinflammatory cytokines in the tumor microenvironment29. In the present study, CaA or ChA treatment could reverse the decrease of Prevotella 9.
As well known, most of the gut microorganisms are anaerobe, such as Lachnospiraceae and Prevotella. Our previous study had shown that CaA or ChA exert antioxidative activity8, their strong oxygen radical scavenging capacity may provide a survival advantage of these bacteria. In addition, CaA and ChA had been shown to possess antibacterial activity30, which could be associated with a reduction in the abundance of species capable of holding these bacteria, thus favouring a rise in their proportion. However, we have not directly established the causal relationship between the changes of gut microbiota and dietary CaA or ChA.
HCC encompasses a spectrum of hepatic pathology. Similar to previous study31, levels of serum ALT and AST were increased in DEN group. CaA or ChA treatment remarkably inhibit the activities of these enzymes, and these effects could be confirmed by histopathological observation. TBA was increased in cirrhotic and HCC patients, and bile acids could also promote DEN-induced HCC via increased inflammatory signaling32. HCC patients with low level of ALP have favorable overall survival33. In the present study, CaA or ChA treatment could significantly block the increase of TBA and ALP in DEN group. The disorder of lipid metabolism is the major hallmark of HCC34. CHOL, HDL and LDL were increased in DEN group, CaA or ChA treatment could significantly reverse these effects. CaA and ChA may have indirect effect of on liver function through gut microbiota.
Characteristic metabolic deregulations of HCC may enable novel biomarkers discovery for early diagnosis. In the present study, 72 differential metabolites with statistical significance were firstly acquired based on the comparison between DEN group and the control. To pick up the same therapeutic targets of CaA or ChA, these differential metabolites were further explored based on the comparison between DEN group and CaA or ChA group. Further, the metabolite-microbial relationships were evaluated by the correlation analyses. The initial data was composed of 28 metabolites and 3 microbiota variables. 17 metabolites were correlated with at least one of 3 microbiota in both CaA and ChA groups. Bilirubin, L-Tyrosine, L-Methionine and Ethanolamine were increased in DEN group, and they were correlated with all these three bacterium. Dietary L-Methionine restriction has been reported to improve hepatocyte function in mammals35. The aberrant ethanolamine phospholipid metabolism in cancer has recently further been established and solidified as a universal metabolic hallmark of cancer36. In HCC patients, elevated bilirubin levels were associated with higher AFP levels, increased portal vein thrombosis and multifocality and lower survival37. Oxidized tyrosine enhanced AST and ALT activities, increased total bilirubin content, and led to oxidative damage in rat liver38. In addition to liver, gut microbiota could influence hepatic metabolites and plasma biomarkers, such as HDL cholesterol, free fatty acids, and bilirubin39. The metabolic process of L-Tyrosine is carried out by bacteria as well by liver cells40. Tyrosine could be metabolized by Lachnospiraceae and Rumincoccaceae in vitro 41. Prevotella processes methionine γ lyase, which could catalyze α, γ-elimination of L-methionine42.
The integration of metabonomics and fecal microbiota profiling provided important information on the changes of gut microbiota and metabolites in DEN induced HCC after CaA or ChA treatment. The correlation between gut microbiota and metabolites provided important information on the development of HCC, which could also be potential therapeutic targets. Further human studies are required to validate the proposed model and to better describe other associations between gut microbiota phylotypes, metabotypes, and disease phenotypes.
Methods
Chemicals and materials
HPLC grade methanol, acetonitrile and formic acid were all purchased from Merck (Merck, Darmstadt, Germany). Diethylnitrosamine (DEN, ≥99.0% purity) was purchased from CNW Tecnologies (Anpel, Shanghai, China). Caffeic acid (purity >99%) was purchased from Aladdin (Shanghai, China). Chlorogenic acid (purity >99%) was purchased from Nanjing ZhiBaiCui Biology Technology Co., Ltd (Nanjing, China). N,O-Bis(trimethylsilyl)trifluoroacetamide (BSTFA) was obtained from Sigma-Aldrich (St. Louis, MO, USA). Deionized water was manufactured by Milli-Q50SP Reagent system (Millipore Corporation, MA, USA). The enzyme linked immunosorbent assay (ELISA) kits of rat LPS was obtained from SenBeiJia Biotechnology Co., Ltd. (Nanjing, China).
Animal-experiments and sample preparation
Twenty four male Wistar rats (150~200 g) were supplied by Shanghai SLAC Lab. Animal Co., Ltd. (Shanghai, China). The rats were housed in a breeding room with temperature of 22–24 °C, relative humidity of 50–70%, and a 12 h light-dark cycle. They were fed with standard pellet diet, supplied with water ad libitum, and were acclimatized to the facilities 1 week prior to the experiments. The rat HCC model was established by DEN treatment according to previous study with some modified43. These rats were divided into 4 groups: control group, DEN group, CaA group and ChA group. The control group received tap water, CaA group and ChA group received 100 mg/kg CaA and ChA by intragastric (i.g.) administration throughout the experiment, respectively. Meanwhile, DEN group, CA group and ChA group rats were given water containing 100 mg/L DEN from week 1 to week 12. These three groups were administrated with DEN (70 mg/kg) via intraperitoneal injection (i.p.) twice a week from week 13 to week 20. These three groups were given 50 mg/kg DEN (i.p.) every three days from week 21 to week 31. After sacrificed, blood, tissue and stool samples were collected and stored in −80 °C before use. The care and use of the animals were followed the animal welfare guidelines, and all the experimental protocols were approved by the Animal Care and Welfare Committee of Nanjing Medical University.
Determination of biochemical parameters
Serum biochemical parameters, such as alanine transarninase (ALT), aspartate aminotransferase (AST), albumin (ALB), alkaline phosphatase (ALP), total bile acid (TBA), total cholesterol (TC), triglycerides (TG), high density lipoprotein cholesterol (HDL) and low density lipoprotein cholesterol (LDL) were measured by a biochemistry analyzer (Hitachi 7100, Japan). The levels of LPS in serum and liver were determined using ELISA kits.
Histological analysis
The anterior portion of the left lateral lobe of the liver was sectioned and used for histological analysis. The tissue was fixed by immersion in 10% neutral-buffered formalin. The sample was then embedded in paraffin, sliced into 5 ìm sections and stained with hematoxylin and eosin (H&E), followed by blinded histological assessment using an optical microscope (Axioskop 2 plus, Carl Zeiss, Hamburg, Germany).
Gut microbiota characterization
Genomic DNA was extracted from each fecal sample according to our previous study15. Bacterial 16 S rRNA at the V3 hypervariable region was amplified using a set of primers (338 F: 5′-GTGCCAGCMGCCGCGGTAA-3′ and 806 R: 5′-GGACTACHVGGGTWTCTAAT-3′). Sequencing was performed by an Illumina MiSeq (PE300). Sequences were then trimmed and classified with the QIIME toolkit. The high-quality reads were clustered into operational taxonomic units (OTUs) using Mothur. The OTUs that reached at a 97% nucleotide similarity level were used for alpha diversity (Shannon and Simpson index), richness (ACE and Chao1), Good’s coverage, and rarefaction curve analysis using Mothur. Taxonomy-based analyses were performed by classifying each sequence using the Naïve Bayesian Classifier program of the Michigan State University Center for Microbial Ecology Ribosomal Database Project (RDP) database (http://rdp.cme.msu.edu/) with a 70% bootstrap score. LEfSe (http://huttenhower.sph.harvard.edu/galaxy/) was used to identify taxa that differed consistently between sample types according to previous studies44, 45.
Metabolic profiling
Thawed serum smaples (450 μl) were spiked with ice cold methanol (1350 μl). After centrifugation of the mixture at 12000 rpm g for 15 min at 4 °C, the supernatant fraction was collected and divided into two parts: one (300ìl) for liquid chromatography- mass spectrometry (LC-MS) analysis and one (150 ìl) for gas chromatography -mass spectrometer (GC-MS) analysis after derivatization with BSTFA (containing 1% TMCS). Serum metabolic profiling analysis by LC-MS was performed as our previous study46. Briefly, LC-MS analysis was performed on a Thermo Scientific Q Exactive hybrid quadrupole-orbitrap mass spectrometer coupled with a UPLC Ultimate 3000 system (Thermo Fisher Scientific, Bremen, Germany) equipped a heated electrospray source (HESI), at both positive and negative ion modes. LC-MS analysis was performed on a Thermo TRACE 1310 gas chromatograph system coupled with a Thermo TSQ 8000 Triple Quadrupole mass spectrometer. The quality control (QC) was pooled with same volume from each sample to ensure the reproducibility and stability druing the whole procedure.
Metabolomics Data processing and Statistical analysis
The GC-MS data files were processed by R software package and the UPLC-MS data files were performed via SIEVE software (Thermo Fisher Scientific) for peak feature extraction, migration time correction, denoising, smoothing, alignment and normalization. A total of 3172 features were extracted from the LC-MS data (2891 from positive ion mode and 281 from negative ion mode), and 831 were extracted from the GC-MS data. After data pretreatment, the processed data were subjected to multivariate statistical analysis using SIMCA-P 13.0 software (Umetrics, Umea, Sweden)47. The principal component analysis (PCA) and the partial least squares discriminant analysis (PLS-DA) were performed to detect distributions of deferent groups, classification and comparison in each group. The variable importance in the projection (VIP) obtained from multivariate statistical analysis can provided significantly changed variables after drug intervention. The statistical significance was calculated using the Student t-test (P value < 0.05), in summary, the variates which P value less than 0.5 with VIP value larger than 1.0 were considered as significative differential metabolites48. The identification of different signal from MS data was using an in-house metabolite library, literatures and database, like HMDB. The pathway analysis was performed by MetaboAnalyst 3.0 (http://www.metaboanalyst.ca)49 and KEGG database was also used to identify relevant metabolic pathway.
Statistical analysis
The differences in body weight, relative liver weight and biochemical parameters were analyzed using one-way analysis of variance (ANOVA) by SPSS 13.0 software (Chicago, IL, USA). The receiver operating characteristic (ROC) curve for each crucial taxa was generated, and the area under the parametric curve (AUC) was computed by SPSS. A Mann-Whitney U test was used to assess the differences in taxonomy of fecal microbiota. The correlation between richness of fecal microbiota and significant differential metabolites were analyzed by R software. Differences were considered statistically significant at P ≤ 0.05.
Electronic supplementary material
Acknowledgements
This work was supported by the Natural Science Foundations of China (81473020 and 81502801), a project funded by the Priority Academic Program Development of Jiangsu Higher Education Institutions (2014), and a collegiate Natural Science Foundations of Jiangsu province (16KJB330005).
Author Contributions
Z.Z., D.W. and S.Y.C. contributed to animal model, D.W., L.W. and S.L.Q. carried out the metabonomics, Z.Z., X.Y.W. and S.L.Q. performed the statistical analysis and data interpretation. Z.Z. and D.W. prepared the manuscript. L.L. conceptualized and organized the whole study, X.J.S. and L.L. conceived and finally revised this manuscript. All authors critically reviewed the manuscript and approved the final draft.
Competing Interests
The authors declare that they have no competing interests.
Footnotes
Zhan Zhang and Di Wang contributed equally to this work.
Electronic supplementary material
Supplementary information accompanies this paper at doi:10.1038/s41598-017-04888-y
Publisher's note: Springer Nature remains neutral with regard to jurisdictional claims in published maps and institutional affiliations.
References
- 1.Ferlay J, et al. Cancer incidence and mortality worldwide: sources, methods and major patterns in GLOBOCAN 2012. Int J Cancer. 2015;136:E359–386. doi: 10.1002/ijc.29210. [DOI] [PubMed] [Google Scholar]
- 2.Shen J, et al. 14-3-3eta is a novel growth-promoting and angiogenic factor in hepatocellular carcinoma. J Hepatol. 2016;65:953–962. doi: 10.1016/j.jhep.2016.05.017. [DOI] [PubMed] [Google Scholar]
- 3.European Association For The Study Of The, L., European Organisation For, R. & Treatment Of, C. EASL-EORTC clinical practice guidelines: management of hepatocellular carcinoma. J Hepatol56, 908–943 (2012). [DOI] [PubMed]
- 4.Parvez MK, Arbab AH, Al-Dosari MS, Al-Rehaily AJ. Antiviral Natural Products Against Chronic Hepatitis B: Recent Developments. Curr Pharm Des. 2016;22:286–293. doi: 10.2174/1381612822666151112152733. [DOI] [PubMed] [Google Scholar]
- 5.Meng S, Cao J, Feng Q, Peng J, Hu Y. Roles of chlorogenic Acid on regulating glucose and lipids metabolism: a review. Evid Based Complement Alternat Med. 2013;2013:801457. doi: 10.1155/2013/801457. [DOI] [PMC free article] [PubMed] [Google Scholar]
- 6.Touaibia M, Jean-Francois J, Doiron J. Caffeic Acid, a versatile pharmacophore: an overview. Mini Rev Med Chem. 2011;11:695–713. doi: 10.2174/138955711796268750. [DOI] [PubMed] [Google Scholar]
- 7.Williamson G, Dionisi F, Renouf M. Flavanols from green tea and phenolic acids from coffee: critical quantitative evaluation of the pharmacokinetic data in humans after consumption of single doses of beverages. Mol Nutr Food Res. 2011;55:864–873. doi: 10.1002/mnfr.201000631. [DOI] [PubMed] [Google Scholar]
- 8.Zhao J, et al. Synergistic protective effect of chlorogenic acid, apigenin and caffeic acid against carbon tetrachloride-induced hepatotoxicity in male mice. RSC Adv. 2014;4:43057–43063. doi: 10.1039/C4RA07261H. [DOI] [Google Scholar]
- 9.Darvesh AS, Bishayee A. Chemopreventive and therapeutic potential of tea polyphenols in hepatocellular cancer. Nutr Cancer. 2013;65:329–344. doi: 10.1080/01635581.2013.767367. [DOI] [PubMed] [Google Scholar]
- 10.Sur S, Pal D, Mandal S, Roy A, Panda CK. Tea polyphenols epigallocatechin gallete and theaflavin restrict mouse liver carcinogenesis through modulation of self-renewal Wnt and hedgehog pathways. J Nutr Biochem. 2016;27:32–42. doi: 10.1016/j.jnutbio.2015.08.016. [DOI] [PubMed] [Google Scholar]
- 11.Mazagova M, et al. Commensal microbiota is hepatoprotective and prevents liver fibrosis in mice. FASEB J. 2015;29:1043–1055. doi: 10.1096/fj.14-259515. [DOI] [PMC free article] [PubMed] [Google Scholar]
- 12.Son, G., Kremer, M. & Hines, I. N. Contribution of gut bacteria to liver pathobiology. Gastroenterol Res Pract2010 (2010). [DOI] [PMC free article] [PubMed]
- 13.Zhang HL, et al. Profound impact of gut homeostasis on chemically-induced pro-tumorigenic inflammation and hepatocarcinogenesis in rats. J Hepatol. 2012;57:803–812. doi: 10.1016/j.jhep.2012.06.011. [DOI] [PubMed] [Google Scholar]
- 14.Tao X, Wang N, Qin W. Gut Microbiota and Hepatocellular Carcinoma. Gastrointest Tumors. 2015;2:33–40. doi: 10.1159/000380895. [DOI] [PMC free article] [PubMed] [Google Scholar]
- 15.Zhang Z, et al. Caffeic acid ameliorates colitis in association with increased Akkermansia population in the gut microbiota of mice. Oncotarget. 2016;7:31790–31799. doi: 10.18632/oncotarget.9306. [DOI] [PMC free article] [PubMed] [Google Scholar]
- 16.Naz S, Garcia A, Barbas C. Multiplatform analytical methodology for metabolic fingerprinting of lung tissue. Anal Chem. 2013;85:10941–10948. doi: 10.1021/ac402411n. [DOI] [PubMed] [Google Scholar]
- 17.Huang Q, et al. Metabolic characterization of hepatocellular carcinoma using nontargeted tissue metabolomics. Cancer Res. 2013;73:4992–5002. doi: 10.1158/0008-5472.CAN-13-0308. [DOI] [PubMed] [Google Scholar]
- 18.Putignani L, et al. Gut Microbiota Dysbiosis as Risk and Premorbid Factors of IBD and IBS Along the Childhood-Adulthood Transition. Inflamm Bowel Dis. 2016;22:487–504. doi: 10.1097/MIB.0000000000000602. [DOI] [PubMed] [Google Scholar]
- 19.Vernocchi P, Del Chierico F, Putignani L. Gut Microbiota Profiling: Metabolomics Based Approach to Unravel Compounds Affecting Human Health. Front Microbiol. 2016;7:1144. doi: 10.3389/fmicb.2016.01144. [DOI] [PMC free article] [PubMed] [Google Scholar]
- 20.Zhao JA, Sang MX, Geng CZ, Wang SJ, Shan BE. A novel curcumin analogue is a potent chemotherapy candidate for human hepatocellular carcinoma. Oncol Lett. 2016;12:4252–4262. doi: 10.3892/ol.2016.5126. [DOI] [PMC free article] [PubMed] [Google Scholar]
- 21.Hussain T, Siddiqui HH, Fareed S, Vijayakumar M, Rao CV. Evaluation of chemopreventive effect of Fumaria indica against N-nitrosodiethylamine and CCl4-induced hepatocellular carcinoma in Wistar rats. Asian Pac J Trop Med. 2012;5:623–629. doi: 10.1016/S1995-7645(12)60128-X. [DOI] [PubMed] [Google Scholar]
- 22.Feo F, et al. Genetic alterations in liver carcinogenesis: implications for new preventive and therapeutic strategies. Crit Rev Oncog. 2000;11:19–62. doi: 10.1615/CritRevOncog.v11.i1.20. [DOI] [PubMed] [Google Scholar]
- 23.Zhao JA, et al. Preventive effect of hydrazinocurcumin on carcinogenesis of diethylnitrosamine-induced hepatocarcinoma in male SD rats. Asian Pac J Cancer Prev. 2014;15:2115–2121. doi: 10.7314/APJCP.2014.15.5.2115. [DOI] [PubMed] [Google Scholar]
- 24.Wu CH, Huang HW, Lin JA, Huang SM, Yen GC. The proglycation effect of caffeic acid leads to the elevation of oxidative stress and inflammation in monocytes, macrophages and vascular endothelial cells. J Nutr Biochem. 2011;22:585–594. doi: 10.1016/j.jnutbio.2010.05.002. [DOI] [PubMed] [Google Scholar]
- 25.Shi H, et al. Chlorogenic acid reduces liver inflammation and fibrosis through inhibition of toll-like receptor 4 signaling pathway. Toxicology. 2013;303:107–114. doi: 10.1016/j.tox.2012.10.025. [DOI] [PubMed] [Google Scholar]
- 26.Li Y, et al. Blockage of TGFbeta-SMAD2 by demethylation-activated miR-148a is involved in caffeic acid-induced inhibition of cancer stem cell-like properties in vitro and in vivo. FEBS Open Bio. 2015;5:466–475. doi: 10.1016/j.fob.2015.05.009. [DOI] [PMC free article] [PubMed] [Google Scholar]
- 27.Xie G, et al. Distinctly altered gut microbiota in the progression of liver disease. Oncotarget. 2016;7:19355–19366. doi: 10.18632/oncotarget.8466. [DOI] [PMC free article] [PubMed] [Google Scholar]
- 28.Del Chierico, F. et al. Gut microbiota profiling of pediatric NAFLD and obese patients unveiled by an integrated meta-omics based approach. Hepatology (2016). [DOI] [PubMed]
- 29.Li J, et al. Probiotics modulated gut microbiota suppresses hepatocellular carcinoma growth in mice. Proc Natl Acad Sci USA. 2016;113:E1306–1315. doi: 10.1073/pnas.1518189113. [DOI] [PMC free article] [PubMed] [Google Scholar]
- 30.Pinho E, Soares G, Henriques M. Evaluation of antibacterial activity of caffeic acid encapsulated by beta-cyclodextrins. J Microencapsul. 2015;32:804–810. doi: 10.3109/02652048.2015.1094531. [DOI] [PubMed] [Google Scholar]
- 31.Wang PW, Hung YC, Li WT, Yeh CT, Pan TL. Systematic revelation of the protective effect and mechanism of Cordycep sinensis on diethylnitrosamine-induced rat hepatocellular carcinoma with proteomics. Oncotarget. 2016;7:60270–60289. doi: 10.18632/oncotarget.11201. [DOI] [PMC free article] [PubMed] [Google Scholar]
- 32.Sun L, et al. Bile acids promote diethylnitrosamine-induced hepatocellular carcinoma via increased inflammatory signaling. Am J Physiol Gastrointest Liver Physiol. 2016;311:G91–G104. doi: 10.1152/ajpgi.00027.2015. [DOI] [PMC free article] [PubMed] [Google Scholar]
- 33.Wu SJ, et al. Prognostic value of alkaline phosphatase, gamma-glutamyl transpeptidase and lactate dehydrogenase in hepatocellular carcinoma patients treated with liver resection. Int J Surg. 2016;36:143–151. doi: 10.1016/j.ijsu.2016.10.033. [DOI] [PubMed] [Google Scholar]
- 34.Gu J, et al. Nonalcoholic Lipid Accumulation and Hepatocyte Malignant Transformation. J Clin Transl Hepatol. 2016;4:123–130. doi: 10.14218/JCTH.2016.00010. [DOI] [PMC free article] [PubMed] [Google Scholar]
- 35.Ying Y, et al. Dietary L-methionine restriction decreases oxidative stress in porcine liver mitochondria. Exp Gerontol. 2015;65:35–41. doi: 10.1016/j.exger.2015.03.004. [DOI] [PubMed] [Google Scholar]
- 36.Cheng M, Bhujwalla ZM, Glunde K. Targeting Phospholipid Metabolism in Cancer. Front Oncol. 2016;6:266. doi: 10.3389/fonc.2016.00266. [DOI] [PMC free article] [PubMed] [Google Scholar]
- 37.Carr BI, et al. Association of abnormal plasma bilirubin with aggressive hepatocellular carcinoma phenotype. Semin Oncol. 2014;41:252–258. doi: 10.1053/j.seminoncol.2014.03.006. [DOI] [PMC free article] [PubMed] [Google Scholar]
- 38.Li ZL, Shi Y, Le G, Ding Y, Zhao Q. 24-Week Exposure to Oxidized Tyrosine Induces Hepatic Fibrosis Involving Activation of the MAPK/TGF-beta1 Signaling Pathway in Sprague-Dawley Rats Model. Oxid Med Cell Longev. 2016;2016:3123294. doi: 10.1155/2016/3123294. [DOI] [PMC free article] [PubMed] [Google Scholar]
- 39.Montagner A, et al. Hepatic circadian clock oscillators and nuclear receptors integrate microbiome-derived signals. Sci Rep. 2016;6:20127. doi: 10.1038/srep20127. [DOI] [PMC free article] [PubMed] [Google Scholar]
- 40.Fitzpatrick PF. Mechanism of aromatic amino acid hydroxylation. Biochemistry. 2003;42:14083–14091. doi: 10.1021/bi035656u. [DOI] [PMC free article] [PubMed] [Google Scholar]
- 41.Gryp, T., Vanholder, R., Vaneechoutte, M. & Glorieux, G. p-Cresyl Sulfate. Toxins (Basel)9 (2017). [DOI] [PMC free article] [PubMed]
- 42.Stephen AS, et al. In Vitro Effect of Porphyromonas gingivalis Methionine Gamma Lyase on Biofilm Composition and Oral Inflammatory Response. PLoS One. 2016;11:e0169157. doi: 10.1371/journal.pone.0169157. [DOI] [PMC free article] [PubMed] [Google Scholar]
- 43.Hsu W-H, et al. Evaluation of the Medicinal Herb Graptopetalum paraguayense as a Treatment for Liver Cancer. PLoS ONE. 2015;10:e0121298. doi: 10.1371/journal.pone.0121298. [DOI] [PMC free article] [PubMed] [Google Scholar]
- 44.Lu H, et al. Deep sequencing reveals microbiota dysbiosis of tongue coat in patients with liver carcinoma. Sci Rep. 2016;6:33142. doi: 10.1038/srep33142. [DOI] [PMC free article] [PubMed] [Google Scholar]
- 45.Segata N, et al. Metagenomic biomarker discovery and explanation. Genome Biol. 2011;12:R60. doi: 10.1186/gb-2011-12-6-r60. [DOI] [PMC free article] [PubMed] [Google Scholar]
- 46.Yu X, et al. A metabolomics-based approach for ranking the depressive level in a chronic unpredictable mild stress rat model. Rsc Advances. 2016;6:25751–25765. doi: 10.1039/C6RA00665E. [DOI] [Google Scholar]
- 47.Zeng J, et al. Metabolomics Identifies Biomarker Pattern for Early Diagnosis of Hepatocellular Carcinoma: from Diethylnitrosamine Treated Rats to Patients. Sci Rep. 2015;5:16101. doi: 10.1038/srep16101. [DOI] [PMC free article] [PubMed] [Google Scholar]
- 48.Gao D, et al. Metabolomics study on the antitumor effect of marine natural compound flexibilide in HCT-116 colon cancer cell line. Journal of Chromatography B. 2016;1014:17–23. doi: 10.1016/j.jchromb.2016.01.003. [DOI] [PubMed] [Google Scholar]
- 49.Xia J, Sinelnikov IV, Han B, Wishart DS. MetaboAnalyst 3.0–making metabolomics more meaningful. Nucleic Acids Research. 2015;43:W251–W257. doi: 10.1093/nar/gkv380. [DOI] [PMC free article] [PubMed] [Google Scholar]
Associated Data
This section collects any data citations, data availability statements, or supplementary materials included in this article.


