Abstract
We report the enhanced thermoelectric properties of Ce-doped AgSbTe2 (AgSb1−xCexTe2) compounds. As the Ce contents increased, the proportion of heterophase Ag2Te in the AgSbTe2 gradually decreased, along with the size of the crystals. The electrical resistivity and Seebeck coefficient were dramatically affected by Ce doping and the lattice thermal conductivity was reduced. The presence of nanostructured Ag2Te heterophases resulted in a greatly enhanced dimensionless figure of merit, ZT of 1.5 at 673 K. These findings highlight the importance of the heterophase and doping control, which determines both electrical and thermal properties.
Introduction
Thermoelectric (TE) power generators can be used to recycle waste heat from automobiles and incinerators. Although these devices are reliable and compact, the low energy conversion efficiency is a main drawback for TE power generation1, 2. The efficiency of TE power generators is limited by the temperature environment and TE figure of merit (ZT) of the materials used, as follows: ZT = S 2 T/ρк, where S is the Seebeck coefficient, ρ is the electrical resistivity, κ is the thermal conductivity, and T is temperature in Kelvin3, 4. Several efforts have been made to improve ZT.
Recently, the compound AgSbTe2 has been investigated as a potentially important component in high-performance bulk nanostructured TE materials, such as the LAST-m, ((PbTe)m(AgSbTe2))5 and TAGS-x ((GeTe)x(AgSbTe2)100−x)6–9. There is much interest in nanocomposite materials comprising heterophases which are embedded in the matrix10–13.
AgSbTe2 is also important by itself due to its good TE properties combined with relatively low thermal conductivity (0.6–0.7 W/mK)14–16. Wang et al. reported that AgSbTe2 has a high ZT = 1.59 at 673 K due to its extremely low thermal conductivity16. Also, some papers have reported good TE properties in the non-stoichiometric compositions formed by controlling the secondary phase, such as nanoscaled Ag2Te and Sb2Te3 17, 18. Others have tried to not only reduce the lattice thermal conductivity but also adjust the carrier concentrations using dopants such as Na, Se, and Mn in AgSbTe2 19–21; by suppressing the formation of impurity phases, they enhanced the TE properties. It is clear from the research mentioned that large-scale precipitates have a deleterious impact on TE properties, whereas the formation of nanoscale dispersion enhances these properties. Interfaces within a TE material have been shown to reduce the thermal conductivity without degrading the electrical conductivity22, 23.
In this work, we investigated the influence of Ce doping on the microstructure and TE properties of AgSb1−xCexTe2 as we varied the Ce concentration (x = 0–0.004). We found that the proportion of Ag2Te was significantly influenced by the Ce dopant, leading to improvements in the ZT value. To our knowledge, this is first observation of ZT enhancement arising from controlling the Ag2Te phase by doping. Du et al. reported on the effect of Ce on excess Te in AgSbTe2.01 compounds24. However, they did not sufficiently explain their results in terms of their impact on TE properties, particularly in relation to the morphology, or the effects of doping the compound with Ce. In comparison to their results, our results show considerably different transport properties. In practice, the carrier concentration and mobility were considerably different in our work. This difference may be attributable to a different fabrication process and the composition of the samples, which may result in different microstructures. A spark plasma sintering method was used in ref. 24., while a hot-pressing method was employed here to solidify samples, as well as the sintering temperature and pressure were also different, resulting in development of different morphologies. However, they did not report on the microstructure of their samples. In a related development, Marin et al.25. reported that the physical properties of single-crystalline samples of this material vary as a result of micro-fluctuations in the chemical composition. We demonstrate experimentally that doping AgSbTe2 systems with Ce is an effective approach for improving TE performance by reducing thermal conductivity and adjusting carrier concentrations; specifically, Ce doping enables control over the proportion of Ag2Te heterophases in the matrix AgSbTe2.
Results and Discussion
The samples were obtained from sintering powders with hot-pressing method, in which the powders were obtained from melting elemental materials in quartz tubes with the nominal composition of AgSb1−xCexTe2 (0.001 ≤ x ≤ 0.004). Figure 1 shows the X-ray diffraction (XRD) pattern in Ce-doped AgSbTe2 compounds, obtained from the powder of the sintered samples. The phase of the AgSbTe2 and the small amount of Ag2Te were detected in all samples. The crystal structures of AgSbTe2 were identified as they caused disordered NaCl structures (space group, Fmm), in which the Ag and Sb were located at the Na site. A small amount of Ag2Te secondary phases were identified along with the main cubic phase. It should be noted that the exact crystal structure of AgSbTe2 is currently a subject of debate, so we do not know, for example, whether it is crystallized in R m, P4/mmm and etc26, 27. We attempted to refine the AgSbTe2 structure based on the model of the disordered NaCl structure (Fm m) and different models of ordered structures (R m, P4/mmm and, Fd m) using the Rietveld refinement method. Our Rietveld refinement analysis revealed that it was not easy to distinguish the crystal structure based on the statistical results from the refinement: the R wp and χ 2 values are 7.85/2.08 in , 7.91/2.10 in , 7.71/2.45 in , and 7.76/2.05 in , respectively. Thus, we consider the space group of AgSbTe2 to maintain consistency with many other studies.
Figure 1.
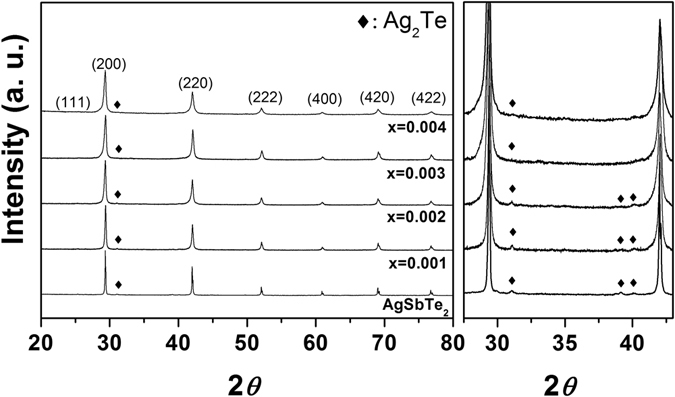
X-ray diffraction (XRD) patterns of Ce-doped AgSb1−xCexTe2 samples; the phase of the AgSbTe2 and the small amount of Ag2Te were detected in all samples; the right panel is the patterns focused on the region between 27.5 and 43 degrees.
The cell parameters obtained from the refinement gradually decreased as the proportion of Ce increased. The small amount of Ce led to small changes: 0.6079 nm at x = 0; 0.6078 nm at x = 0.001; 0.6072 nm at x = 0.002; 0.6068 nm at x = 0.003; and 0.6066 nm at x = 0.004. This reduction was not attributed to the substitution of Ce for Sb or Ag, because the atomic or ionic radius of Ce is larger than that of Sb and Ag. Notably, it was found that the lattice parameters decreased with the amount of Ag2Te18. We speculate that the reduction in the lattice parameters is due to the reduction in the amount of Ag2Te. This speculation is supported by other observations detailed in the rest of this article.
Quantitative analysis of Ag2Te was carried out using the Rietveld refinement method. The results are shown in Table 1. The Ag2Te ratio decreased from 9.5% to 2.0%; the peaks also broadened with Ce doping. The peak broadening was analyzed using the Williamson–Hall equation:
| 1 |
Table 1.
Rietveld refinement results of the Ce-doped AgSb1−xCexTe2 samples.
| Sample | Detected Ce contents (ICP) | R exp | R wp | χ 2 | Ag 2 Te wt% | Cation sites occupancy | ||
|---|---|---|---|---|---|---|---|---|
| Ag | Sb | Ag/Sb | ||||||
| AgSbTe2 | Non | 3.78 | 7.85 | 2.08 | 9.5% | 0.754 | 1.074 | 0.702 |
| x = 0.001 | Non | 7.07 | 8.23 | 1.16 | 6.2% | 0.772 | 1.078 | 0.716 |
| x = 0.002 | x = 0.0037 | 4.81 | 8.00 | 1.66 | 6.0% | 0.784 | 1.066 | 0.735 |
| x = 0.003 | x = 0.0056 | 4.72 | 9.79 | 2.07 | 4.2% | 0.97 | 1.136 | 0.854 |
| x = 0.004 | x = 0.0111 | 3.89 | 9.66 | 2.48 | 2.0% | 0.974 | 1.136 | 0.857 |
where β is the integral breadth of the diffraction peak, λ is the X-ray wavelength, d is the average grain size, ѳ is the Bragg diffraction angle, and ε is the microscopic strain28. The crystal size decreased as the amount of Ce increased: 71.8 nm at x = 0; 55.9 nm at x = 0.001; 47.3 nm at x = 0.002; 35.4 nm at x = 0.003; and 34.5 nm at x = 0.004.
To determine the microstructure of the compound, SEM images were obtained (Fig. 2). The continuously segregated precipitates of Ag2Te in the melted ingot at the grain boundaries are clearly shown in Fig. 2(a), in which the SEM and elemental mapping images of the ingots obtained after the melting–quenching cycle are shown. It is clear that the Ag2Te phase formed after the solidification of AgSbTe2. The segregated precipitates were crushed during pulverization of the ingot and remained as isolated precipitates in the sintered samples, as shown in Fig. 2(b). The light and dark regions were Ag2Te precipitates and AgSbTe2 matrix, respectively. Nano-sized precipitates were not observed in the images. Additionally, the amount of Ag2Te precipitate decreased as the amount of Ce increased, as shown in Fig. 2(c–e). The size of each precipitate was also reduced, in agreement with our XRD analysis.
Figure 2.
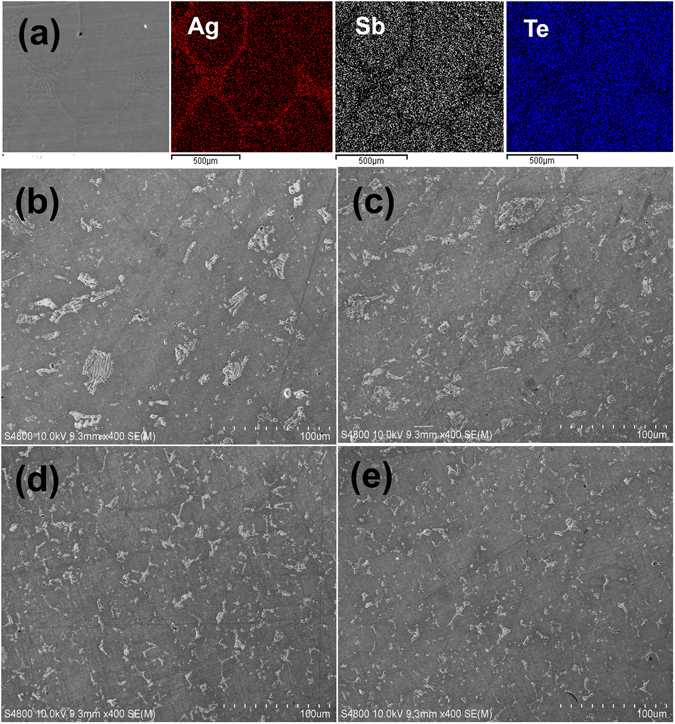
(a) SEM images and the elemental distribution of AgSbTe2 ingots quenched after melting; the region of grain boundaries was identified as Ag2Te precipitates, (b–e) SEM images of the hot-pressed samples; the light and dark regions are Ag2Te precipitates and AgSbTe2 matrix, respectively; the precipitates crushed from melted ingots remained as isolated precipitates in the sintered samples, (b) AgSbTe2, (c) x = 0.002, (d) x = 0.003, and (e) x = 0.004 samples in AgSb1−xCexTe2.
The reduced amount of Ag2Te was also confirmed by differential scanning calorimetry (DSC) measurements. The endothermic peaks at 423 K can be observed in the DSC curves shown in Fig. 3. The peak at 423 K corresponds to the phase transition peaks from α-Ag2Te to β-Ag2Te29. The intensity of the peak at 423 K is distinctly lower for the x = 0.002 and the x = 0.004 samples. This is due to the decreased Ag2Te ratio. We confirmed the reduction in the proportion of Ag2Te in Ce-doped AgSbTe2 using a variety of analyses. At this stage, one may argue that the reduction in the amount of Sb in the studied samples may lead to the reduction of Ag2Te. From the phase diagram between Ag2Te and Sb2Te330, 31, we can easily see that the amount of Ag2Te is lower in Sb-rich AgSbTe2. Thus, the reduction in the proportion of Ag2Te can be attributed to the addition of Ce. The reduction in Ag2Te with such a small amount of Ce may be due to the following: It is noteworthy that the rock salt-structured compound exists in a range of stable compositions between Ag0.76Sb1.16Te2.08, and Ag0.88Sb1.12Te2 and the cations are disordered in Sb-rich compositions32. First-principles calculations also showed that AgSb and SbAg antisite defects can be favorably formed in AgSbTe2 33. The Sb-rich composition of AgSbTe2 is attributed to the formation of SbAg. The formation of antisite defects is dependent on the difference in the electronegativity between two elements; the values for Ag and Sb are 1.93 and 2.05, respectively34, 35. If the averaged difference of the electronegativity of the cations changes, the behavior of the antisite defect formation will also change35, 36. It is known that the electronegativity of Ce is 1.12. Hence, the averaged difference would change as Ce is added, resulting in Ag occupying more cation sites in AgSbTe2 and a reduction in the proportion of Ag2Te. It is clearly shown that ratio of cation sites occupancies of Ag to Sb in AgSbTe2 increased with Ce doping as indicated in Table 1.
Figure 3.
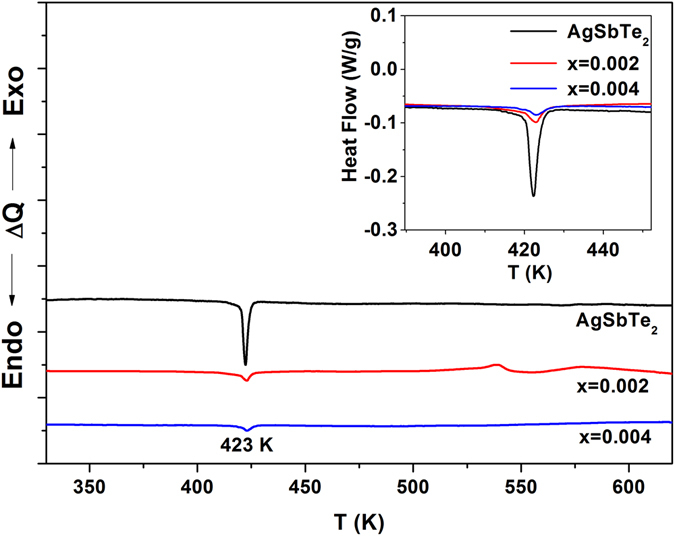
Differential scanning calorimetry (DSC) curves for the Ce-doped AgSb1−xCexTe2 samples; the peak at 423 K corresponds to the phase transition peaks from α-Ag2Te to β-Ag2Te. The intensity decreased with Ce doping, which is related with the decreased Ag2Te ratio. (The sample mass is 50 mg.)
Figure 4(a) and (b) show the effect of temperature on the electrical resistivity (ρ) and Seebeck coefficient (S) of Ce-doped AgSbTe2 compounds. It is well known that the electrical resistivity depends on the carrier concentration and mobility according to ρ = 1/enμ, where μ and e are the mobility and carrier charge, respectively. Table 2 shows the carrier concentration and the mobility of Ce-doped AgSbTe2 compounds at room temperature. The positive Seebeck coefficient and Hall coefficient indicate that the major carriers are holes. The carrier concentration increased with the amount of Ce added, whereas the mobility of the Ce-doped compound was lower than that of the undoped compound. Thus, the reduced electrical resistivity of the Ce-doped compound, except for x = 0.001, was mainly caused by changes in the carrier concentration. The reduction in the Seebeck coefficient as Ce is added can also be attributed to the carrier concentration, because S depends on S ~ p −2/3 in highly degenerate semiconductors3. The reduced mobility is thought to be due to the finer crystallite size in the Ce-doped AgSbTe2. Ag2Te acts as a minor carrier in the p-type AgSbTe2 matrix, so by decreasing the proportion of Ag2Te, the carrier concentration can increase17, 37.
Figure 4.
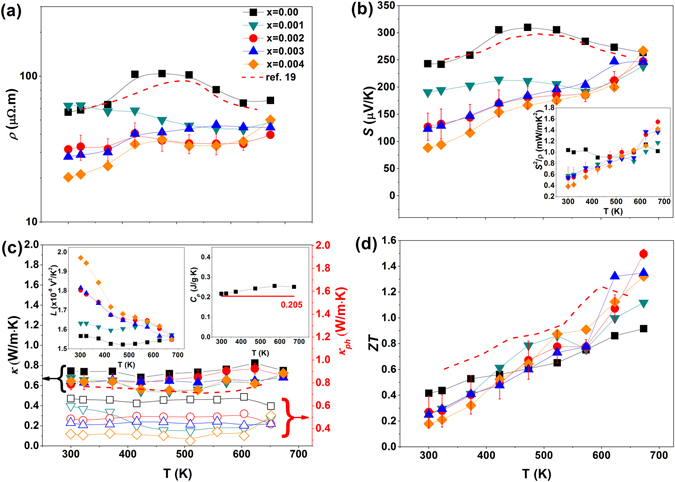
Effect of temperature on the thermoelectric (TE) properties of Ce-doped AgSb1−xCexTe2: (a) electrical resistivity, (b) Seebeck coefficient; the inset shows the power factors, (c) total thermal conductivity (solid shapes) and lattice thermal conductivity (open shapes); the left and right insets show the Lorenz number and the heat capacity, respectively. (The red line of 0.205 J/g∙K in the right inset in (c) represents the literature value from ref. 14.), and (d) the dimensionless figure of merit (ZT). The red dashed lines in all four panels are the corresponding data from ref. 19., while that in (c) is the total thermal conductivity from ref. 19.
Table 2.
Carrier concentration and the mobility of Ce-doped AgSb1−xCexTe2 samples.
| Sample | h (/cm3) | μ (cm2/Vs) |
|---|---|---|
| AgSbTe2 | 5.55 × 10¹⁸ | 190 |
| x = 0.001 | 6.59 × 10¹⁸ | 163 |
| x = 0.002 | 1.32 × 10¹⁹ | 143 |
| x = 0.003 | 1.27 × 10¹⁹ | 175 |
| x = 0.004 | 1.57 × 10¹⁹ | 157 |
The broad bump in the temperature dependence of the ρ and S from AgSbTe2 is interesting. It is known that the abrupt changes at ~423 K in ρ and S are related to a phase transition from α-Ag2Te to β-Ag2Te18. This bump was not clearly observed in the Ce-doped compound, which may be due to the reduction in the proportion of Ag2Te. The values of the electrical resistivity at high temperatures were smaller for the Ce-doped compound. This is also thought to be due to the reduction in Ag2Te, which can be a source of scattering.
The temperature dependence of the power factor (S 2 /ρ) is shown in the inset of Fig. 4(b). The maximum value of 1.55 mW/m·K2 at 673 K was achieved in the x = 0.002 sample. The enlarged power factor at elevated temperatures for the Ce-doped compound was mainly due to the reduced electrical resistivity.
In Fig. 4(c), the solid shapes represent the temperature dependence of the total thermal conductivity (κ), while open/empty shapes are the lattice thermal conductivity (κ ph) of the Ce-doped AgSbTe2 compounds. The lattice thermal conductivity can be evaluated by subtracting the electronic contribution (κ e) from the total thermal conductivity (κ), κ ph = κ − κ e. κ e can be estimated using the Wiedemann–Franz law, κ e = LT/ρ, in which L is the Lorenz number. The value of L is largely dependent on the position of the Fermi level and the scattering mechanism. It can be calculated using:
| 2 |
where λ is the scattering factor (λ = 0 for acoustic phonon scattering and λ = 2 for ionized impurity scattering) and , where f 0 is the Fermi distribution, ξ i s the reduced energy of the carriers, and η is the reduced Fermi energy35, 38. Assuming acoustic phonon scattering and determining the value of η from the measured Seebeck coefficient according to Eq. (3), we were able to calculate the value of L, which is shown in the inset of Fig. 4(c):
| 3 |
All Ce-doped samples had lower total thermal conductivity and lower lattice thermal conductivity than the ternary compound. The lattice thermal conductivity for the x = 0.002 sample was ~0.44 W/m∙K at room temperature and ~0.43 W/m∙K at 673 K, which is ~30% lower than the lattice thermal conductivity of the ternary compound (κ ph = 0.66 and 0.6 W/m∙K at room temperature and 673 K, respectively). The total thermal conductivity was in the range of 0.6–0.8 W/m∙K, similar to that observed in a previous report14. In the inset of Fig. 4(c), the measured specific heat capacity (Cp) of the AgSbTe2 samples was used to calculate the total thermal conductivity. The values are 0.217 J/g∙K at room temperature and 0.251 J/g∙K at 673 K; these values are significantly higher than the literature value (Cp = 0.205 J/g∙K) of AgSbTe2 14.
The reduction in κ as Ce was added was mainly due to the reduction in κ ph. To investigate the origin of the reduced κ ph, we observed the nanoscale microstructures of the samples using TEM. The images obtained are shown in Fig. 5. The nanostructures with a size of about 10 nm were identified as Ag2Te, which is expected from the d-spacing (0.32 nm) of 32. This finding contrasts with the image of AgSbTe2 matrix. Only the Ag2Te monoclinic phase has the same d-spacing size in the possible phases like Ag2Te, Sb2Te3, and AgSbTe2 in this system. Also, if the nanodots are the Sb2Te3 phase, it will be shown brightly compared to AgSbTe2 matrix in the bright field image of TEM39. The difference in the size of the nanostructures was insignificant after annealing at 673 K for 24 h, as shown in Fig. 5(c) and (d). It is well known that the nanostructures are major phonon scattering centers and lead to a reduction in the level of lattice thermal conductivity. For example, 80% of phonons in PbTe have a mean free path below 100 nm and are effectively scattered by nanostructures10. Thus, we think that the reduced κ ph of the Ce-doped samples was mainly caused by the existence of nanostructures, as nanostructured Ag2Te was not observed in the ternary compound. Furthermore, the finer crystallite sizes in the Ce-doped compound also contribute marginally to the reduction in κ ph.
Figure 5.
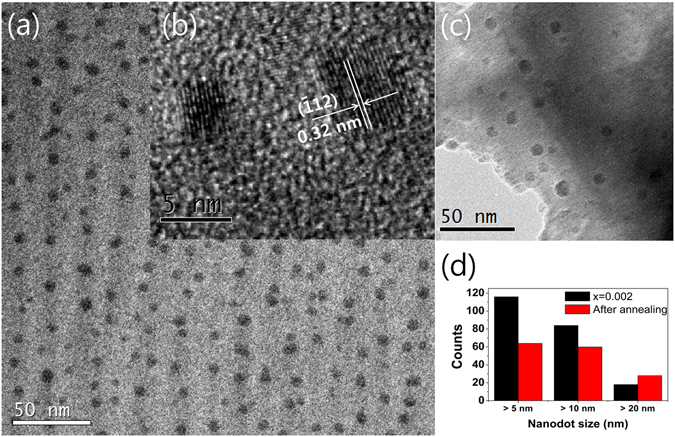
(a) Transmission electron microscopy (TEM) images of the x = 0.002 sample in AgSb1−xCexTe2, (b) magnified images of Ag2Te nanostructures, (c) TEM images after annealing at 673 K for 24 h, and (d) histogram of nanodots with respect to size.
Figure 4(d) shows the effect of temperature on ZT. The value of ZT = 0.92 at 673 K for the undoped sample is lower than the value reported in the literature (ZT = ~1.2)19, 20, 24. The measured value of κ was larger than previously reported, although the values of S and ρ were similar. We speculate that the difference is due to the use of a much higher value of Cp, although we do not know what value was used in previous studies. The maximum value of ZT was 1.5 at 673 K. This was obtained using the x = 0.002 sample. This ZT value is ~39% higher than that of the undoped sample. The thermal stability of the TE performance was analyzed after annealing at 673 K for 24 h. The ZT value was almost sustained at 1.49 at 673 K. The reductions in κ ph and ρ contributed significantly to the enhancement in ZT. The obtained ZT is as high as the highest reported values, as shown in Fig. 6, even though the report had shown very low density, from which low κ ph was obtained, and no experimental value of the specific heat capacity16, 19. It is noteworthy that the enhanced ZT value was achieved with high density (over 97%), which means AgSbTe2 has a range of possible applications.
Figure 6.
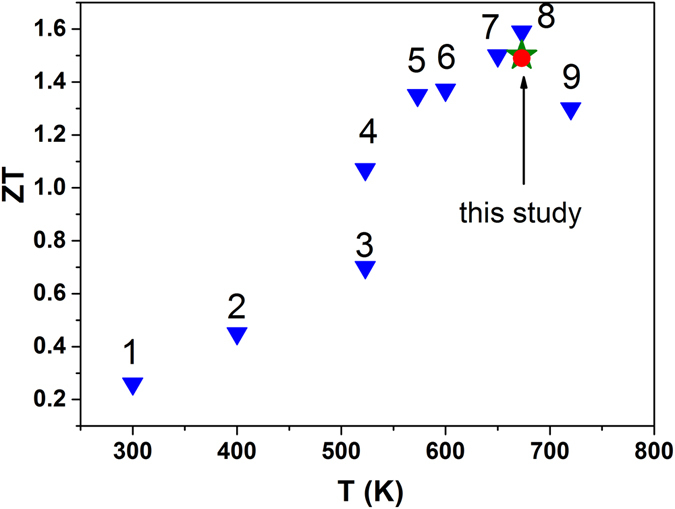
Comparison of the ZT values:Data 1~9 are from ref. 13, 40, 41, 42, 20, 17, 19, 16 and 43, respectively.
Summary
We developed Ce-doped AgSbTe2 compounds that exhibit enhanced TE performance. The addition of Ce influenced the formation of the heterophase Ag2Te in the AgSbTe2 matrix. We used a variety of methods to confirm that the proportion of Ag2Te was reduced as Ce was added. The change in the proportion of Ag2Te with the addition of Ce was thought to be responsible for the variation in the electrical and thermal properties. We obtained reduced ρ and κ values. This resulted in a particularly high ZT = 1.5 at 673 K within highly densified samples. Hence, the Ce-doped AgSbTe2 has promising practical applications. It is remarkable that both electrical and thermal properties can be optimized by controlling the proportion of heterophases, so that high ZT values can be achieved.
Method
Materials and characterization
The Ce-doped AgSbTe2 compounds were fabricated by a conventional melting, quenching, and hot-pressing method6, 17, 18. Each element (Ce, 99.9%; Ag, 99.999%, Sb, 99.999% and Te, 99.999% in purity) was weighed in a glove box with the nominal composition of AgSb1−xCexTe2 (0.001 ≤ x ≤ 0.004). The admixture of elements was directly loaded into quartz tubes and was sealed under Ar atmosphere. The sealed ampoules were heated to 1233 K for 10 h in a rocking furnace and quenched in ice water. The solidified ingots were crushed, sieved to particles of <45 μm, and sintered by hot pressing in Ar for 20 min at 683 K with a pressure of 100 MPa. The samples of 12.7 mm in diameter and about 15 mm in height were cut by a diamond wire saw and polished. The real compositions of the sintered samples were examined using inductively coupled plasma (ICP).
The phases of the Ce-doped AgSbTe2 compounds were analyzed with an X-ray diffractometer (x’pert pro, Analytical) using Cu-Kα radiation (λ = 0.15406 nm). The microstructure and local composition of the ingot were investigated by field- emission scanning electron microscopy (FE-SEM, S-4800, Hitachi) with energy dispersive X-ray spectroscopy (EDS) and field-emission transmission electron microscopy (FE-TEM, Tecnai G2 F30 S-twin, FEI) using an electron microprobe. The electrical properties were analyzed in terms of the Seebeck coefficient and resistivity measurement system (ZEM-3, ULVAC-RIKO). The thermal diffusivity was measured using the laser flash method (LFA-457, NETZSCH). The heat capacity was obtained using a differential scanning calorimeter (DSC 404 C, NETZSCH). The method of Archimedes was applied to measure the density of samples. Thermal conductivity was calculated from the density (d), heat capacity (Cp), and thermal diffusivity (a), using the equation: κ = a ∙ Cp ∙ d. The Hall effect measurement, conducted with a magnet of 0.55 T, provided information on the carrier concentration and mobility.
Acknowledgements
This work was supported by the National Research Foundation of Korea (NRF) grant funded by the Korean Government (MSIP) (NRF-2015R1A5A1036133). This work was partially supported by the Korea Institute of Energy Technology Evaluation and Planning(KETEP) and the Ministry of Trade, Industry & Energy(MOTIE) of the Republic of Korea (No. 20162000000910).
Author Contributions
S.-D.P. and B.-S.K. were responsible for project planning. J.K.L performed experiments. J.K.L. and M.-W.O. wrote the paper. B.R., J.E.L., B.K.M, S.-J.J. and H.-W.L. were involved in data analysis and reviewed the manuscript.
Competing Interests
The authors declare that they have no competing interests.
Footnotes
Publisher's note: Springer Nature remains neutral with regard to jurisdictional claims in published maps and institutional affiliations.
References
- 1.Ma J, et al. Glass-like phonon scattering from a spontaneous nanostructure in AgSbTe2. Nature nanotechnology. 2013;8:445–451. doi: 10.1038/nnano.2013.95. [DOI] [PubMed] [Google Scholar]
- 2.DiSalvo FJ. Thermoelectric cooling and power generation. Science. 1999;285:703–706. doi: 10.1126/science.285.5428.703. [DOI] [PubMed] [Google Scholar]
- 3.Son JS, et al. n-type nanostructured thermoelectric materials prepared from chemically synthesized ultrathin Bi2Te3 nanoplates. Nano Lett. 2012;12:640–647. doi: 10.1021/nl203389x. [DOI] [PubMed] [Google Scholar]
- 4.Dresselhaus MS, et al. New directions for low-dimensional thermoelectric materials. Adv. Mater. 2007;19:1043–1053. doi: 10.1002/adma.200600527. [DOI] [Google Scholar]
- 5.Hsu KF, et al. Cubic AgPbmSbTe2+m: Bulk thermoelectric materials with high figure of merit. Science. 2004;303:818–821. doi: 10.1126/science.1092963. [DOI] [PubMed] [Google Scholar]
- 6.Yang SH, et al. Nanostructures in high-performance (GeTe)x(AgSbTe2)100−x thermoelectric materials. Nanotechnology. 2008;19:245707. doi: 10.1088/0957-4484/19/24/245707. [DOI] [PubMed] [Google Scholar]
- 7.Cook BA, Kramer MJ, Wei X, Harringa JL, Levin EM. Nature of the cubic to rhombohedral structural transformation in (AgSbTe2)15(GeTe)85 thermoelectric material. J. Appl. Phys. 2007;101:053715. doi: 10.1063/1.2645675. [DOI] [Google Scholar]
- 8.Christakudis GC, Plachkova SK, Shelimova LE, Avilov ES. Thermoelectric figure of merit of some compositions in the system (GeTe)1−x[(Ag2Te)1−y(Sb2Te3)y]x. Phys. Status Solidi. A. 1991;128:465–471. doi: 10.1002/pssa.2211280223. [DOI] [Google Scholar]
- 9.Rowe, D. M. CRC Handbook of Thermoelectrics, (ed Rowe, D. M.) 267–275. (CRC Press, 1995).
- 10.Biswas K, et al. High-performance bulk thermoelectrics with all-scale hierarchical architectures. Nature. 2012;489:414–418. doi: 10.1038/nature11439. [DOI] [PubMed] [Google Scholar]
- 11.Fan S, et al. p-type Bi0.4Sb1.6Te3 nanocomposites with enhanced figure of merit. Appl. Phys. Lett. 2010;96:182104. doi: 10.1063/1.3427427. [DOI] [Google Scholar]
- 12.Cao YQ, Zhao XB, Zhu TJ, Zhang XB, Tu JP. Syntheses and thermoelectric properties of Bi2Te3/Sb2Te3 bulk nanocomposites with laminated nanostructure. Appl. Phys. Lett. 2008;92:143106. doi: 10.1063/1.2900960. [DOI] [Google Scholar]
- 13.Sharma PA, Sugar JD, Medlin DL. Influence of nanostructuring and heterogeneous nucleation on the thermoelectric figure of merit in AgSbTe2. J. Appl. Phys. 2010;107:113716. doi: 10.1063/1.3446094. [DOI] [Google Scholar]
- 14.Morelli DT, Jovovic V, Heremans JP. Intrinsically minimal thermal conductivity in cubic I-V-VI2 semiconductors. Phys. Rev. Lett. 2008;101:035901. doi: 10.1103/PhysRevLett.101.035901. [DOI] [PubMed] [Google Scholar]
- 15.Wojciechowski K, Tobola J, Schmidt M, Zybala R. Crystal structure, electronic and transport properties of AgSbSe2 and AgSbTe2. J. Phys. Chem. Solids. 2008;69:2748–2755. doi: 10.1016/j.jpcs.2008.06.148. [DOI] [Google Scholar]
- 16.Wang H, Li J-F, Zou M, Sui T. Synthesis and transport property of AgSbTe2 as a promising thermoelectric compound. Appl. Phys. Lett. 2008;93:202106. doi: 10.1063/1.3029774. [DOI] [Google Scholar]
- 17.Zhang SN, Zhu TJ, Yang SH, Yu C, Zhao XB. Phase compositions, nanoscale microstructures and thermoelectric properties in Ag2−ySbyTe1+y alloys with precipitated Sb2Te3 plates. Acta Mater. 2010;58:4160–4169. doi: 10.1016/j.actamat.2010.04.007. [DOI] [Google Scholar]
- 18.Zhang SN, Zhu TJ, Yang SH, Yu C, Zhao XB. Improved thermoelectric properties of AgSbTe2 based compounds with nanoscale Ag2Te in situ precipitates. J. Alloy. Compd. 2010;499:215–220. doi: 10.1016/j.jallcom.2010.03.170. [DOI] [Google Scholar]
- 19.Du B, Li H, Tang XF. Enhanced thermoelectric performance in Na-doped p-type nonstoichiometric AgSbTe2 compound. J. Alloy. Compd. 2011;509:2039–2043. doi: 10.1016/j.jallcom.2010.10.131. [DOI] [Google Scholar]
- 20.Du B, Li H, Xu J, Tang X, Uher C. Enhanced figure-of-merit in Se-doped p-type AgSbTe2 thermoelectric compound. Chem. Mater. 2010;22:5521–5527. doi: 10.1021/cm101503y. [DOI] [Google Scholar]
- 21.Zhang H, et al. Synthesis and thermoelectric properties of Mn-doped AgSbTe2 compounds. Chin. Phys. B. 2012;21:106101. doi: 10.1088/1674-1056/21/10/106101. [DOI] [Google Scholar]
- 22.Poudel B, et al. High-thermoelectric performance of nanostructured bismuth antimony telluride bulk alloys. Science. 2008;320:634–638. doi: 10.1126/science.1156446. [DOI] [PubMed] [Google Scholar]
- 23.Medlin DL, Snyder GJ. Interfaces in bulk thermoelectric materials: A review for current opinion in colloid and interface science. Curr. Opin. Colloid Interface Sci. 2009;14:226–235. doi: 10.1016/j.cocis.2009.05.001. [DOI] [Google Scholar]
- 24.Du B, Li H, Tang X. Effect of Ce substitution for Sb on the thermoelectric properties of AgSbTe2 compound. J. Electron. Mater. 2014;43:2384–2389. doi: 10.1007/s11664-014-3076-7. [DOI] [Google Scholar]
- 25.Ayral-Marin RM, Brun G, Maurin M, Tedenac JC. Contribution to the study of AgSbTe2. Eur. J. Solid State Inorg. Chem. 1990;27:747–757. [Google Scholar]
- 26.Quarez E, et al. Nanostructuring, compositional fluctuations, and atomic ordering in the thermoelectric materials AgPbmSbTe2+m. The myth of solid solution. J. Am. Chem. Soc. 2005;127:9177–9170. doi: 10.1021/ja051653o. [DOI] [PubMed] [Google Scholar]
- 27.Ko YH, et al. Structural studies of AgSbTe2 under pressure: Experimental and theoretical analyses. Curr. Appl. Phys. 2014;14:1538–1542. doi: 10.1016/j.cap.2014.09.004. [DOI] [Google Scholar]
- 28.Williamson GK, Hall WH. X-ray line broadening from filed aluminium and wolfram. Acta. Metall. 1953;1:22. doi: 10.1016/0001-6160(53)90006-6. [DOI] [Google Scholar]
- 29.Ragimov SS, Aliev SA. α-β phase transition of Ag2Te in the AgSbTe2 alloy of the Ag-Sb-Te system. Inorg. Mat. 2007;43:1184–1186. doi: 10.1134/S0020168507110052. [DOI] [Google Scholar]
- 30.Marin RM, Brun G, Tedenac JC. Phase equilibria in the Sb2Te3-Ag2Te system. J. Mater. Sci. 1985;20:730–735. doi: 10.1007/BF01026548. [DOI] [Google Scholar]
- 31.Majer RG. Zur Kenntnis des Systems PbTe–AgSbTe2. Zeitschrift Fur Metallkunde. 1963;54:311–312. [Google Scholar]
- 32.Sugar JD, Medlin DL. Precipitation of Ag2Te in the thermoelectric material AgSbTe2. J. Alloy Compd. 2009;478:75–82. doi: 10.1016/j.jallcom.2008.11.054. [DOI] [Google Scholar]
- 33.Barabash SV, Ozolins V, Wolverton C. First-principles theory of the coherency strain, defect energetics, and solvus boundaries in the PbTe-AgSbTe2 system. Phys. Rev. B. 2008;78:214109. doi: 10.1103/PhysRevB.78.214109. [DOI] [Google Scholar]
- 34.Allred AL. Electronegativity values from thermochemical data. J. Inorg. Nucl. Chem. 1961;17:215–221. doi: 10.1016/0022-1902(61)80142-5. [DOI] [Google Scholar]
- 35.Son JH, et al. Effect of ball milling time on the thermoelectric properties of p-type (Bi,Sb)2Te3. J. Alloy Compd. 2013;566:168–174. doi: 10.1016/j.jallcom.2013.03.062. [DOI] [Google Scholar]
- 36.Oh MW, et al. Antisite defects in n-type Bi2(Te,Se)3: Experimental and theoretical studies. J. Appl. Phys. 2014;115:133706. doi: 10.1063/1.4870818. [DOI] [Google Scholar]
- 37.Xu J, et al. High thermoelectric figure of merit and nanostructuring in bulk AgSbTe2. J. Mater. Chem. 2010;20:6138–6143. doi: 10.1039/c0jm00138d. [DOI] [Google Scholar]
- 38.May AF, Fleurial JP, Snyder GJ. Thermoelectric performance of lanthanum telluride produced via mechanical alloying. Phys. Rev. B. 2008;78:125205. doi: 10.1103/PhysRevB.78.125205. [DOI] [Google Scholar]
- 39.Medlin DL, Sugar JD. Interfacial defect structure at Sb2Te3 precipitates in the thermoelectric compound AgSbTe2. Scripta Materialia. 2010;62:379–382. doi: 10.1016/j.scriptamat.2009.11.028. [DOI] [Google Scholar]
- 40.Jovovic V, Heremans JP. Measurements of the energy band gap and valence band structure of AgSbTe2. Phys. Rev. B. 2008;77:245204. doi: 10.1103/PhysRevB.77.245204. [DOI] [Google Scholar]
- 41.Wojciechowski KT, Schmidt M. Structural and thermoelectric properties of AgSbTe2-AgSbSe2 pseudobinary system. Phys. Rev. B. 2009;79:184202. doi: 10.1103/PhysRevB.79.184202. [DOI] [Google Scholar]
- 42.Su T, et al. Enhanced thermoelectric performance of AgSbTe2 synthesized by high pressure and high temperature. Appl. Phys. Lett. 2009;105:073713. [Google Scholar]
- 43.Wood C. Materials for thermoelectric energy conversion. Rep. Prog. Phys. 1988;51:459–539. doi: 10.1088/0034-4885/51/4/001. [DOI] [Google Scholar]


