

Abstract
Despite the effects of insulinopenia in type 1 diabetes and evidence that insulin stimulates multiple renal sodium transporters, it is not known whether normal variation in plasma insulin regulates sodium homeostasis physiologically. This study tested whether the normal postprandial increase in plasma insulin significantly attenuates renal sodium and volume losses. Rats were instrumented with chronic artery and vein catheters, housed in metabolic cages, and connected to hydraulic swivels. Measurements of urine volume and sodium excretion (UNaV) over 24 h and the 4-h postprandial period were made in control (C) rats and insulin-clamped (IC) rats in which the postprandial increase in insulin was prevented. Twenty-four-hour urine volume (36 ± 3 vs. 15 ± 2 ml/day) and UNaV (3.0 ± 0.2 vs. 2.5 ± 0.2 mmol/day) were greater in the IC compared with C rats, respectively. Four hours after rats were given a gel meal, blood glucose and urine volume were greater in IC rats, but UNaV decreased. To simulate a meal while controlling blood glucose, C and IC rats received a glucose bolus that yielded peak increases in blood glucose that were not different between groups. Urine volume (9.7 ± 0.7 vs. 6.0 ± 0.8 ml/4 h) and UNaV (0.50 ± 0.08 vs. 0.20 ± 0.06 mmol/4 h) were greater in the IC vs. C rats, respectively, over the 4-h test. These data demonstrate that the normal increase in circulating insulin in response to hyperglycemia may be required to prevent excessive renal sodium and volume losses and suggest that insulin may be a physiological regulator of sodium balance.
Keywords: insulin, sodium excretion, postprandial, urine volume
insulin is well-documented to stimulate sodium transport at sites all along the nephron. However, the physiological significance of this effect is relatively unknown. Insulin-stimulated sodium chloride transport has been demonstrated in the renal proximal tubule (16, 33), loop of Henle (24), distal convoluted tubule (38), and cortical collecting duct (15, 41, 47, 48). It has been shown to activate several renal sodium transport mechanisms, including the epithelial Na+ channel (ENaC; Refs. 6, 13, 27, 34, 41), the Na+-Cl− cotransporter (NCC; Ref. 25), and the Na+-K+-ATPase (15). However, current understanding basically is limited to the pathology defined by type 1 diabetes: if insulin is absent, renal sodium excretion increases dramatically, and when insulin is replaced, the sodium loss is reversed. It is an all-or-none relationship that ascribes only pathological significance to the sodium transport effects of insulin.
Because circulating glucose controls the release of insulin, the hormone levels vary throughout the day, especially with meals (21, 23). The postprandial increase in circulating insulin is critical for disposing of glucose and is known to control many aspects of intermediary metabolism. How these normal variations in circulating insulin modulate Na+ homeostasis remains largely undefined. Chronic hyperinsulinemia has been hypothesized to contribute to hypertension in obesity and type 2 diabetes through sodium-retaining actions (11). However, blood pressure data in human patients with insulinoma (37, 44) and dogs with chronic insulin infusion (10, 18, 19) are not consistent with this hypothesis and do not address whether the normal variation in plasma insulin levels throughout the day significantly affects renal sodium excretion.
The association of insulin with meals has led to hypotheses that insulin may influence postprandial sodium excretion (2, 42), but that has not been tested experimentally. This study tested the hypothesis that the normal, postprandial increase in plasma insulin is important to prevent excessive urinary losses of salt and volume. If true, this would reveal a new physiological role for insulin as part of the integrated control system that regulates sodium homeostasis. This hypothesis was tested by comparing the urine sodium and volume excretion responses to meals in control rats vs. rats that were prevented from increasing plasma insulin above basal levels following a meal.
METHODS
All animal studies were approved by the Institutional Animal Care and Use Committee of Augusta University. Male Sprague-Dawley rats (350–400 g), purchased from Envigo (Madison, WI), were instrumented with abdominal aortic and femoral vein catheters using aseptic technique as described previously (3, 7–9). The catheters were exteriorized at the scapulae through a stainless steel button to which a 12-in. stainless steel spring was attached. The rats were housed in metabolic cages, and the spring was attached to a dual-channel Instech hydraulic swivel that enabled 24 h/day iv infusion and undisturbed arterial blood sampling from the conscious rats as described previously (3, 7–9). Rats were maintained in a temperature- and light-controlled environment with a 12:12-h day-night cycle. Rats had ad libitum access to food and water except when indicated in the experimental protocols and were allowed at least 5 days for recovery from surgery and acclimation to the metabolic cages before the insulin clamp or control measurements were begun. Rats were maintained on normal sodium intake by feeding a sodium-deficient diet (Teklad CA.170950; Envigo, Madison, WI) and infusing saline 24 h/day iv to deliver 2.5 mmol Na+/day as described previously (3, 7–9). The continuous intravenous saline infusion also served as the vehicle for administering insulin to the rats with the insulin clamp.
Insulin Clamp
The chronic insulin clamp was designed to prevent circulating insulin levels from increasing in response to meals while not completely eliminating insulin and creating overt type 1 diabetes. Rats were divided randomly into control (C; n = 18) and insulin-clamped (IC; n = 15) groups and randomly subdivided to have either the postprandial or glucose bolus experiment come first because only eight rats were able to complete both procedures. Plasma insulin was clamped chronically in the IC period by first administering streptozotocin in sodium citrate buffer (STZ; 70 mg/kg iv) to impair endogenous insulin production. We (7) have shown previously that STZ does not affect glomerular filtration rate (GFR), renal plasma flow, or mean arterial pressure over the time frame of this study. After hyperglycemia was confirmed to be at least 300 mg/dl (all rats achieved this by day 2 after STZ, averaging 402 ± 27 mg/dl), 24 h/day iv insulin replacement was begun by adding insulin (porcine; Wockhardt, Wrexham, UK) to the daily intravenous saline infusion. Arterial blood glucose was measured every morning from the chronically implanted arterial catheter in every rat, and those data were used to determine the insulin dose needed each day to keep each IC rat at the desired blood glucose level. The time required for rats to achieve stable glycemic control was variable, ranging on average between 5 and 7 days. Once control was achieved, the experimental protocols were begun. Control rats received only vehicle.
The initial goal of the IC clamp was to maintain fasting blood glucose in the normal range. However, pilot studies revealed that if insulin replacement doses were set so that fasting blood glucose in the IC rats matched that in the C rats, daily urine volume was approximately three to four times greater. Therefore, insulin replacement doses were raised so that fasting blood glucose was lower in IC than C rats, in the hope of better matching baseline regulation of salt and water balance between groups. The insulin dose that maintained glucose control in these IC rats averaged 2.8 ± 0.3 U/day. Based on the plasma insulin data, part of the experiment was repeated in a different group of rats using a lower IC insulin dose that averaged 1.6 ± 0.1 U/day. The primary group of IC rats is referred to as IC + high insulin dosing (IC-High), and the follow-up group is referred to as IC + low insulin dosing (IC-Low).
Experimental Protocols
Twenty-four hour assessment.
A 24-h urine collection was made in C and IC-High rats under steady-state conditions and ad libitum access to food and water. At the end of the 24-h period, at ~10:00 AM and after food had been withdrawn for 2 h, an arterial blood sample was drawn for measurement of blood glucose, plasma insulin, plasma renin activity (PRA), and GFR.
Postprandial.
Our hypothesis was that overnight meals would cause natriuresis and diuresis in IC-High rats that could not increase insulin in response to the meal, but there was no measure of the response to individual meals during ad libitum eating in the active nocturnal phase of the 24-h period. Therefore, an acute postprandial experiment was run to measure the direct response to a meal. Approximately 5 days after previous measurements and blood sampling, rats were fasted 12 h overnight to encourage rapid consumption of a morning meal. At ~8:00 AM the next day, each rat was given 11 g of the veterinary supplement, Supplical (Butler Schein, Dublin, OH), which is a gel formulation that was used to facilitate rapid consumption. It is primarily a carbohydrate mixture (malt and corn syrups) with only 0.8% protein. This marked time 0 of a 4-h postprandial urine collection. At the 2-h mark, the food was removed and a blood sample was drawn to measure blood glucose, plasma insulin, and plasma renin activity.
Glucose bolus.
Because of the difficulty in matching Supplical intake and variation in blood glucose between groups during the acute meal, bolus glucose administration was used to simulate a meal with precise blood glucose matching. This experiment was performed ~5 days after previous measurements and blood sampling. Food was removed from all rats at ~8:00 AM. Four hours later, a blood sample was taken to measure blood glucose. Then, rats were injected with a glucose bolus (1 g/kg, C and 0.45 g/kg, IC-High). These doses were determined in pilot studies to yield peak blood glucose levels that were not different between the C and IC-High groups, and the glucose was injected via the abdominal aortic catheter so as not to interfere with the continuous intravenous insulin clamp infusion. This marked time 0 of a 4-h urine collection. Blood glucose was measured immediately after injection and then at 5, 10, 20, 30, 40, and 50 min. Plasma insulin was measured at t = 5 min. Because of this repeated blood sampling, PRA was not measured in this protocol. Additional glucose boluses, at the same dose, were given at 1, 2, and 3 h, to ensure a significant increase in urine output over the 4-h period.
Analysis of Samples
Urine and blood glucose concentrations were measured with an Accu-Chek Active glucose meter (Roche, New York, NY). Electrolyte concentrations were measured by atomic absorption (PerkinElmer, Shelton, OH). Plasma insulin concentration was measured by ELISA (SPI-Bio, Bertin Pharma, Montigny-le-Bretonneux, France). PRA was measured by radioimmunoassay (DiaSorin, Stillwater, MN). GFR was measured by [125I]iothalamate clearance (Glofil; Iso-Tex Diagnostics, Friendswood, TX) after 24-h intravenous infusion to reach steady state (4, 7–9). Because this method requires plasma [125I]iothalamate to be stable, GFR could not be measured during the postprandial or glucose bolus experiments.
Statistics
Results are presented as means ± SE. All data were graphed using GraphPad Prism software. Student's t-tests for unpaired groups comparing C with IC rats were performed. Comparison of plasma insulin under the different conditions was made using ANOVA. A probability value <0.05 was considered to be significant.
RESULTS
Twenty-Four-Hour Assessment
The rats that were not able to increase plasma insulin (IC-High) had significantly greater urine volume (36 ± 3 vs. 15 ± 2 ml/day) and sodium excretion (3.0 ± 0.2 vs. 2.5 ± 0.2 mmol/day) than the C rats over the 24-h period (Fig. 1, A and B). GFR and PRA, measured after the 24-h collection following a 2-h fast, were not different between groups (Table 1). Fractional excretion of sodium, calculated from the 24-h urine collection and the 2-h fasted GFR, also was not different, averaging 0.44 ± 0.04 vs. 0.49 ± 0.04% in C vs. IC-High. The IC-High rats had significantly greater water (29 ± 3 vs. 6 ± 2 ml) and food (25 ± 2 vs. 16 ± 1 g) intakes than the C rats, respectively. The food was not the source of the increased sodium excretion, however, because sodium intake was clamped at normal in both groups by feeding a sodium-deficient diet and infusing 0.9% saline iv 24 h/day to maintain the same sodium intake in both groups. Uncontrolled diabetes also did not explain the diuretic and natriuretic responses in the IC-High rats because fasting blood glucose trended lower in the IC-High vs. C rats (88 ± 21 vs. 130 ± 4 mg/dl, respectively; not significant; Fig. 1C). Thus the diuresis and natriuresis were independent of an increase in fasting blood glucose. Urinary potassium excretion was not measured because the rat chow contained potassium and our caging system with the infusion swivels cannot completely prevent food electrolytes from contaminating the urine. There were no differences in plasma sodium or potassium concentrations between IC-High and C groups (Table 1).
Fig. 1.
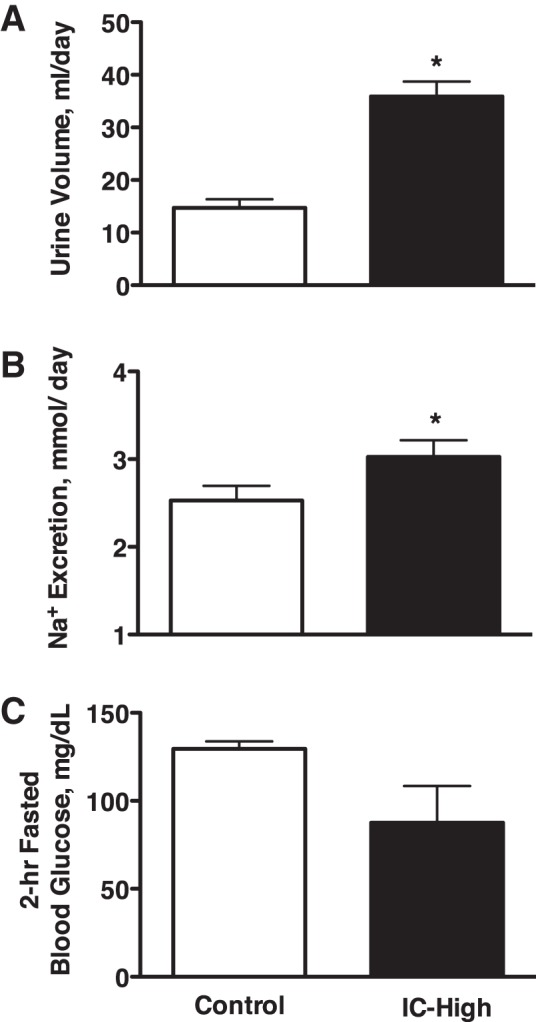
Urine volume (A) and urinary sodium excretion (B) in Control and insulin-clamped (IC-High) rats over a 24-h period with ad libitum access to food and water and fasting blood glucose levels (C) after a 2-h fast at the end of the 24-h period. n = 10–11 Rats per group; *P < 0.05 vs. control.
Table 1.
Metabolic, hormonal, and GFR data for control and insulin-clamped rats
| 2-h Fasted |
2-h Meal |
5-min Glucose Bolus |
||||
|---|---|---|---|---|---|---|
| C | IC-High | C | IC-High | C | IC-High | |
| Body wt, g | 383 ± 4 | 379 ± 4 | N/A | N/A | N/A | N/A |
| Food intake, g/day or g/4 h | 16 ± 1 | 25 ± 2* | 6.2 ± 0.5 | 6.1 ± 1.2 | N/A | N/A |
| Water consumption, ml/day or ml/4 h | 6 ± 2 | 29 ± 3* | 4 ± 1 | 4 ± 1 | N/A | N/A |
| Urinary antidiuretic hormone excretion, pg/h | N/A | N/A | 126.9 ± 22.9 | 76.8 ± 9.3* | 79.6 ± 16.6 | 123.7 ± 21.2 |
| Plasma Na, mmol/l | 138.1 ± 2.8 | 138.0 ± 1.2 | 136.0 ± 1.9 | 137.0 ± 1.4 | 140.1 ± 1.3 | 144.4 ± 1.9 |
| Plasma K, mmol/l | 4.9 ± 0.4 | 4.6 ± 0.1 | 4.6 ± 0.1 | 4.8 ± 0.2 | 5.9 ± 0.3 | 5.4 ± 0.4 |
| GFR, ml/min | 3.1 ± 0.3 | 3.2 ± 0.1 | N/A | N/A | N/A | N/A |
| PRA, ng ANG I·ml−1·h−1 | 1.72 ± 0.42 | 1.70 ± 0.43 | 1.22 ± 0.37 | 0.90 ± 0.51 | N/A | N/A |
Values are means ± SE.2-h Fasted data were collected at the end of, or over, a 24-h period. 2-h Meal and 5-min Glucose Bolus data were collected during each respective acute test. C, control rats; IC-High, insulin-clamped rats; Na, sodium; K, potassium; GFR, glomerular filtration rate; PRA, plasma renin activity; ANG I, angiotensin I; N/A, not applicable.
P < 0.05.
Postprandial
Fasted IC-High and C rats consumed 6.1 ± 1.2 and 6.2 ± 0.5 g of the gel diet, respectively. Similar to the 24-h response (Fig. 1A), urine volume over the 4-h postprandial measurement period was significantly greater in the IC-High compared with the C rats (4.5 ± 0.9 vs. 2.7 ± 0.2 ml, respectively; Fig. 2A). Water intake was not different, averaging 3.6 ± 0.8 and 3.8 ± 0.9 ml in IC-High and C rats, respectively, over the 4-h period. However, urinary sodium excretion was significantly lower during the postprandial period in the IC-High vs. C rats (Fig. 2B), which was opposite the response measured over 24 h (Fig. 1B). Blood glucose concentration was greater in the IC-High vs. C rats (Fig. 2C), and urine glucose excretion was significantly greater in the IC-High rats (4 ± 1 μg/min) vs. C rats (no glucose detectable in the urine). Urinary antidiuretic hormone (ADH) secretion was significantly lower in IC-High vs. C rats, and PRA, plasma sodium concentration, and plasma potassium concentration were not different between groups (Table 1).
Fig. 2.
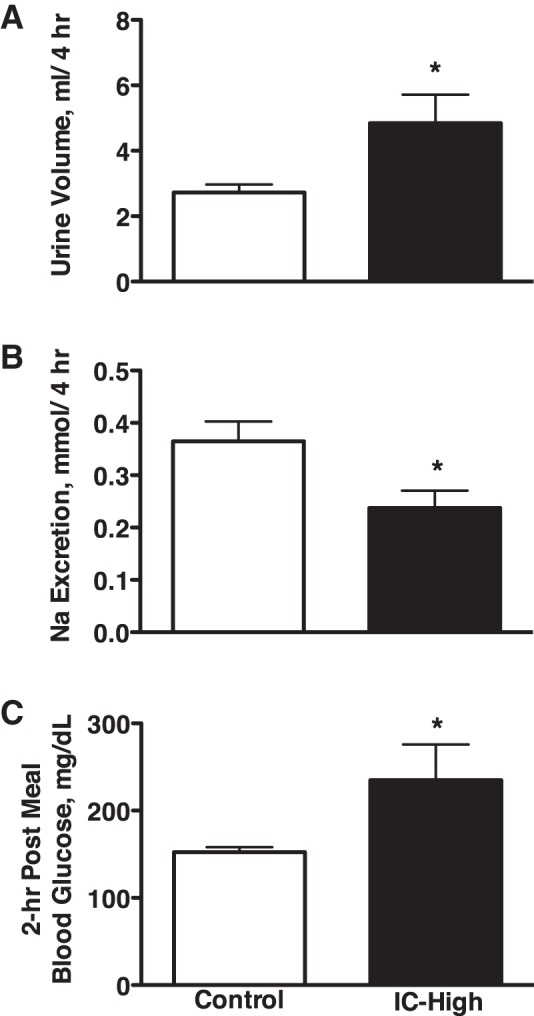
Urine volume (A) and urinary sodium excretion (B) in Control and insulin-clamped (IC-High) rats over a 4-h postprandial period and blood glucose levels (C) 2 h after feeding the gel meal. n = 11–12 Rats per group; *P < 0.05 vs. control.
Glucose Bolus
Figure 3A shows that peak blood glucose responses were not different between the IC-High and C rats in response to the bolus glucose injections. Under these conditions, urine volume and urinary sodium excretion both were significantly greater over the 4-h period in the rats that could not increase plasma insulin from baseline (IC-High) vs. C rats (Fig. 3, B and C). Because there was no possibility for food to contaminate the urine in this experiment, urinary potassium excretion was measured. It averaged 0.20 ± 0.02 vs. 0.23 ± 0.03 mmol over the 4-h period in IC-High vs. C rats, respectively, and was not different. Urinary ADH secretion was significantly greater in IC-High vs. C rats, and plasma sodium and potassium concentrations were not different between groups (Table 1).
Fig. 3.
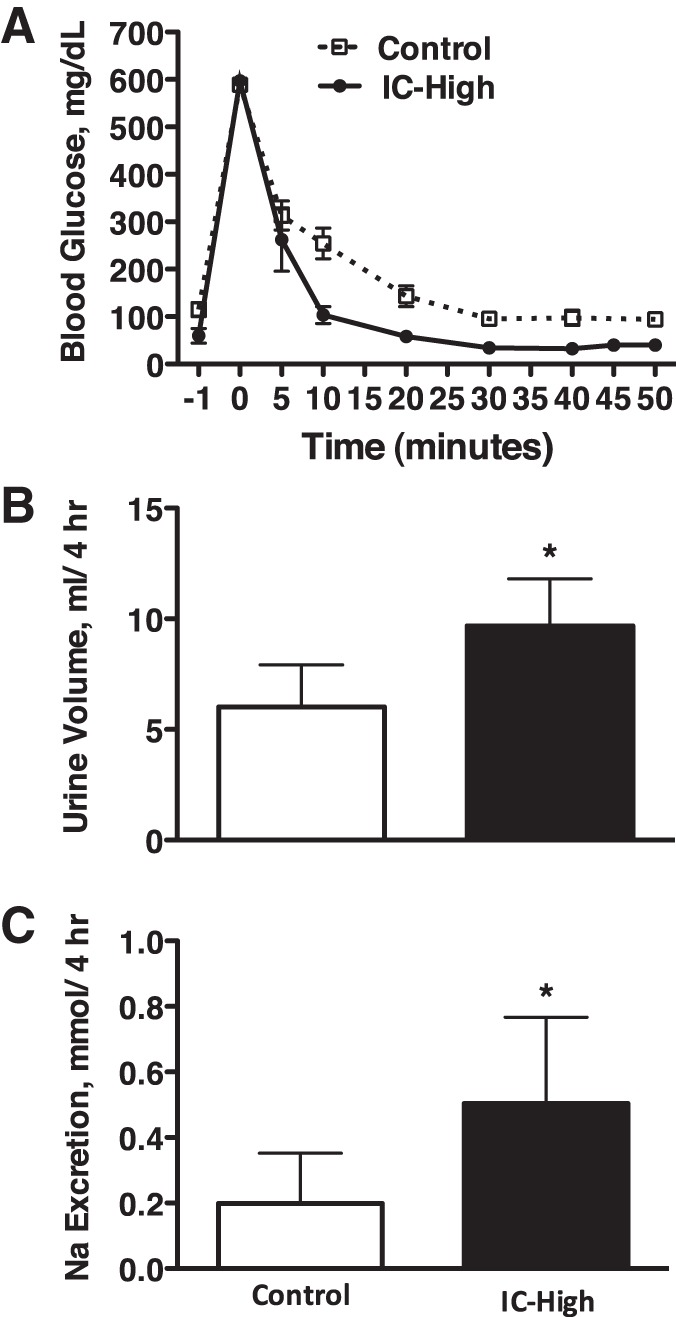
Blood glucose levels (A), urine volume (B), and urinary sodium excretion (C) in Control and insulin-clamped (IC-High) rats over a 4-h period after bolus glucose injection. n = 6–10 Rats per group; *P < 0.05 vs. control.
Plasma Insulin
Figure 4 shows plasma insulin concentration in C and IC-High rats under the three experimental conditions. In the C rats, the gel diet increased plasma insulin above fasting levels, and there was a substantially greater insulin response to the glucose bolus. Because we did not measure the plasma insulin response to STZ alone, i.e., before the insulin clamp began, it cannot be guaranteed that all IC-High rats had no postprandial or postglucose endogenous release of insulin. However, plasma insulin levels in the IC-High rats 2 h after the gel diet and 5 min after glucose bolus did not rise above that of 2-h fasting levels, suggesting the IC-High procedure was effective in preventing endogenous insulin release. Fasting plasma insulin concentration in the IC-High rats was not significantly greater than in the C rats by ANOVA. However, Fig. 4 clearly shows a tendency for it to be greater. This likely was because of the high insulin replacement doses used to prevent markedly elevated urine volumes in the IC-High rats, as described in the insulin clamp procedure above. This insulin replacement dose resulted in lower fasting blood glucose in the IC-High vs. the C group (Fig. 1) and 24-h urine volume that was only approximately twofold greater (Fig. 1) in the IC-High group.
Fig. 4.
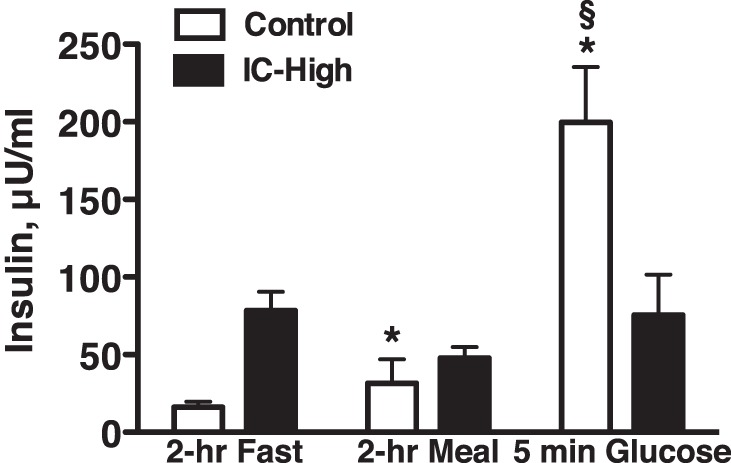
Plasma insulin levels in Control and insulin-clamped (IC-High) rats after a 2-h morning fast, 2 h after a gel meal, and 5 min after bolus glucose injection (Glucose). n = 6–11 Rats per group; *P < 0.05 vs. fasted Control, §P < 0.05 vs. fasted insulin-clamped.
Low Insulin Dosing IC Group
To test whether this insulin replacement dosing regimen and high fasting plasma insulin levels in the IC-High rats (Fig. 4) could have played a role in their unexpectedly lower sodium excretion response to the gel diet (Fig. 2), an additional group of rats (n = 6) was run under both C and IC conditions, using lower insulin replacement dosing during the insulin clamp. These rats were instrumented similarly, and this essentially repeated the experiment shown in Fig. 1 but with lower insulin dosing for the insulin clamp (1.6 ± 0.1 vs. 2.8 ± 0.3 U/day). Fasting plasma insulin during IC + low insulin dosing indeed was lower, averaging 22 ± 5 microunits (μU)/ml compared with the fasted plasma levels of 78 ± 12 μU/ml in the IC-High group as shown in Fig. 4 (IC group, 2-h fast). Fasting plasma insulin under control conditions averaged 10 ± 4 μU/ml in these rats, similar to the 16 ± 4 μU/ml in the C group in Fig. 4. Blood glucose in IC-Low rats no longer was lower than control levels (Fig. 5C) and actually was significantly higher than control. Figure 5, A and B, shows the renal response in these rats over a 24-h period. Consistent with our pilot studies, urine volume was approximately three times greater during IC-Low (91 ± 10 ml for IC-Low in Fig. 5 vs. 36 ± 3 ml for IC-High in Fig. 1). However, despite these differences, 24-h urinary sodium excretion was significantly greater during IC-Low vs. control (Fig. 5), similar to the response shown in Fig. 1 for IC-High. Figure 6 shows the response to the acute gel-feeding experiment in these rats. Again, similar to the response shown for the IC-High group in Fig. 2, the IC-Low rats had greater urine volume and lesser sodium excretion responses to the acute gel feeding. Thus the insulin dosing levels used to induce the insulin clamp did not appear to explain either the 24-h or immediate postprandial renal sodium excretion responses.
Fig. 5.
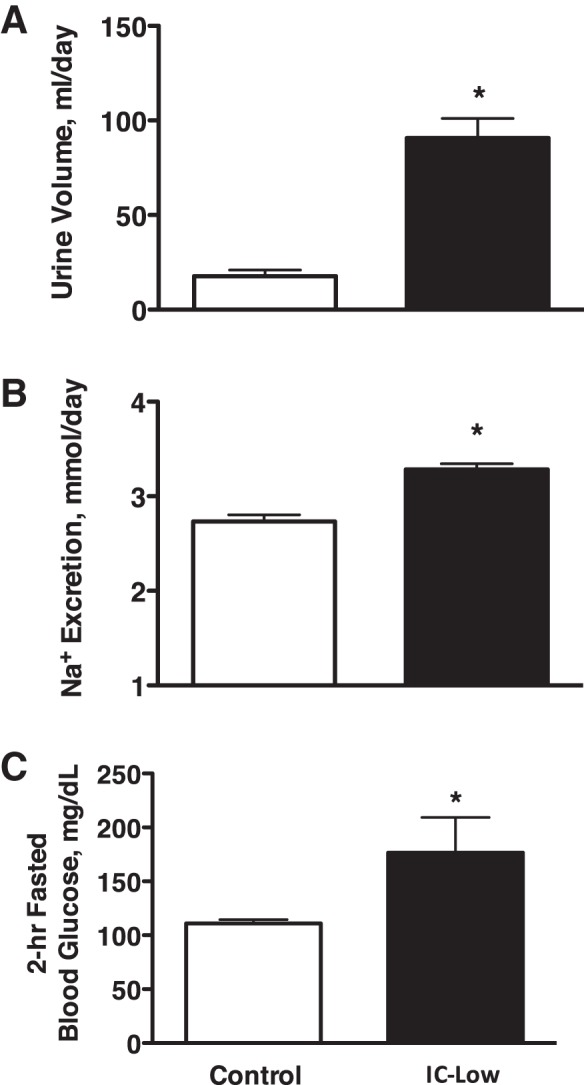
Urine volume (A) and urinary sodium excretion (B) in Control and lower insulin-clamped IC rats (IC-Low) over a 24-h period with ad libitum access to food and water and fasting blood glucose levels (C) after a 2-h fast at the end of the 24-h period. n = 6 Rats per group; *P < 0.05 vs. control.
Fig. 6.
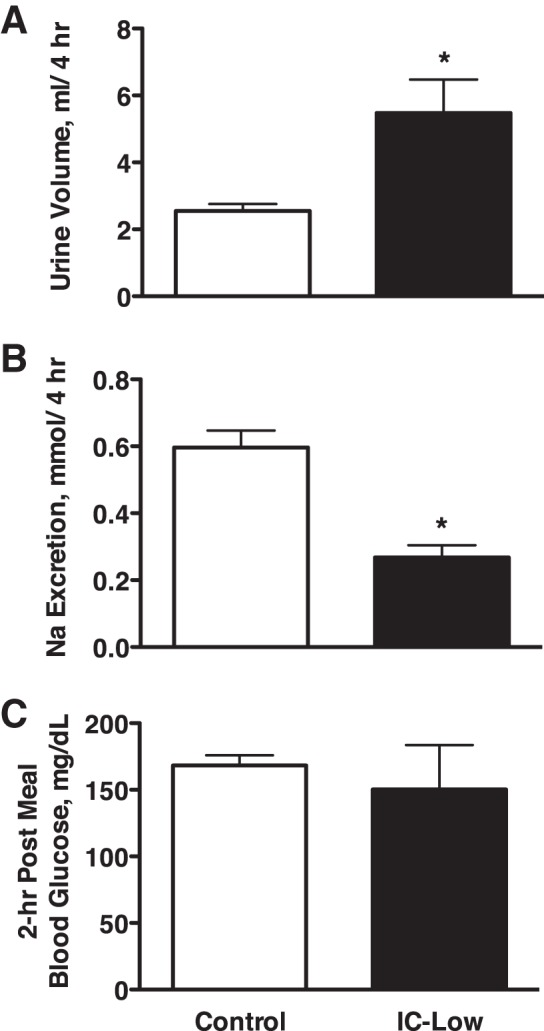
Urine volume (A) and urinary sodium excretion (B) in Control and lower insulin-clamped IC rats (IC-Low) over a 4-h postprandial period and blood glucose levels (C) 2 h after feeding the gel meal. n = 4–6 Rats per group; *P < 0.05 vs. control.
DISCUSSION
The main finding of this study is that rats that were prevented from raising plasma insulin levels had significantly greater urine volume and urinary sodium excretion than control rats over 24 h of ad libitum eating. A high carbohydrate meal replicated the diuretic response but not the natriuretic response. However, an injected glucose bolus that matched peak glucose levels between groups caused significantly greater urine volume and over twofold greater urinary sodium excretion over a 4-h period. These data demonstrate that the normal increase in circulating insulin in response to hyperglycemia is required to prevent excessive renal sodium and volume losses and suggest that insulin may be a physiological regulator of sodium balance.
Because there is a considerable volume of literature demonstrating significant effects of insulin to increase sodium reabsorption at multiple nephron sites (15, 16, 24, 33, 38, 41, 47, 48) via stimulation of a variety of sodium transporters (6, 13, 15, 25, 27, 34, 41), it could be argued that insulin already is known to be a physiological regulator of sodium balance. However, that conclusion is a priori because it is inference based primarily on what is known about insulin from type 1 diabetes. Although type 1 diabetes indeed identified a requirement for insulin to prevent life-threatening natriuresis and diuresis, it simply documents that insulin must be present. The effects of insulin loss and replacement on renal excretion in type 1 diabetes do not quantify the independent roles of insulin vs. glucose and do not address the potential physiological role of the normal daily variation of plasma insulin on renal sodium excretion.
Regarding the independent roles of low insulin vs. high glucose in causing the natriuresis and diuresis in type 1 diabetes, it is conventionally accepted that these effects are due to the hyperglycemia, i.e., to an osmotic diuretic effect of glucose. DeFronzo (11) hypothesized in 1981 that the natriuresis and diuresis in type 1 diabetes could be due, at least in part, to the decrease in insulin and its sodium-retaining action, but that hypothesis had not been tested directly until recently. We (28) demonstrated, in dogs with type 1 diabetes, that 6 days of sustained hyperglycemia (~400 mg/dl) did not cause sustained natriuresis and diuresis unless plasma insulin decreased below normal levels. Thus the decrease in insulin, rather than the hyperglycemia, was the cause of the sustained natriuresis and diuresis, suggesting that baseline insulin exerted a powerful sodium-retaining effect. A subsequent study from our laboratory (29) showed that this was due to direct renal actions of insulin.
However, those studies did not address whether normal, daily variation in plasma insulin levels have a significant influence on renal sodium handling. Insulin has been hypothesized to influence postprandial sodium excretion (2, 42), but that has not been tested experimentally. In the present study, we controlled the insulin response to meals to test directly the role of daily variations in insulin on renal sodium excretion. Insulin is known to increase in response to a mixed meal and can be stimulated by the protein and lipid components in addition to carbohydrates (23). The normal insulin clamp developed for this study (IC rats) was effective in preventing meals and bolus glucose administration from increasing plasma insulin above fasting levels. Over a 24-h period, this caused significantly greater urinary sodium excretion and urine volume in the IC vs. C rats. Our hypothesis ascribes this effect to the failure of insulin to increase after meals in the IC rats, but Fig. 4 shows that fasting plasma insulin was higher in the IC rats than in the C rats (24-h data are fasting levels). Ecelbarger's laboratory (43) reported that distal nephron insulin receptors promote NO-mediated natriuresis. Thus one explanation for the natriuresis and diuresis in the IC rats over 24 h could have been activation of this mechanism by the fasting hyperinsulinemia. However, the data from our IC + low insulin dosing group argue against that explanation.
Pilot studies showed that if the insulin replacement dose was set to keep fasting blood glucose in the IC rats comparable with that in the C rats, then daily urine volume was three- to fourfold elevated. Therefore, insulin-clamp dosing in the IC rats was increased to yield a slight fasting hypoglycemia (Fig. 1C). Figure 1, A and B, shows that these IC-High rats still had twofold greater urine volume and significantly greater sodium excretion over 24 h. To determine whether the high insulin dosing for the insulin clamp in these rats affected our results, an additional group of rats was run in which the insulin-clamp dosing was lowered (IC-Low). The insulin-clamp dose in this group averaged almost 50% lower, and plasma insulin averaged ~70% lower, than the IC-High group shown in Fig. 1. The results (Fig. 5) show the markedly elevated 24-h urine volumes but the still significantly elevated urinary sodium excretion. Thus the natriuretic response over 24 h of insulin clamp was not affected by changing the insulin-clamp insulin dose, therefore not supporting the possibility that high insulin dosing caused the increase in 24-h sodium excretion.
The renal excretory response to a single meal was used to determine whether the 24-h natriuretic and diuretic responses were due to the effects of meals during overnight ad libitum eating. The diuretic response to the gel diet in the IC vs. C rats mirrored the 24-h response. Unexpectedly, however, urinary sodium excretion was lower in IC rats, opposite from the 24-h response. The IC-Low rats were added to test whether the renal response to the meal was influenced by the insulin dose used to establish the insulin clamp. The results do not support that because the data in Fig. 6 compared against Fig. 2 show that the sodium excretion response to the meal was not altered. The facts that the gel diet did not match the macronutrient content of the daily rat chow, that the meal came after an overnight fast, and that blood glucose was different between IC and C rats after the gel meal all could have affected the results and will need to be addressed in future studies.
The glucose bolus experiment was designed to simulate a meal while allowing us to control directly the rise in blood glucose between groups. Figure 3 shows that the peak hyperglycemic responses were not different between the two groups. Subsequent blood glucose levels tended to be lower in the IC rats over the rest of the postinfusion time period, possibly because they required a 50% lower glucose dose to achieve the same peak increase in blood glucose as the C rats. Thus there was no evidence for a greater blood glucose level in the IC rats after a bolus glucose load, yet the IC rats excreted approximately twice as much sodium and volume over 4 h than the C rats. The fact that the gel diet increased urine volume but lowered sodium excretion in the IC rats, whereas both urine volume and sodium excretion increased after the glucose bolus, provides evidence that the sodium excretion response to the glucose bolus was not a consequence of increased urine volume. The regulation of urine volume under these conditions is unclear. Table 1 shows that antidiuretic hormone (ADH) levels were greater in the IC rats, suggesting that ADH did not contribute to the diuretic response to the glucose bolus. However, ADH was lower after the gel meal in the IC rats, which also had a diuretic response. Therefore, further studies will be needed to determine to what extent ADH may have contributed to these results.
These results showed that hyperglycemia-induced natriuresis and diuresis were significantly greater if the glucose-induced hyperinsulinemia was prevented. We hypothesize that this was due to loss of the antinatriuretic effect of insulin that normally would have occurred if it had been allowed to increase. We hypothesize further that this explains the greater 24-h sodium excretion in the IC rats, but we will need a different approach than the gel diet to link the 24-h response more directly to postprandial antinatriuretic effects of insulin. The mechanism for the antinatriuretic action is not known. All manipulations of insulin in this study were of circulating insulin, so it is possible that central actions on the sympathetic nervous system could be involved (26, 31, 40). However, we recently used chronic, renal artery insulin infusion in dogs with type 1 diabetes to show that the sustained effects of circulating insulin on renal sodium and volume excretion (28) were due to intrarenal actions of insulin (29). As discussed above, there are multiple sites along the nephron where insulin has been shown to act, but this study was not designed to probe that aspect of insulin action. Interestingly, however, because the sodium-retaining effect of intrarenal insulin infusion was measured in diabetic (29) but not normal (18, 29) dogs, this suggested that some renal interaction between glucose and insulin might be involved. It will be interesting in that regard for future studies to test whether insulin action on SGLT2 (16) might augment the stimulatory effects of glucose or whether glucose can modulate the well-known effect of insulin on ENaC (6, 22, 41) in the postprandial period.
Perspectives and Significance
There has long been fascination with the ability of the body to achieve sodium balance rapidly, and the focus has been predominantly on excretion of a salt load. The reason for that focus is not known but could be based on the need to facilitate renal excretion of salt in pathological states such as hypertension and heart failure. Regardless, the literature is dominated by the study of natriuretic influences following a meal. The ability to eliminate an acute salt load has been attributed to many factors, such as withdrawal of the renin-angiotensin-aldosterone system (5, 36), increased natriuretic peptide (12, 39, 46), withdrawal of renal sympathetic nerve activity (32, 35), hemodynamic factors (20), and gut-derived hormones such as glucagon-like peptide (GLP-1; Ref. 17), amylin, secretin, vasoactive intestinal peptide, glucagon, and uroguanylin (14, 30, 45). However, salt is a precious commodity that has been scarce during human evolution (1), yet there is little evidence for meal-induced hormones that function to conserve the salt in a meal by limiting its elimination by the kidneys. Our data suggest this is a physiological function of insulin, thus possibly warranting placement of insulin alongside the many other neural, hormonal, and hemodynamic factors already known to be important components of the control system for normal salt and volume homeostasis.
GRANTS
This work was supported by National Heart, Lung, and Blood Institute Grant HL-56259.
DISCLOSURES
No conflicts of interest, financial or otherwise, are declared by the authors.
AUTHOR CONTRIBUTIONS
M.W.B. conceived and designed research; D.L.I. performed experiments; D.L.I. analyzed data; D.L.I. prepared figures; D.L.I. and M.W.B. drafted manuscript; D.L.I., B.L.B.-Y., A.S., and M.W.B. edited and revised manuscript; D.L.I., B.L.B.-Y., A.S., and M.W.B. approved final version of manuscript.
ACKNOWLEDGMENTS
We thank Ashley Washington and Rabei Alaisami for technical assistance with this project.
REFERENCES
- 1.Batuman V. Salt and hypertension: why is there still a debate? Kidney Int Suppl (2011) 3: 316–320, 2013. doi: 10.1038/kisup.2013.66. [DOI] [PMC free article] [PubMed] [Google Scholar]
- 2.Baum M. Insulin stimulates volume absorption in the rabbit proximal convoluted tubule. J Clin Invest 79: 1104–1109, 1987. doi: 10.1172/JCI112925. [DOI] [PMC free article] [PubMed] [Google Scholar]
- 3.Bell TD, DiBona GF, Wang Y, Brands MW. Mechanisms for renal blood flow control early in diabetes as revealed by chronic flow measurement and transfer function analysis. J Am Soc Nephrol 17: 2184–2192, 2006. doi: 10.1681/ASN.2006030216. [DOI] [PubMed] [Google Scholar]
- 4.Berger EY, Farber SJ, Earle DP Jr, Jackenthal R. Comparison of the constant infusion and urine collection techniques for the measurement of renal function. J Clin Invest 27: 710–716, 1948. doi: 10.1172/JCI102020. [DOI] [PMC free article] [PubMed] [Google Scholar]
- 5.Bie P, Sandgaard NC. Determinants of the natriuresis after acute, slow sodium loading in conscious dogs. Am J Physiol Regul Integr Comp Physiol 278: R1–R10, 2000. [DOI] [PubMed] [Google Scholar]
- 6.Blazer-Yost BL, Esterman MA, Vlahos CJ. Insulin-stimulated trafficking of ENaC in renal cells requires PI 3-kinase activity. Am J Physiol Cell Physiol 284: C1645–C1653, 2003. doi: 10.1152/ajpcell.00372.2002. [DOI] [PubMed] [Google Scholar]
- 7.Brands MW, Fitzgerald SM, Hewitt WH, Hailman AE. Decreased cardiac output at the onset of diabetes: renal mechanisms and peripheral vasoconstriction. Am J Physiol Endocrinol Metab 278: E917–E924, 2000. [DOI] [PubMed] [Google Scholar]
- 8.Brands MW, Hildebrandt DA, Mizelle HL, Hall JE. Hypertension during chronic hyperinsulinemia in rats is not salt-sensitive. Hypertension 19, Suppl: I83–I89, 1992. doi: 10.1161/01.HYP.19.1_Suppl.I83. [DOI] [PubMed] [Google Scholar]
- 9.Brands MW, Lee WF, Keen HL, Alonso-Galicia M, Zappe DH, Hall JE. Cardiac output and renal function during insulin hypertension in Sprague-Dawley rats. Am J Physiol Regul Integr Comp Physiol 271: R276–R281, 1996. [DOI] [PubMed] [Google Scholar]
- 10.Brands MW, Mizelle HL, Gaillard CA, Hildebrandt DA, Hall JE. The hemodynamic response to chronic hyperinsulinemia in conscious dogs. Am J Hypertens 4: 164–168, 1991. doi: 10.1093/ajh/4.2.164. [DOI] [PubMed] [Google Scholar]
- 11.DeFronzo RA. The effect of insulin on renal sodium metabolism. A review with clinical implications. Diabetologia 21: 165–171, 1981. doi: 10.1007/BF00252649. [DOI] [PubMed] [Google Scholar]
- 12.Drummer C, Franck W, Heer M, Forssmann WG, Gerzer R, Goetz K. Postprandial natriuresis in humans: further evidence that urodilatin, not ANP, modulates sodium excretion. Am J Physiol Renal Physiol 270: F301–F310, 1996. [DOI] [PubMed] [Google Scholar]
- 13.Faletti CJ, Perrotti N, Taylor SI, Blazer-Yost BL. sgk: an essential convergence point for peptide and steroid hormone regulation of ENaC-mediated Na+ transport. Am J Physiol Cell Physiol 282: C494–C500, 2002. doi: 10.1152/ajpcell.00408.2001. [DOI] [PubMed] [Google Scholar]
- 14.Forte LR., Jr Uroguanylin and guanylin peptides: pharmacology and experimental therapeutics. Pharmacol Ther 104: 137–162, 2004. doi: 10.1016/j.pharmthera.2004.08.007. [DOI] [PubMed] [Google Scholar]
- 15.Frindt G, Palmer LG. Effects of insulin on Na and K transporters in the rat CCD. Am J Physiol Renal Physiol 302: F1227–F1233, 2012. doi: 10.1152/ajprenal.00675.2011. [DOI] [PMC free article] [PubMed] [Google Scholar]
- 16.Ghezzi C, Wright EM. Regulation of the human Na+-dependent glucose cotransporter hSGLT2. Am J Physiol Cell Physiol 303: C348–C354, 2012. doi: 10.1152/ajpcell.00115.2012. [DOI] [PMC free article] [PubMed] [Google Scholar]
- 17.Gutzwiller JP, Tschopp S, Bock A, Zehnder CE, Huber AR, Kreyenbuehl M, Gutmann H, Drewe J, Henzen C, Goeke B, Beglinger C. Glucagon-like peptide 1 induces natriuresis in healthy subjects and in insulin-resistant obese men. J Clin Endocrinol Metab 89: 3055–3061, 2004. doi: 10.1210/jc.2003-031403. [DOI] [PubMed] [Google Scholar]
- 18.Hall JE, Brands MW, Mizelle HL, Gaillard CA, Hildebrandt DA. Chronic intrarenal hyperinsulinemia does not cause hypertension. Am J Physiol Renal Physiol 260: F663–F669, 1991. [DOI] [PubMed] [Google Scholar]
- 19.Hall JE, Coleman TG, Mizelle HL, Smith MJ Jr. Chronic hyperinsulinemia and blood pressure regulation. Am J Physiol Renal Physiol 258: F722–F731, 1990. [DOI] [PubMed] [Google Scholar]
- 20.Hall JE, Mizelle HL, Brands MW, Hildebrandt DA. Pressure natriuresis and angiotensin II in reduced kidney mass, salt-induced hypertension. Am J Physiol Regul Integr Comp Physiol 262: R61–R71, 1992. [DOI] [PubMed] [Google Scholar]
- 21.Home PD. Plasma insulin profiles after subcutaneous injection: how close can we get to physiology in people with diabetes? Diabetes Obes Metab 17: 1011–1020, 2015. doi: 10.1111/dom.12501. [DOI] [PMC free article] [PubMed] [Google Scholar]
- 22.Ilatovskaya DV, Levchenko V, Brands MW, Pavlov TS, Staruschenko A. Cross-talk between insulin and IGF-1 receptors in the cortical collecting duct principal cells: implication for ENaC-mediated Na+ reabsorption. Am J Physiol Renal Physiol 308: F713–F719, 2015. doi: 10.1152/ajprenal.00081.2014. [DOI] [PMC free article] [PubMed] [Google Scholar]
- 23.Karhunen LJ, Juvonen KR, Huotari A, Purhonen AK, Herzig KH. Effect of protein, fat, carbohydrate and fibre on gastrointestinal peptide release in humans. Regul Pept 149: 70–78, 2008. doi: 10.1016/j.regpep.2007.10.008. [DOI] [PubMed] [Google Scholar]
- 24.Kirchner KA. Insulin increases loop segment chloride reabsorption in the euglycemic rat. Am J Physiol Renal Physiol 255: F1206–F1213, 1988. [DOI] [PubMed] [Google Scholar]
- 25.Komers R, Rogers S, Oyama TT, Xu B, Yang CL, McCormick J, Ellison DH. Enhanced phosphorylation of Na+-Cl− co-transporter in experimental metabolic syndrome: role of insulin. Clin Sci (Lond) 123: 635–647, 2012. doi: 10.1042/CS20120003. [DOI] [PMC free article] [PubMed] [Google Scholar]
- 26.Landsberg L. Insulin-mediated sympathetic stimulation: role in the pathogenesis of obesity-related hypertension (or, how insulin affects blood pressure, and why). J Hypertens 19, Suppl: 523–528, 2001. doi: 10.1097/00004872-200103001-00001. [DOI] [PubMed] [Google Scholar]
- 27.Li L, Garikepati RM, Tsukerman S, Kohan D, Wade JB, Tiwari S, Ecelbarger CM. Reduced ENaC activity and blood pressure in mice with genetic knockout of the insulin receptor in the renal collecting duct. Am J Physiol Renal Physiol 304: F279–F288, 2013. doi: 10.1152/ajprenal.00161.2012. [DOI] [PMC free article] [PubMed] [Google Scholar]
- 28.Manhiani MM, Cormican MT, Brands MW. Chronic sodium-retaining action of insulin in diabetic dogs. Am J Physiol Renal Physiol 300: F957–F965, 2011. doi: 10.1152/ajprenal.00395.2010. [DOI] [PMC free article] [PubMed] [Google Scholar]
- 29.Manhiani MM, Duggan AD, Wilson H, Brands MW. Chronic intrarenal insulin replacement reverses diabetes mellitus-induced natriuresis and diuresis. Hypertension 59: 421–430, 2012. doi: 10.1161/HYPERTENSIONAHA.111.185215. [DOI] [PMC free article] [PubMed] [Google Scholar]
- 30.Michell AR, Debnam ES, Unwin RJ. Regulation of renal function by the gastrointestinal tract: potential role of gut-derived peptides and hormones. Annu Rev Physiol 70: 379–403, 2008. doi: 10.1146/annurev.physiol.69.040705.141330. [DOI] [PubMed] [Google Scholar]
- 31.Morgan DA, Rahmouni K. Differential effects of insulin on sympathetic nerve activity in agouti obese mice. J Hypertens 28: 1913–1919, 2010. doi: 10.1097/HJH.0b013e32833c2289. [DOI] [PMC free article] [PubMed] [Google Scholar]
- 32.Morita H, Matsuda T, Furuya F, Khanchowdhury MR, Hosomi H. Hepatorenal reflex plays an important role in natriuresis after high-NaCl food intake in conscious dogs. Circ Res 72: 552–559, 1993. doi: 10.1161/01.RES.72.3.552. [DOI] [PubMed] [Google Scholar]
- 33.Nakamura M, Satoh N, Suzuki M, Kume H, Homma Y, Seki G, Horita S. Stimulatory effect of insulin on renal proximal tubule sodium transport is preserved in type 2 diabetes with nephropathy. Biochem Biophys Res Commun 461: 154–158, 2015. doi: 10.1016/j.bbrc.2015.04.005. [DOI] [PubMed] [Google Scholar]
- 34.Pavlov TS, Ilatovskaya DV, Levchenko V, Li L, Ecelbarger CM, Staruschenko A. Regulation of ENaC in mice lacking renal insulin receptors in the collecting duct. FASEB J 27: 2723–2732, 2013. doi: 10.1096/fj.12-223792. [DOI] [PMC free article] [PubMed] [Google Scholar]
- 35.Peterson TV, Benjamin BA, Hurst NL, Euler CG. Renal nerves and postprandial renal excretion in the conscious monkey. Am J Physiol Regul Integr Comp Physiol 261: R1197–R1203, 1991. [DOI] [PubMed] [Google Scholar]
- 36.Rabinowitz L, Denham SC, Gunther RA. Aldosterone and postprandial renal excretion of sodium and potassium in sheep. Am J Physiol Renal Physiol 233: F213–F216, 1977. [DOI] [PubMed] [Google Scholar]
- 37.Sawicki PT, Heinemann L, Starke A, Berger M. Hyperinsulinaemia is not linked with blood pressure elevation in patients with insulinoma. Diabetologia 35: 649–652, 1992. doi: 10.1007/BF00400257. [DOI] [PubMed] [Google Scholar]
- 38.Sohara E, Rai T, Yang SS, Ohta A, Naito S, Chiga M, Nomura N, Lin SH, Vandewalle A, Ohta E, Sasaki S, Uchida S. Acute insulin stimulation induces phosphorylation of the Na-Cl cotransporter in cultured distal mpkDCT cells and mouse kidney. PLoS One 6: e24277, 2011. doi: 10.1371/journal.pone.0024277. [DOI] [PMC free article] [PubMed] [Google Scholar]
- 39.Solhaug MJ, Granger JP. Effect of sodium intake on fasting and postprandial levels of atrial natriuretic factor in humans. Life Sci 45: 931–937, 1989. doi: 10.1016/0024-3205(89)90207-5. [DOI] [PubMed] [Google Scholar]
- 40.Stocker SD, Gordon KW. Glutamate receptors in the hypothalamic paraventricular nucleus contribute to insulin-induced sympathoexcitation. J Neurophysiol 113: 1302–1309, 2015. doi: 10.1152/jn.00764.2014. [DOI] [PMC free article] [PubMed] [Google Scholar]
- 41.Tiwari S, Nordquist L, Halagappa VK, Ecelbarger CA. Trafficking of ENaC subunits in response to acute insulin in mouse kidney. Am J Physiol Renal Physiol 293: F178–F185, 2007. doi: 10.1152/ajprenal.00447.2006. [DOI] [PubMed] [Google Scholar]
- 42.Tiwari S, Riazi S, Ecelbarger CA. Insulin’s impact on renal sodium transport and blood pressure in health, obesity, and diabetes. Am J Physiol Renal Physiol 293: F974–F984, 2007. doi: 10.1152/ajprenal.00149.2007. [DOI] [PubMed] [Google Scholar]
- 43.Tiwari S, Sharma N, Gill PS, Igarashi P, Kahn CR, Wade JB, Ecelbarger CM. Impaired sodium excretion and increased blood pressure in mice with targeted deletion of renal epithelial insulin receptor. Proc Natl Acad Sci USA 105: 6469–6474, 2008. doi: 10.1073/pnas.0711283105. [DOI] [PMC free article] [PubMed] [Google Scholar]
- 44.Tsutsu N, Nunoi K, Kodama T, Nomiyama R, Iwase M, Fujishima M. Lack of association between blood pressure and insulin in patients with insulinoma. J Hypertens 8: 479–482, 1990. doi: 10.1097/00004872-199005000-00014. [DOI] [PubMed] [Google Scholar]
- 45.Vallon V, Docherty NG. Intestinal regulation of urinary sodium excretion and the pathophysiology of diabetic kidney disease: a focus on glucagon-like peptide 1 and dipeptidyl peptidase 4. Exp Physiol 99: 1140–1145, 2014. doi: 10.1113/expphysiol.2014.078766. [DOI] [PMC free article] [PubMed] [Google Scholar]
- 46.Verburg KM, Freeman RH, Villarreal D, Brands MW. Cardiovascular and renal effects of calcitonin gene-related peptide in hypertensive dogs. Peptides 10: 663–669, 1989. doi: 10.1016/0196-9781(89)90157-5. [DOI] [PubMed] [Google Scholar]
- 47.Zaika O, Palygin O, Tomilin V, Mamenko M, Staruschenko A, Pochynyuk O. Insulin and IGF-1 activate Kir4.1/5.1 channels in cortical collecting duct principal cells to control basolateral membrane voltage. Am J Physiol Renal Physiol 310: F311–F321, 2016. doi: 10.1152/ajprenal.00436.2015. [DOI] [PMC free article] [PubMed] [Google Scholar]
- 48.Zhang YH, Alvarez de la Rosa D, Canessa CM, Hayslett JP. Insulin-induced phosphorylation of ENaC correlates with increased sodium channel function in A6 cells. Am J Physiol Cell Physiol 288: C141–C147, 2005. doi: 10.1152/ajpcell.00343.2004. [DOI] [PubMed] [Google Scholar]