

Abstract
Spinal muscular atrophy linked to chromosome 5q (SMA) is a recessive, progressive, neuromuscular disorder caused by bi-allelic mutations in the SMN1 gene, resulting in motor neuron degeneration and variable presentation in relation to onset and severity. A prevalence of approximately 1–2 per 100,000 persons and incidence around 1 in 10,000 live births have been estimated with SMA type I accounting for around 60% of all cases. Since SMA is a relatively rare condition, studies of its prevalence and incidence are challenging. Most published studies are outdated and therefore rely on clinical rather than genetic diagnosis. Furthermore they are performed in small cohorts in small geographical regions and only study European populations. In addition, the heterogeneity of the condition can lead to delays and difficulties in diagnosing the condition, especially outside of specialist clinics, and contributes to the challenges in understanding the epidemiology of the disease. The frequency of unaffected, heterozygous carriers of the SMN1 mutations appears to be higher among Caucasian and Asian populations compared to the Black (Sub-Saharan African ancestry) population. However, carrier frequencies cannot directly be translated into incidence and prevalence, as very severe (death in utero) and very mild (symptom free in adults) phenotypes carrying bi-allelic SMN1 mutations exist, and their frequency is unknown.
More robust epidemiological data on SMA covering larger populations based on accurate genetic diagnosis or newborn screening would be helpful to support planning of clinical studies, provision of care and therapies and evaluation of outcomes.
Electronic supplementary material
The online version of this article (doi:10.1186/s13023-017-0671-8) contains supplementary material, which is available to authorized users.
Keywords: Spinal muscular atrophy, Prevalence, Incidence, Carrier frequency, Ethnic background
Background
Spinal muscular atrophy (SMA) is characterised by degeneration of the alpha motor neurons of the spinal cord anterior horn cells, leading to progressive proximal muscle weakness and atrophy and, in the most severe types, paralysis.
The clinical phenotype of SMA is heterogeneous, ranging from a severe to a mild phenotype. It is generally divided into three main subtypes: type I (also called Werdnig Hoffmann disease), type II and, type III (also called Kugelberg Welander disease). However, these phenotypes are seen more as a continuum rather than as distinct subtypes and sometimes further subtypes at both ends of the spectrum are observed. SMA type 0 is a very severe form with onset in utero, reduced or absent movements, contractures, and requirement for mechanical ventilation support at birth and death before six months of age, while SMA type IV is a mild late (adult) onset form that has a normal life expectancy [1, 2]. An overview of the different subtypes is given in Table 1.
Table 1.
Clinical classification of spinal muscular atrophy
| SMA type | OMIM number | Age of onset | Highest achieved motor function | Natural age of death |
|---|---|---|---|---|
| 0 | - | Prenatal/ Foetal | Nil | <6 months |
| I | 253300 | <6 months | Sit with support only | <2 years |
| II | 253550 | 6–18 months | Sit independently | >2 years |
| III | 253400 | >18 months | Stand and walk | Adulthood |
| IV | 271150 | Adult (2nd or 3rd decade) | Walk during adulthood | Adult |
OMIM Online Mendelian Inheritance in Man
SMA is inherited in an autosomal recessive manner. In most cases it is caused by mutations in the survival motor neuron 1 (SMN1, SMN T, telomeric) gene, located on chromosome 5q13.2 [3]. In rare cases (~4%) SMA is caused by mutation in another gene (non-5q SMA). The majority of the patients (92%) have a homozygous deletion of SMN1. In the remaining patients small mutations that abolish the production of the SMN protein are found, mostly in a combination with an SMN1 deletion (~4%) [4, 5]. A centromeric homologue of the gene, SMN2, (previously also called SMN C or C BCD541) is present in humans. SMN2 differs from SMN1 by five nucleotides of which only one (an 840C➔T transition at exon 6–7) lies in the coding sequence and is transitionally silent. This change and a change in intron 7 cause exon 7 of the SMN2 transcript to be poorly recognized by the splicing machinery, resulting in the skipping of this exon in the majority of transcripts. This results in a frame-shift and production of a protein with a different C-terminal end, which is unstable and non-functional [3, 6]. Since exon 7 is sometimes included in SMN2 transcripts, some full-length SMN protein can be produced, albeit as very low levels (~10–20%) that are insufficient to prevent disease. The number of SMN2 copies varies within the general population, and is inversely associated with disease severity as having more SMN2 copies ensures that the absolute amount of SMN protein that is produced is higher. Notably, SMN2 defects in isolation do not seem to cause the disease [7–9]. Other modifiers that might play a role are NAIP, H4F5, GTF2H2 and PLS3 [10–15]. NAIP, H4F5 and GTF2H2 are thought to be a modifiers due to their proximity to the SMN1 gene and NAIP also shows homology to apoptosis inhibitory proteins [12, 14, 16]. PLS3 restores the function of the neuromuscular junction, by stabilizing F-actin-dependent endocytosis [17].
The first therapy for SMA, Spinraza (IONIS-SMNRx, nusinersen), has recently been approved by the Food and Drug Administration (FDA) in the US [18] and by the European Medicines Agency (EMA) in Europe [19]. Clinical trials for other potential therapies are progressing. As such, the knowledge about the frequency of the disease becomes even more important. This review provides an overview of what is currently known about the prevalence, incidence and carrier frequency of SMA.
Methods
Published literature on prevalence, incidence or carrier frequency of SMA was identified through PubMed searches. Search terms were ‘spinal muscular atrophy’ OR ‘Werdnig Hoffmann’ OR ‘Kugelberg Welander’ AND ‘prevalence’ OR ‘incidence’, OR ‘carrier frequency’. No restrictions for language were used; however articles in other languages than English may be missed, due to the use of English search terms. Retrieved literature was scanned and all available articles performing a prevalence, incidence or carrier frequency study were used for this review. Additional publications were identified from references in the articles. Available literature published through 6th December 2016 was taken into account; no start date was used. For prevalence and incidence studies, all studies had determining the prevalence and/or incidence as primary goal. For carrier frequency studies also studies in which carrier frequency was determined for other purposes were included. All articles were appraised critically for accurate use of terminology and were reassigned if needed. For detailed methods on the analysis of carrier frequency differences between ethnic groups see Additional file 1.
Prevalence and incidence of SMA
To date, only a few studies have been performed to assess the prevalence and incidence of SMA. Most of these have been conducted before 1995, when the disease causing gene was identified, therefore using clinical rather than genetic diagnosis as an inclusion criterion. Generally, an estimation of the incidence of all types of SMA of around 10 in 100,000 (1 in 10,000) live births is cited [20, 21].
Prevalence
Prevalence is the number of living individuals with a disease at a given time. An overview of the studies examining the prevalence of SMA is provided in Table 2.
Table 2.
Overview prevalence of SMA by subtype
| Country | Time point | SMA | Type I | Quality and comparability | Reference | |||||||
| No of patients | Population | per 100,000 | No of patients | Population | per 100,000 | |||||||
| Norway (Southern + Eastern) | 01/01/1983 | 24 | 573,762 | 4.18 | 1 | 573,762 | 0.17 | Only included patients below 18 years of age | Tangsrud_1988 [25] | |||
| Sweden (Western) | 31/12/2006 | 11 | 340,179 | 3.23 | - | - | - | Genetic diagnosis used Only included patients below 16 years of age |
Arkblad_2009 [23] | |||
| Sweden (Western) | 01/01/1995 | 10 | 359,676 | 2.78 | 1 | 359,676 | 0.28 | Only included patients below 16 years of age | Darin_2000 [24] | |||
| Estonia | 31/12/2003 | - | - | - | 2 | 1,351,069 | 0.15 | Genetic diagnosis used | Vaidla_2006 [34] | |||
| United Kingdom (Northern Ireland) | 30/06/1994 | 22 | 1,573,282 | 1.40 | - | - | - | Hughes_1996 [110] | ||||
| United Kingdom (Northern England) | 01/08/2007 | 56 | 2,991,517 | 1.87 | 3 | 2,991,517 | 0.10 | Genetic diagnosis used in most cases | Norwood_2009 [32] | |||
| Germany (West‑Thüringen) | 31/12/1987 | - | - | - | 3 | 1,778,200 | 0.17 | Thieme_1993 [33] | ||||
| Italy (Bologna) | 31/12/1989 | 10 | 152,529 | 6.56 | - | - | - | Only included patients below 20 years of age | Merlini_1992 [22] | |||
| Saudi Arabia (Northeast, Thugbah) | 02/08/1989 | 3 | 22,630 | 13.26 | 1 | 22,630 | 4.42 | In half of the cases parental consanguinity was observed | al Rajeh_1993 [29] | |||
| China (Hongkong) | 30/06/2001 | 25 | 1,335,469 | 1.87 | 2 | 1,335,469 | 0.15 | Partly used genetic diagnosis | Chung_2003 [31] | |||
| Canada (Toronto) | 1962–1964 | 20.33 | 2,748,500 | 0.74 | - | - | - | Average of a three-year period | Winsor_1971 [111] | |||
| Country | Time point | Type II | Type III | Type II + III | Quality and comparability | Reference | ||||||
| No of patients | Population | per 100,000 | No of patients | Population | per 100,000 | No of patients | Population | per 100,000 | ||||
| Norway (Southern + Eastern) | 01/01/1983 | 21 | 573,762 | 3.66 | 2 | 573,762 | 0.35 | 23 | 573,762 | 4.01 | Only included patients below 18 years of age | Tangsrud_1988 [25] |
| Sweden (Western) | 01/01/1995 | 4 | 359,676 | 1.11 | 5 | 359,676 | 1.39 | 9 | 359,676 | 2.50 | Only included patients below 16 years of age | Darin_2000 [24] |
| United Kingdom (Northern England) | 01/08/2007 | 17 | 2,991,517 | 0.57 | 36 | 2,991,517 | 1.20 | 53 | 2,991,517 | 1.77 | Genetic diagnosis used in most casesa | Norwood_2009 [32] |
| United Kingdom (Northeast England) | June 1971 | - | - | - | - | - | - | 30 | 2,488,810 | 1.21 | Type II/III patients defined as: onset of disease between birth and 8 years of age, survival above 18 months of age | Pearn_1978 [41] |
| Germany (West‑Thüringen) | 31/12/1980 | - | - | - | - | - | - | 29 | 1,785,239 | 1.62 | Type II/III patients defined as: survival above 4 years of age Exact number of patients not mentionedb |
Thieme_1994 [43] |
| Poland (Warsaw) | 31/12/1985 | - | - | - | - | - | - | 21 | 1,659,385 | 1.26 | Exact number of patients not mentionedb | Spiegler_1990 [42] |
| Libya (Benghazi) | 31/12/1986 | - | - | - | - | - | - | 12 | - | 2.30 | In half of the cases parental consanguinity was observed | Radhakrishan_1988 [48] |
| Saudi Arabia (Northeast, Thugbah) | 02/08/1989 | 2 | 22,630 | 8.84 | - | - | - | - | - | - | In half of the cases parental consanguinity was observed | al Rajeh_1993 [29] |
| China (Hongkong) | 30/06/2001 | 9 | 1,335,469 | 0.67 | 14 | 1,335,469 | 1.05 | 23 | 1,335,469 | 1.72 | Partly used genetic diagnosis | Chung_2003 [31] |
Prevalence per 100,000 persons of the total population. Studies have been grouped by geographical region. Studies are based on clinical diagnosis, unless otherwise indicated. Indicated if described in article that different classification criteria than those in Table 1 were used
a) 17 patients are classified as type III on clinical and neurophysiological findings in the absence of a confirmed mutation in the SMN1 gene
b) Number of patients not described in article, calculated based on prevalence and population number
When examining all types of SMA together, in most cases a prevalence of around 1–2 per 100,000 persons is observed. In some studies a somewhat higher prevalence was observed. A study from Bologna, Italy, in 1992 calculated a prevalence of 6.56 per 100,000 persons aged less than 20 years [22]. Three studies in Scandinavia showed a prevalence of 4.18 per 100,000 persons aged 18 years or less, and 3.23 and 2.78 per 100,000 persons aged below 16 years [23–25]. This could indicate regional differences in the incidence of SMA, i.e. gene pools. However, there are several other factors that may account for this observation. First of all, all studies were performed in small regions and thereby small populations were studied. For rare diseases like SMA, a small error in the detection of the number of cases can have a large impact on the estimated prevalence (sample bias). Secondly, these studies only took children into account, which is likely to influence the numbers in an upward direction. Furthermore, in the case of Sweden higher prevalence rates have also been observed in studies into other neuromuscular disorders, which could be due to a greater awareness and a good health system in Sweden, making it easier to identify patients for such a study [26–28]. A study in Northeast Saudi Arabia also found a very high prevalence rate. Although the prevalence of SMA might be different in the Middle East when compared to Europe, in more than half of the cases parental consanguinity was observed, which could at least partially explain the high prevalence [29].
Prevalence by SMA subtype
Although SMA type I is expected to account for more than half of all new SMA cases [30], the studies that examined a SMA type I only showed a prevalence of 0.04 to 0.28 per 100,000 [24, 25, 31–34], which is much lower than the 1–2 per 100,000 persons noted for all SMA. Due to its severity, patients with SMA type I have a short life expectancy. Therefore often no or only few patients are alive on the date of the study, which could account for this lower prevalence. Nowadays, a median life expectancy of around one year of age is estimated for type I patients [35–37], whereas in type II 75–93% of patients survive beyond 20 years of age [37–40] and life expectancy for type III is thought to be close to the normal population [20, 39].
The prevalence of both SMA type II and III together has been estimated around 1.5 per 100,000 [31, 32, 41–43]. Of three studies that investigated type II and type III separately, two found a higher prevalence of type III compared to type II [24, 32]. This may be explained by the longer life expectancy of type III patients compared to type II SMA patients.
Incidence
Incidence is the number of new cases of disease in a particular time period. In the case of SMA, the genotype is present at birth; a more precise term therefore is birth prevalence. Since newborn screening is not widely performed the number of patients expressing the phenotype is used instead to estimate the incidence. An overview of the studies examining the incidence is given in Table 3.
Table 3.
Overview incidence of SMA by subtype
| Country | Timeframe | SMA | Type I | Quality and comparability | Reference | |||||||
| No of patients | Population | per 100,000 | No of patients | Population | per 100,000 | |||||||
| Iceland | 1982–1996 | 9 | 65,584 | 13.7 | 4 | 65,584 | 6.1 | Ludvigsson_1999 [112] | ||||
| Sweden (Western) | 1980–2006 | 45 | 531,746 | 8.5 | 19 | 531,746 | 3.6 | Genetic diagnosis used Only included patients below 16 years of age |
Arkblad_2009 [23] | |||
| Sweden (Western) | 1979–1994 | 21 | 343,941 | 6.1 | 13 | 343,941 | 3.8 | Only included patients below 16 years of age | Darin_2000 [24] | |||
| Finland | 1971–1985 | 68 | 952,228 | 7.1 | 53 | 952,228 | 5.6 | Ignatius_1989 [51] | ||||
| Estonia | 1994–2003 | 15 | 129,832 | 11.6 | 9 | 129,832 | 6.9 | Genetic diagnosis used | Vaidla_2006 [34] | |||
| United Kingdom (South Wales) | 1973–1989 | - | - | - | - | - | 4.4 | No details provided | MacMillan_1991 [113] | |||
| United Kingdom (Northeast England) | 1966–1971 | - | - | - | 9 | 231,370 | 3.9 | Type I defined as onset of disease before 12 months of age | Pearn_1973 [52] | |||
| Germany (West-Thüringen) | 1974–1987 | - | - | - | 33 | 336,663 | 9.8 | Thieme_1993 [33] | ||||
| Switzerland | 1960–1969 | - | - | - | 62 | 1,100,000 | 5.6 | Probably also contains some type II patients | Zellweger_1972 [55] | |||
| Poland (Warsaw) | 1976–1985 | 22 | 214,217 | 10.3 | 11 | 214,217 | 5.1 | Patients described as type Ib reclassified as type II according to the description | Spiegler_1990 [42] | |||
| Poland | 1998–2005 | 304 | 2,963,783 | 10.3 | 209 | 2,963,783 | 7.1 | Genetic diagnosis used | Jedrzejowska_2010 [73] | |||
| Slovakia | - | - | 17.8 | - | - | 8.1 | Kvasnicova_1994 [44] | |||||
| Hungary | 1973–1980 | - | - | - | 91 | 1,376,928 | 6.6 | Czeizel_1989 [50] | ||||
| Italy (Northeast) | 1960–1983 | 67 | 859,891 | 7.8 | 35 | 859,891 | 4.1 | Mostacciuolo_1992 [114] | ||||
| Italy (Bologna) | 1970–1989 | 17 | 150,978 | 11.3 | 8 | 150,978 | 5.3 | Only included patients below 20 years of age | Merlini_1992 [22] | |||
| Libya (Benghazi) | 1983–1986 | 18 | 75,000 | 24 | 6 | 75,000 | 8 | In half of the cases parental consanguinity was observed Population number is an estimation |
Radhakrishan_1988 [48] | |||
| Reunion Island | 1969–1980 | - | - | - | 19 | 24,000 | 79 | In 13 siblings of a European community Population number is an estimation |
Pascalet-Guideon_1984 [115] | |||
| Israel | 1970–1975 | - | - | - | 4 | 1600 | 250 | In an Egyptian Karaite community Population number is an estimation |
Fried_1977 [116] | |||
| Canada (Toronto) | 1955–1965 | 37 | 617,520 | 6.0 | - | - | - | Winsor_1971 [111] | ||||
| USA (Ohio) | 4 | 40,103 | 10.0 | - | - | - | Genetic diagnosis used | Prior_2010 [101] | ||||
| USA (North Dakota) | 1980–1987 | - | - | - | 14 | 94,092 | 14.9 | Burd_1991 [53] | ||||
| Cuba | 1996–2002 | 51 | 1,018,454 | 5.0 | 36 | 1,018,454 | 3.5 | Partly used genetic diagnosis | Zaldivar_2002 [45] | |||
| Country | Timeframe | Type II | Type III | Type II + III | Quality and comparability | Reference | ||||||
| No of patients | Population | per 100,000 | No of patients | Population | per 100,000 | No of patients | Population | per 100,000 | ||||
| Iceland | 1982–1996 | 2 | 65,584 | 3.0 | 3 | 65,584 | 4.6 | 5 | 65,584 | 7.6 | Ludvigsson_1999 [112] | |
| Sweden (Western) | 1980–2006 | 11 | 531,746 | 2.1 | 15 | 531,746 | 2.8 | 26 | 531,746 | 4.9 | Genetic diagnosis used Only included patients below 16 years of age |
Arkblad_2009 [23] |
| Sweden (Western) | 1979–1994 | 3 | 343,941 | 0.9b | 5 | 343,941 | 1.5 | 8 | 343,941 | 2.3 | Only included patients below 16 years of age | Darin_2000 [24] |
| Finland | 1971–1985 | - | - | - | - | - | - | 15 | 952,228 | 1.6 | Ignatius_1989 [51] | |
| United Kingdom (Northeast England) | 1960–1969 | - | - | - | - | - | - | 15k | 365,166 | 4.1 | Pearn_1978 [41] | |
| Germany (West-Thüringen) | 1965–1980 | - | - | - | - | - | - | 42 | 395,646 | 10.6 | Type II/III patients defined as: survival above 4 years of age | Thieme_1994 [43] |
| Poland (Warsaw) | 1976–1985 | 10 | 214,217 | 4.7 | 1 | 214,217 | 0.5 | 11 | 214,217 | 5.1 | Type II defined as onset of disease before 12 months of age | Spiegler_1990 [42] |
| Poland | 1998–2005 | 37 | 2,963,783 | 1.2 | 58 | 2,963,783 | 2.0 | 95 | 2,963,783 | 3.2 | Genetic diagnosis used | Jedrzejowska_2010 [73] |
| Slovakia | - | - | 3.7 | - | - | 5.9 | - | - | 9.6 | Kvasnicova_1994 [44] | ||
| Italy (Northeast) | 1960–1983 | 19 | 859,891 | 2.2 | 13 | 859,891 | 1.5 | 32 | 859,891 | 3.7 | Mostacciuolo_1992 [114] | |
| Italy (Bologna) | 1970–1989 | 8 | 150,978 | 5.3f | 1 | 150,978 | 0.7 | 9 | 150,978 | 6.0 | Only included patients below 20 years of age | Merlini_1992 [22] |
| Libya (Benghazi) | 1983–1986 | - | - | - | - | - | - | 12 | 75,000 | 16 | In half of the cases parental consanguinity was observed Population number is an estimation |
Radhakrishan_1988 [48] |
Incidence per 100,000 live births. Studies have been grouped by geographical region. Studies are based on clinical diagnosis, unless otherwise indicated. Indicated if described in article that different classification criteria than those in Table 1 were used
When evaluating the incidence of all types of SMA combined, on average an incidence of around 8 per 100,000 live births is found (~1 in 12,000). Some studies show a somewhat lower or higher incidence. In a study in Iceland an incidence of 13.7 per 100,000 live births was found. This is a study on an island with a relatively small population, where it might be easier to identify all patients. A study in Slovakia found a high incidence of 17.8 per 100,000, but details of the number of patients or population size were unavailable, making it difficult to interpret these findings [44]. In a recent study in Cuba a lower incidence of 5.0 per 100,000 was seen [45]. Patients were detected via an obligatory governmental registry and approximately 70% of the patients were genetically confirmed. This study also examined the ethnicity of the SMA type I patients. The majority of these patients were White (30/36), 5/36 were of mixed race and 1/36 patient was Black. Although this could be partially explained by the racial composition of the Cuban population, still relatively more White people were affected. There are several reasons that could account for this. First, there is a difference in incidence between various ethnicities. There are also reports of lower SMA carrier frequencies among Hispanics [46, 47]. However, it could also be the case that there are differences in the access to health care between different ethnicities. In a small study among 75,000 persons in Libya, a high incidence (24 per 100,000 live births) was found, and this may partially be explained by a high degree of consanguinity [48].
Incidence by subtype
In 1991, Alan Emery published a review estimating the incidence for SMA type I to be around 4–6 in 100,000 (1 in 12,500–1 in 16,667) live births [49], which was based on only three studies [50–52]. We identified 17 studies, which taken together indicated an SMA I incidence of approximately 6 per 100,000. In the USA (North Dakota) in a study that pre-dated genetic testing, high incidence was observed (14.9 per 100,000); however this study was performed in a very small population, and any error in the accuracy of case identification may be associated with the high incidence. All patients studied were Caucasian and no consanguinity was observed [53]. In a regional study in Germany, a higher incidence of 9.8 per 100,000 was found [33]. In Libya, a high incidence, as found for total SMA, was not observed among type I patients (8.0 per 100,000) [48]. This is again based on a small population and could be due to a lack of awareness of SMA at the time the study was conducted. Furthermore, SMA type I patients might have been missed due to their short life span. In two small communities a very high incidence was observed. On Reunion Island in a European community a founder effect (loss of genetic variation that occurs when a new population is established by a very small number of individuals, which could lead to a high incidence if in one of these founders a mutation was present) was clearly seen, leading to an incidence of 79 per 100,000. In an Egyptian Karaite community in Israel, where in more than half of the affected families consanguinity was observed, an incidence of as high as 250 per 100,000 live births was found.
For type II and III, a high incidence of both types combined was observed (10.6 per 100,000) in a German study in the same region as the previously mentioned type I study that partially covered the same time period [33, 43]. The healthcare system in Germany may partly explain these observations. Furthermore, there might be regional differences in SMA incidence. The authors suggest that SMA might be more prevalent in central and Eastern Europe than in Western Europe. For type II and type III SMA the highest occurrence was observed in Libya (16 per 100,000) [48].
A study not added in Table 3 is a study from Kurland et al. in Rochester, USA, studying the period 1945–1954. This study found only one SMA type I patient and the calculations used the total population size instead of the number of live births to calculate the incidence. Furthermore, this total population consisted of only 30,000 persons [54].
The epidemiologic burden of SMA is not equally divided over the subtypes. In 2004 Ogino et al. reviewed several studies and calculated incidence rates of 5.83 per 100,000 live births for SMA type I, 2.66 per 100,000 live births for type II and 1.20 per 100,000 live births for type III. This implied that SMA type I, II and III constituted 60%, 27% and 12% of all SMA cases, respectively [30]. This overview included the study of Radhakrishan et al. in Libya, in which for half of the families parental consanguinity was observed [48]. In our analysis, we calculated the percentages in two ways yielding nearly identical results. First by only taking studies into account in which all types of SMA were studied separately, as this makes a direct comparison possible; and, secondly by taking all studies presented into account. In both cases this resulted in incidence rates of around 5.5, 1.9 and 1.7 per 100,000 for type I, II and III, respectively. This yields a percentage of around 60% for the incidence of SMA type I; with the remaining 40% of the cases equally divided between type II and type III. This indicates that SMA I indeed makes up the largest proportion of the total SMA.
Considerations for comparing studies
To date, there are few studies of the prevalence and/or incidence of SMA, with a small number of these being recent. Most of the studies have been carried out in Europe. Furthermore, four of the ten studies done outside of Europe were performed in the countries with high consanguinity or small communities, thereby they are not considered to be representative of the overall SMA prevalence and incidence. No worldwide studies have been published to date.
A number of limitations should be taken into account when estimating prevalence/ incidence of SMA and comparing the presented studies. Most studies have been performed before 1995 when the genetic cause for SMA, deletion of the SMN1 gene, was identified [3], where after genetic diagnosis was implemented. Therefore, most studies rely on the less accurate clinical diagnosis of SMA. This increases the chance of misdiagnosis of diseases with clinical features similar to SMA. Another difficulty comparing studies is that the classification of SMA has slightly changed over the years and it is not always clear which classification system has been used. For example, in the studies of John Pearn in Northeast England patients were defined as SMA type I if they had an onset of symptoms before the age of 12 months, so this might also include some early diagnosed SMA type II patients [41, 52]. Chronic SMA was classified as patients living beyond 18 months old. However, in the study in West-Thüringen, Germany patients had to survive till at least four years of age to be classified as chronic SMA [43]. This is further exemplified by the study of Spiegler et al. in Warsaw, Poland. In this study type Ib patients are mentioned, and are defined as patients diagnosed at birth or in the first months of life and living up to 30 years, whereas type II SMA was described as having an onset at the age of one year onwards [42]. In the study of Zellweger et al. in Switzerland it is not clearly specified which definitions were used, but it is conceivable that some type II patients are included in the numbers of type I patients [55]. Currently, the classification of the main subtypes: I, II and III (and sometimes IV) as described in Table 1 is used.
Another factor that should be taken into account is that the studies have been performed in different time periods. The natural history of SMA has changed over the years as the standards of care and associated outcomes have largely improved in the recent years. For example for type I comparison of studies showed the mean age of death increased from 8.8–10 months in studies performed before 1995 to 10.4 months up to 4 years in studies performed after 2000 [35, 36]. This is partly due to the availability of assisted ventilation (non-invasive or through tracheostomy) and of tube feeding through a gastrostomy [36].
Lastly, most of the studies have been performed in small geographical areas, thereby including a relatively small study population. One or two patients more or less in a small patient population will have a strong effect on the calculated prevalence or incidence. All these factors make a comparison between the studies and the interpretation of the findings difficult.
In conclusion, few prevalence and incidence studies have been performed for SMA, of which most are based on clinical diagnosis and are performed in European countries or regions, using small study populations. In addition to prevalence and incidence studies, carrier frequencies can provided useful additional information about, for example, ethnic subpopulations.
Carrier frequency in SMA
Since SMA is a recessive disease, there are also unaffected, heterozygous carriers of the disease. Carriers fall into four main groups of genotypes (Fig. 1). The most common one is the ‘1 + 0’ genotype (one normal, functional allele and a SMN1 deleted, disease allele). A much less common category is the ‘2 + 0’ genotype with two functional genes on one chromosome and none on the other. Furthermore, there are also ‘1 + 1D’ and ‘2 + 1D’ genotypes, which have one or two functional genes on one chromosome and a non-functional gene due to either a point mutation or a microdeletion on the other. These last two genotypes are very rare [56, 57]. Four or even more copies of the SMN1 gene have also been found, indicating a ‘2 + 2’ or possibly a ‘3 + 1’ genotype. This suggests ‘3 + 0’ or ‘3 + 1D’ carrier genotypes might also be possible, however these will be even rarer.
Fig. 1.
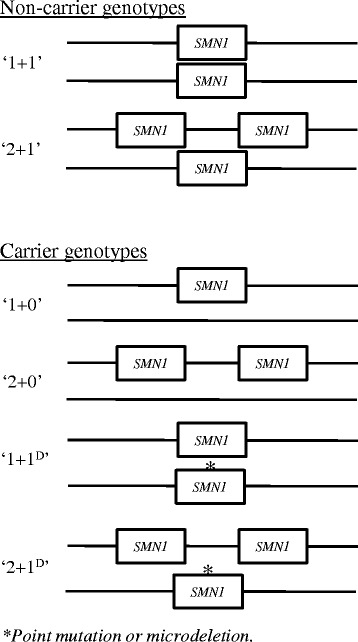
Most common SMA genotypes among non-carriers and carriers
No signs of disease have been associated with being a carrier for SMA. However, some studies suggest abnormal SMN1 copy numbers (either deletions or duplications) may increase the risk and severity of sporadic amyotrophic lateral sclerosis (ALS), although other studies have been unable to confirm this association (for a review see Butchbach et al., 2016 [58]). Furthermore, it was suggested that in the rare disorder progressive muscular atrophy (PMA) SMN1 duplications might be associated with a more severe clinical phenotype [59].
After the discovery of mutations in SMN1 as the cause of SMA, several studies into the carrier status of SMA have been performed. In contrast to the prevalence/ incidence studies, most studies have been performed outside of Europe. Some of these are population screening programmes, whereas others are large samples of the general population [46, 60–81]. There are also studies where small population samples were analysed or the carrier frequency was estimated from healthy controls screened for SMN1 for other purposes [8, 30, 82–99]. As mentioned before, frequencies estimated from a small population sample are less accurate. An overview of all studies is given in Additional file 2.
Subpopulation differences
Some of the studies have examined differences between ethnic groups within their study population [46, 62–65, 77, 80]. The main finding was that copy numbers were significantly higher in Black (Sub-Saharan African ancestry) people. This was seen in African Americans [46, 62, 77], as well as in Black Africans [66] and would indicate a higher proportion of 2-copy (duplication) alleles, thereby suggesting a higher number of ‘2 + 0’ carriers. This could account for a lower detection rate (around 70% for Black people versus 90–95% for other ethnicities), leading to a high number of false negatives. The study in Africa found a significantly lower carrier frequency compared to Eurasians [66]. Lower carrier frequencies were also seen in a study comparing Black and White people in South Africa and a study among samples of the 1000 genome project [65, 80]. However, these studies could not detect the ‘2 + 0’ carriers, which could reduce the observed differences. Some studies also found lower carrier frequencies in Hispanics [46, 77], but this was not seen in other studies [62, 69, 80]. Lastly, Luo et al. identified a specific haplotype, present in Ashkenazi Jews and Asians detectable by microsatellite analysis, that could distinguish duplication alleles (present in ‘2 + 0’ carriers) from normal ‘1 + 1’ genotypes [77].
We carried out an analysis of differences between ethnic groups and studies. Fig. 2 shows a comparison of all studies described in Additional file 2 (ethnicities are indicated). The grey area indicates the 95% confidence interval based on the average carrier frequency of all studies combined (0.019).1 Most studies fall within this area, indicating no large differences in carrier frequency. Two populations (a Muslim Arab village in Israel and a specific group of Hutterites in South Dakota, USA) showed a particularly high carrier frequency. However, these are isolated populations with a high degree of inbreeding [81, 89]. Also in an Iranian population a higher carrier frequency was seen (1 in 20). However this is based on one study with a small sample size, furthermore, in Iran, consanguineous marriages are common [91]. Combined estimates of carrier frequencies for ethnic groups were calculated (large symbols in Fig. 2 and Table 4).
Fig. 2.
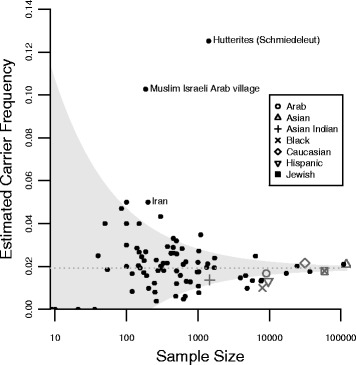
Carrier frequency studies for SMA. The grey area represents the 95% confidence interval based on the average carrier frequency (0.019) of all individuals (except those from the isolated Muslim Israeli Arab village and the Schmiedeleut Hutterites). Small dots represent individual studies. In case studies seperated between groups, these are depicted as separate dots. Large symbols represent pooled estimates for different ethnical groups
Table 4.
Carrier frequencies for SMA per ethnicity
| Population | Number of identified carriers | Number of study participants | Carrier frequency | 95% CI |
|---|---|---|---|---|
| Araba | 152 | 9058 | 0.017 | 0.014–0.019 |
| Asian | 2492 | 119,718 | 0.021 | 0.020–0.022 |
| Asian Indian | 20 | 1465 | 0.014 | 0.008–0.020 |
| Black (Sub-Saharan ancestry) | 80 | 8012 | 0.010 | 0.008–0.012 |
| Caucasian | 680 | 31,549 | 0.022 | 0.020–0.023 |
| Hispanic | 127 | 9649 | 0.013 | 0.011–0.015 |
| Jewish | 1059 | 59,196 | 0.018 | 0.017–0.019 |
The results show that the highest frequencies are found in Caucasian and Asian populations (around 1 in 50) and the lowest in Black (1 in 100) and Hispanics (1 in 76) populations. However, it is important to note that genetically Hispanics are a very mixed group, making generalizations difficult. This is also demonstrated by the fact that some studies among Hispanics found much higher frequencies [69, 80], while others found that the frequencies were lower [46].
SMN1 copy number differences between populations
In 2014, MacDonald et al. have performed a meta-analysis comparing the SMA carrier frequency among different ethnicities. In their analysis they included 14 studies where ethnicities were described and results were broken down by SMA copy number [47]. They took the different carrier genotypes described above into account and determined the carrier rates in the ethnic groups. Furthermore, they calculated the reduced risk of being a carrier if a 2- or 3-copy result was found. This again showed a substantially higher carrier risk with a 2-copy test result for Black people. In addition a very high carrier risk and 2-copy risk in Iranians was found. However, this is based on one study only [91].
The Additional file 3 shows all studies that examined at the SMN1 copy number status. None of the studies among Arabian populations performed this analysis, therefore this group has not been included in the table. SMN1 allele frequencies were determined for each group (Table 5) using copy numbers (for methods and calculations see Additional file 1).
Table 5.
SMN1 allele frequencies per ethnicity
| Frequency by number of SMN1 copies on a single allele | ||||||
|---|---|---|---|---|---|---|
| 0 Copies | 1 Copy | 2 Copies | ||||
| Ethnicitya | Portion | 95% CI | Portion | 95% CI | Portion | 95% CI |
| Asian | 0.010 | 0.010–0.011 | 0.949 | 0.948–0.950 | 0.040 | 0.039–0.041 |
| Asian Indianb | 0.010 | 0.006–0.015 | 0.908 | 0.894–0.921 | 0.082 | 0.070–0.095 |
| Black (Sub-Saharan ancestry) | 0.007 | 0.005–0.009 | 0.717 | 0.708–0.725 | 0.276 | 0.268–0.285 |
| Caucasian | 0.011 | 0.010–0.012 | 0.954 | 0.952–0.955 | 0.035 | 0.034–0.037 |
| Hispanic | 0.007 | 0.006–0.008 | 0.915 | 0.911–0.919 | 0.078 | 0.074–0.082 |
| Jewish | 0.010 | 0.009–0.011 | 0.934 | 0.931–0.936 | 0.057 | 0.054–0.059 |
The copy number 0 (carriers) is lower in Blacks and Hispanics. Whilst there is not a great difference in the two copy number frequencies between other ethnicities, this is much higher in the Black population. As is seen in Table 6, this indicates a higher number of hidden carriers (‘2 + 0’ genotype), thereby decreasing the sensitivity of most carrier tests used, which only measure the copy numbers. Therefore, it is important to take the ethnicity into account when performing population screening or genetic counselling and consider a different method to reduce the chance of false negative results. In Table 6 also disease frequencies are estimated by combining the copy number results with an estimated small mutation (1D) frequency of 4% [4, 5] and an estimated de novo mutation frequency of 2% [100]. Thereafter, the incidences rates were estimated using these frequencies (Table 7).
Table 6.
Carrier, SMN1 copy number 2 carrier and disease frequencies per ethnicity
| Adjusted carrier and disease frequencies | ||||||
|---|---|---|---|---|---|---|
| 1 SMN1 copy carriers | 2 SMN1 copies carriers | Disease Frequency | ||||
| Ethnicity | Frequency | 95% CI | Frequency | 95% CI | Frequency | 95% CI |
| Asian | 0.022 | 0.021–0.023 | 0.0014 | 0.0012–0.0015 | 1.3E-04 | 1.2E-04-1.4E-04 |
| Asian Indiana | 0.020 | 0.012–0.030 | 0.0021 | 0.0014–0.0030 | 1.0E-04 | 4.0E-05-2.4E-04 |
| Black (Sub-Saharan ancestry) | 0.014 | 0.011–0.018 | 0.0042 | 0.0034–0.0052 | 5.3E-05 | 3.4E-05-8.1E-05 |
| Caucasian | 0.022 | 0.021–0.024 | 0.0013 | 0.0011–0.0014 | 1.3E-04 | 1.1E-04-1.5E-04 |
| Hispanic | 0.014 | 0.011–0.017 | 0.0015 | 0.0013–0.0018 | 5.0E-05 | 3.5E-05-7.0E-05 |
| Jewish | 0.020 | 0.018–0.022 | 0.0016 | 0.0014–0.0018 | 1.0E-04 | 8.3E-05-1.2E-04 |
Median and 95% posterior intervals of carrier, copy number 2 carriers and disease frequencies. Frequencies calculated based on allele frequencies, small mutation and de novo mutation frequencies (calculations described in Additional File 1)
CI confidence interval
a) Based on results of only one study
Table 7.
Estimated incidence from carrier frequency per ethnicity
| Ethnicity | Incidence estimate (1 in) | 95% CI |
|---|---|---|
| Asian | 8009 | 7382–8684 |
| Asian Indiana | 9655 | 4227–25,057 |
| Black (Sub-Saharan ancestry) | 18,808 | 12,331–29,559 |
| Caucasian | 7829 | 6750–9093 |
| Hispanic | 20,134 | 14,218–28,894 |
| Jewish | 10,000 | 8343–12,038 |
Median and 95% posterior intervals of incidence estimated from carrier and disease frequencies as calculated in Table 6
a) Based on results of only one study
The incorporation of estimated carrier risks for people with a 2 copy number result, generates only a slightly lower incidence (~1 in 54) for the Black populations compared to most other populations (~1 in 45), due to presence of a much higher number of multiple SMN1 copy number alleles in this population. The estimation of the combined carrier frequency in Hispanics is lower than in other populations (1 in 65), as was also seen in the previous estimations. It must be noted however that here only a subset of studies is used compared to the comparison of all studies (Fig. 2 and Table 4), which can also contribute to differences in estimations.
The combined results lead to the highest incidence estimations of around 1 in 8000 in Asians and Caucasians, whilst lower incidence of around 1 in 20,000 are estimated in the Black and Hispanic populations.
In Caucasians, the incidence rate estimated from carrier frequencies is higher than the observed incidence rates in studies (Table 3, ~1 in 11,000). Carrier frequency estimates are solely based on genetic studies, whilst most incidence studies were based on clinical diagnosis and are mostly much older. However, carrier frequency incidence estimates could be an overestimation of the true incidence due to reduced penetrance. Here a penetrance of 100% is assumed. If the penetrance is decreased by 10% (i.e. penetrance of 90%) the incidence would also decrease by 10%. It might be that some cases of SMA are so severe that they lead to premature death in utero. SMN2 is absent in 10–15% of the general population [101], and deletions of both SMN1 and SMN2 are embryonically lethal. Furthermore increased awareness could lead to more genetic counselling of couples at risk, certainly in couples who have previous children or family members with SMA. In addition, sporadic cases of unaffected individuals without functional SMN1 cases have been described [96, 102–109]. This might be due to high copy numbers of SMN2, since, as mentioned before, SMN2 copy number influences the severity of the disease [7–9]. Therefore, it is important to take SMN2 copy number into account when performing newborn screening.
Conclusions
SMA is a severe, heterogeneous, neuromuscular disorder. The few available prevalence and incidence studies mainly predate genetic testing and were performed in small geographical areas, mainly in Europe. This highlights the need for larger, more generalizable prevalence studies.
Recently, carrier frequency of SMA in healthy populations has been studied quite extensively, indicating differences between ethnicities not only in carrier frequency, but also in copy number status. In some groups this decreases the sensitivity of commonly used carrier testing methods. This emphasizes the need to use methods that enable to detect carriers having two SMN1 copies on one chromosome and none on the other.
Good epidemiological data is needed to gain insight into health care needs and for research studies and clinical trials. This is especially important in rare diseases where clinical trials require a careful planning. Furthermore, newborn screening will become increasingly important, especially now a drug has been approved and other new therapies are in advanced clinical trial stages. The introduction of new therapies is also likely to impact on the prevalence of SMA and as such may have significant resource implications for health care planning.
Additional files
Bayesian analysis of copy number frequency, small mutations and de novo mutation rate. (DOCX 26 kb)
Overview carrier frequencies of SMA. (XLS 94 kb)
Copy numbers SMN1 gene in general population. (XLS 52 kb)
Acknowledgments
The Institute of Genetic Medicine in Newcastle is part of the MRC Centre for Neuromuscular Diseases and the TREAT-NMD Alliance. AR receives funding from SMA Support UK. HL is a principal investigator in the MRC Centre for Neuromuscular Diseases.
Funding
The writing of this manuscript was funded by Biogen MA Inc.
Availability of data and materials
The datasets supporting the conclusions of this article are included within the article and its Additional files 1, 2 and 3.
Authors’ contributions
IV performed the literature review, drafted and revised the manuscript. AR, AAR, SC, CJ and SFC reviewed the manuscript and provided comments and suggestions. IW performed the bioinformatical analysis. SC and CJ reviewed the manuscript and reviewed for English language. HL reviewed the manuscript and supervised the process. All authors read and approved the final manuscript.
Competing interests
IV, AR, IW, AAR, SC and HL declare that they have no competing interests. CJ is employed by and stakeholder of Biogen MA Inc. SFC is a consultant to Biogen MA Inc.
Consent for publication
Not applicable.
Ethics approval and consent to participate
Not applicable.
Publisher’s Note
Springer Nature remains neutral with regard to jurisdictional claims in published maps and institutional affiliations.
Abbreviations
- ALS
Amyotrophic lateral sclerosis
- PMA
Progressive muscular atrophy
- SMA
Spinal muscular atrophy
- SMN
Survival motor neuron
Footnotes
Two studies in studies in populations with a high inbreed rate (a Muslim Arab village in Israel and a Hutterite community in South Dakota, USA) are not included in the average.
Electronic supplementary material
The online version of this article (doi:10.1186/s13023-017-0671-8) contains supplementary material, which is available to authorized users.
Contributor Information
Ingrid E. C. Verhaart, Email: ingrid.verhaart@ncl.ac.uk
Agata Robertson, Email: agata.robertson@ncl.ac.uk.
Ian J. Wilson, Email: ian.wilson@ncl.ac.uk
Annemieke Aartsma-Rus, Email: A.M.Aartsma-Rus@lumc.nl.
Shona Cameron, Email: shona.cameron@ncl.ac.uk.
Cynthia C. Jones, Email: cynthia.jones@biogen.com
Suzanne F. Cook, Email: epidemiologyassociatesllc@gmail.com
Hanns Lochmüller, Phone: +44-191-2418602, Email: hanns.lochmuller@ncl.ac.uk.
References
- 1.Finkel R, Bertini E, Muntoni F, Mercuri E. 209th ENMC international workshop: outcome measures and clinical trial readiness in spinal muscular atrophy 7-9 November 2014, Heemskerk, The Netherlands. Neuromuscul Disord. 2015;25:593–602. doi: 10.1016/j.nmd.2015.04.009. [DOI] [PubMed] [Google Scholar]
- 2.Mercuri E, Bertini E, Iannaccone ST. Childhood spinal muscular atrophy: controversies and challenges. Lancet Neurol. 2012;11:443–452. doi: 10.1016/S1474-4422(12)70061-3. [DOI] [PubMed] [Google Scholar]
- 3.Lefebvre S, Burglen L, Reboullet S, Clermont O, Burlet P, et al. Identification and characterization of a spinal muscular atrophy-determining gene. Cell. 1995;80:155–165. doi: 10.1016/0092-8674(95)90460-3. [DOI] [PubMed] [Google Scholar]
- 4.Wirth B, Herz M, Wetter A, Moskau S, Hahnen E, et al. Quantitative analysis of survival motor neuron copies: identification of subtle SMN1 mutations in patients with spinal muscular atrophy, genotype-phenotype correlation, and implications for genetic counseling. Am J Hum Genet. 1999;64:1340–1356. doi: 10.1086/302369. [DOI] [PMC free article] [PubMed] [Google Scholar]
- 5.Alias L, Bernal S, Fuentes-Prior P, Barcelo MJ, Also E, et al. Mutation update of spinal muscular atrophy in Spain: molecular characterization of 745 unrelated patients and identification of four novel mutations in the SMN1 gene. Hum Genet. 2009;125:29–39. doi: 10.1007/s00439-008-0598-1. [DOI] [PubMed] [Google Scholar]
- 6.Burglen L, Lefebvre S, Clermont O, Burlet P, Viollet L, et al. Structure and organization of the human survival motor neurone (SMN) gene. Genomics. 1996;32:479–482. doi: 10.1006/geno.1996.0147. [DOI] [PubMed] [Google Scholar]
- 7.Wirth B, Garbes L, Riessland M. How genetic modifiers influence the phenotype of spinal muscular atrophy and suggest future therapeutic approaches. Curr Opin Genet Dev. 2013;23:330–338. doi: 10.1016/j.gde.2013.03.003. [DOI] [PubMed] [Google Scholar]
- 8.Feldkotter M, Schwarzer V, Wirth R, Wienker TF, Wirth B. Quantitative analyses of SMN1 and SMN2 based on real-time lightCycler PCR: fast and highly reliable carrier testing and prediction of severity of spinal muscular atrophy. Am J Hum Genet. 2002;70:358–368. doi: 10.1086/338627. [DOI] [PMC free article] [PubMed] [Google Scholar]
- 9.Wirth B, Brichta L, Schrank B, Lochmuller H, Blick S, et al. Mildly affected patients with spinal muscular atrophy are partially protected by an increased SMN2 copy number. Hum Genet. 2006;119:422–428. doi: 10.1007/s00439-006-0156-7. [DOI] [PubMed] [Google Scholar]
- 10.Ahn EJ, Yum MS, Kim EH, Yoo HW, Lee BH, et al. Genotype-phenotype correlation of SMN1 and NAIP deletions in Korean patients with spinal muscular atrophy. J Clin Neurol. 2016; [DOI] [PMC free article] [PubMed]
- 11.Amara A, Adala L, Ben Charfeddine I, Mamai O, Mili A, et al. Correlation of SMN2, NAIP, p44, H4F5 and Occludin genes copy number with spinal muscular atrophy phenotype in Tunisian patients. Eur J Paediatr Neurol. 2012;16:167–174. doi: 10.1016/j.ejpn.2011.07.007. [DOI] [PubMed] [Google Scholar]
- 12.He J, Zhang QJ, Lin QF, Chen YF, Lin XZ, et al. Molecular analysis of SMN1, SMN2, NAIP, GTF2H2, and H4F5 genes in 157 Chinese patients with spinal muscular atrophy. Gene. 2013;518:325–329. doi: 10.1016/j.gene.2012.12.109. [DOI] [PubMed] [Google Scholar]
- 13.Oprea GE, Krober S, McWhorter ML, Rossoll W, Muller S, et al. Plastin 3 is a protective modifier of autosomal recessive spinal muscular atrophy. Science. 2008;320:524–527. doi: 10.1126/science.1155085. [DOI] [PMC free article] [PubMed] [Google Scholar]
- 14.Scharf JM, Endrizzi MG, Wetter A, Huang S, Thompson TG, et al. Identification of a candidate modifying gene for spinal muscular atrophy by comparative genomics. Nat Genet. 1998;20:83–86. doi: 10.1038/1753. [DOI] [PubMed] [Google Scholar]
- 15.Watihayati MS, Fatemeh H, Marini M, Atif AB, Zahiruddin WM, et al. Combination of SMN2 copy number and NAIP deletion predicts disease severity in spinal muscular atrophy. Brain Dev. 2009;31:42–45. doi: 10.1016/j.braindev.2008.08.012. [DOI] [PubMed] [Google Scholar]
- 16.Roy N, Mahadevan MS, McLean M, Shutler G, Yaraghi Z, et al. The gene for neuronal apoptosis inhibitory protein is partially deleted in individuals with spinal muscular atrophy. Cell. 1995;80:167–178. doi: 10.1016/0092-8674(95)90461-1. [DOI] [PubMed] [Google Scholar]
- 17.Hosseinibarkooie S, Peters M, Torres-Benito L, Rastetter RH, Hupperich K, et al. The power of human protective modifiers: PLS3 and CORO1C unravel impaired Endocytosis in spinal muscular atrophy and rescue SMA phenotype. Am J Hum Genet. 2016;99:647–665. doi: 10.1016/j.ajhg.2016.07.014. [DOI] [PMC free article] [PubMed] [Google Scholar]
- 18.FDA approves first drug for spinal muscular atrophy [http://www.fda.gov/NewsEvents/Newsroom/PressAnnouncements/ucm534611.htm].
- 19.SPINRAZA® (Nusinersen) Approved in the European Union as First Treatment for Spinal Muscular Atrophy [http://media.biogen.com/press-release/investor-relations/spinraza-nusinersen-approved-european-union-first-treatment-spinal-].
- 20.Lunn MR, Wang CH. Spinal muscular atrophy. Lancet. 2008;371:2120–2133. doi: 10.1016/S0140-6736(08)60921-6. [DOI] [PubMed] [Google Scholar]
- 21.Ogino S, Leonard DG, Rennert H, Ewens WJ, Wilson RB. Genetic risk assessment in carrier testing for spinal muscular atrophy. Am J Med Genet. 2002;110:301–307. doi: 10.1002/ajmg.10425. [DOI] [PubMed] [Google Scholar]
- 22.Merlini L, Stagni SB, Marri E, Granata C. Epidemiology of neuromuscular disorders in the under-20 population in Bologna Province, Italy. Neuromuscul Disord. 1992;2:197–200. doi: 10.1016/0960-8966(92)90006-R. [DOI] [PubMed] [Google Scholar]
- 23.Arkblad E, Tulinius M, Kroksmark AK, Henricsson M, Darin N. A population-based study of genotypic and phenotypic variability in children with spinal muscular atrophy. Acta Paediatr. 2009;98:865–872. doi: 10.1111/j.1651-2227.2008.01201.x. [DOI] [PubMed] [Google Scholar]
- 24.Darin N, Tulinius M. Neuromuscular disorders in childhood: a descriptive epidemiological study from western Sweden. Neuromuscul Disord. 2000;10:1–9. doi: 10.1016/S0960-8966(99)00055-3. [DOI] [PubMed] [Google Scholar]
- 25.Tangsrud SE, Halvorsen S. Child neuromuscular disease in southern Norway. Prevalence, age and distribution of diagnosis with special reference to "non-Duchenne muscular dystrophy". Clin Genet. 1988;34:145–152. doi: 10.1111/j.1399-0004.1988.tb02854.x. [DOI] [PubMed] [Google Scholar]
- 26.Ahlstrom G, Gunnarsson LG, Leissner P, Sjoden PO. Epidemiology of neuromuscular diseases, including the postpolio sequelae, in a Swedish county. Neuroepidemiology. 1993;12:262–269. doi: 10.1159/000110327. [DOI] [PubMed] [Google Scholar]
- 27.Hagberg B, Westerberg B. Hereditary motor and sensory neuropathies in Swedish children. I. Prevalence and distribution by disability groups. Acta Paediatr Scand. 1983;72:379–383. doi: 10.1111/j.1651-2227.1983.tb09732.x. [DOI] [PubMed] [Google Scholar]
- 28.Wesstrom G, Bensch J, Schollin J. Congenital myotonic dystrophy. Incidence, clinical aspects and early prognosis. Acta Paediatr Scand. 1986;75:849–854. doi: 10.1111/j.1651-2227.1986.tb10301.x. [DOI] [PubMed] [Google Scholar]
- 29.al Rajeh S, Bademosi O, Ismail H, Awada A, Dawodu A, et al. A community survey of neurological disorders in Saudi Arabia: the Thugbah study. Neuroepidemiology. 1993;12:164–178. doi: 10.1159/000110316. [DOI] [PubMed] [Google Scholar]
- 30.Ogino S, Wilson RB, Gold B. New insights on the evolution of the SMN1 and SMN2 region: simulation and meta-analysis for allele and haplotype frequency calculations. Eur J Hum Genet. 2004;12:1015–1023. doi: 10.1038/sj.ejhg.5201288. [DOI] [PubMed] [Google Scholar]
- 31.Chung B, Wong V, Ip P. Prevalence of neuromuscular diseases in Chinese children: a study in southern China. J Child Neurol. 2003;18:217–219. doi: 10.1177/08830738030180030201. [DOI] [PubMed] [Google Scholar]
- 32.Norwood FL, Harling C, Chinnery PF, Eagle M, Bushby K, Straub V. Prevalence of genetic muscle disease in Northern England: in-depth analysis of a muscle clinic population. Brain. 2009;132:3175–3186. doi: 10.1093/brain/awp236. [DOI] [PMC free article] [PubMed] [Google Scholar]
- 33.Thieme A, Mitulla B, Schulze F, Spiegler AW. Epidemiological data on Werdnig-Hoffmann disease in Germany (West-Thuringen) Hum Genet. 1993;91:295–297. doi: 10.1007/BF00218278. [DOI] [PubMed] [Google Scholar]
- 34.Vaidla E, Talvik I, Kulla A, Kahre T, Hamarik M, et al. Descriptive epidemiology of spinal muscular atrophy type I in Estonia. Neuroepidemiology. 2006;27:164–168. doi: 10.1159/000096128. [DOI] [PubMed] [Google Scholar]
- 35.Finkel RS, McDermott MP, Kaufmann P, Darras BT, Chung WK, et al. Observational study of spinal muscular atrophy type I and implications for clinical trials. Neurology. 2014;83:810–817. doi: 10.1212/WNL.0000000000000741. [DOI] [PMC free article] [PubMed] [Google Scholar]
- 36.Oskoui M, Levy G, Garland CJ, Gray JM, O'Hagen J, et al. The changing natural history of spinal muscular atrophy type 1. Neurology. 2007;69:1931–1936. doi: 10.1212/01.wnl.0000290830.40544.b9. [DOI] [PubMed] [Google Scholar]
- 37.Chung BH, Wong VC, Ip P. Spinal muscular atrophy: survival pattern and functional status. Pediatrics. 2004;114:e548–e553. doi: 10.1542/peds.2004-0668. [DOI] [PubMed] [Google Scholar]
- 38.Zerres K, Rudnik-Schoneborn S. Natural history in proximal spinal muscular atrophy. Clinical analysis of 445 patients and suggestions for a modification of existing classifications. Arch Neurol. 1995;52:518–523. doi: 10.1001/archneur.1995.00540290108025. [DOI] [PubMed] [Google Scholar]
- 39.Zerres K, Rudnik-Schoneborn S, Forrest E, Lusakowska A, Borkowska J, Hausmanowa-Petrusewicz I. A collaborative study on the natural history of childhood and juvenile onset proximal spinal muscular atrophy (type II and III SMA): 569 patients. J Neurol Sci. 1997;146:67–72. doi: 10.1016/S0022-510X(96)00284-5. [DOI] [PubMed] [Google Scholar]
- 40.Farrar MA, Park SB, Vucic S, Carey KA, Turner BJ, et al. Emerging therapies and challenges in spinal muscular atrophy. Ann Neurol. 2017;81:355–368. doi: 10.1002/ana.24864. [DOI] [PMC free article] [PubMed] [Google Scholar]
- 41.Pearn J. Incidence, prevalence, and gene frequency studies of chronic childhood spinal muscular atrophy. J Med Genet. 1978;15:409–413. doi: 10.1136/jmg.15.6.409. [DOI] [PMC free article] [PubMed] [Google Scholar]
- 42.Spiegler AW, Hausmanowa-Pertrusewicz I, Borkowska J, Klopocka A. Population data on acute infantile and chronic childhood spinal muscular atrophy in Warsaw. Hum Genet. 1990;85:211–214. doi: 10.1007/BF00193198. [DOI] [PubMed] [Google Scholar]
- 43.Thieme A, Mitulla B, Schulze F, Spiegler AW. Chronic childhood spinal muscular atrophy in Germany (West-Thuringen)--an epidemiological study. Hum Genet. 1994;93:344–346. doi: 10.1007/BF00212036. [DOI] [PubMed] [Google Scholar]
- 44.Kvasnicova M, Stykova J, Hudec P. Incidence of spinal muscular atrophy and Duchenne's muscular dystrophy in the juvenile population of central Slovakia. Bratisl Lek Listy. 1994;95:78–82. [PubMed] [Google Scholar]
- 45.Zaldivar T, Montejo Y, Acevedo AM, Guerra R, Vargas J, et al. Evidence of reduced frequency of spinal muscular atrophy type I in the Cuban population. Neurology. 2005;65:636–638. doi: 10.1212/01.wnl.0000172860.41953.12. [DOI] [PubMed] [Google Scholar]
- 46.Hendrickson BC, Donohoe C, Akmaev VR, Sugarman EA, Labrousse P, et al. Differences in SMN1 allele frequencies among ethnic groups within North America. J Med Genet. 2009;46:641–644. doi: 10.1136/jmg.2009.066969. [DOI] [PMC free article] [PubMed] [Google Scholar]
- 47.MacDonald WK, Hamilton D, Kuhle S. SMA carrier testing: a meta-analysis of differences in test performance by ethnic group. Prenat Diagn. 2014;34:1219–1226. doi: 10.1002/pd.4459. [DOI] [PubMed] [Google Scholar]
- 48.Radhakrishnan K, Thacker AK, Maloo JC. A clinical, epidemiological and genetic study of hereditary motor neuropathies in Benghazi, Libya. J Neurol. 1988;235:422–424. doi: 10.1007/BF00314486. [DOI] [PubMed] [Google Scholar]
- 49.Emery AE. Population frequencies of inherited neuromuscular diseases--a world survey. Neuromuscul Disord. 1991;1:19–29. doi: 10.1016/0960-8966(91)90039-U. [DOI] [PubMed] [Google Scholar]
- 50.Czeizel A, Hamula J. A hungarian study on Werdnig-Hoffmann disease. J Med Genet. 1989;26:761–763. doi: 10.1136/jmg.26.12.761. [DOI] [PMC free article] [PubMed] [Google Scholar]
- 51.Ignatius J, Donner M. Epidemiology of childhood disorders (in Finnish) In: H L, editor. Lihastautien Kehittyvä Tutkimus Ja Hoito. Turku: Kiasma; 1989. [Google Scholar]
- 52.Pearn JH. The gene frequency of acute Werdnig-Hoffmann disease (SMA type 1). A total population survey in North-East England. J Med Genet. 1973;10:260–265. doi: 10.1136/jmg.10.3.260. [DOI] [PMC free article] [PubMed] [Google Scholar]
- 53.Burd L, Short SK, Martsolf JT, Nelson RA. Prevalence of type I spinal muscular atrophy in North Dakota. Am J Med Genet. 1991;41:212–215. doi: 10.1002/ajmg.1320410216. [DOI] [PubMed] [Google Scholar]
- 54.Kurland LT. Descriptive epidemiology of selected neurologic and myopathic disorders with particular reference to a survey in Rochester, Minnesota. J Chronic Dis. 1958;8:378–418. doi: 10.1016/0021-9681(58)90002-X. [DOI] [PubMed] [Google Scholar]
- 55.Zellweger H, Hanhart E. The infantile proximal spinal muscular atrophies in Switzerland. Helv Paediatr Acta. 1972;27:355–360. [PubMed] [Google Scholar]
- 56.Ogino S, Wilson RB. Spinal muscular atrophy: molecular genetics and diagnostics. Expert Rev Mol Diagn. 2004;4:15–29. doi: 10.1586/14737159.4.1.15. [DOI] [PubMed] [Google Scholar]
- 57.Prior TW, Nagan N, Sugarman EA, Batish SD, Braastad C. Technical standards and guidelines for spinal muscular atrophy testing. Genet Med. 2011;13:686–694. doi: 10.1097/GIM.0b013e318220d523. [DOI] [PubMed] [Google Scholar]
- 58.Butchbach ME. Copy number variations in the survival motor neuron genes: implications for spinal muscular atrophy and other neurodegenerative diseases. Front Mol Biosci. 2016;3:7. doi: 10.3389/fmolb.2016.00007. [DOI] [PMC free article] [PubMed] [Google Scholar]
- 59.Kuzma-Kozakiewicz M, Jedrzejowska M, Kazmierczak B. SMN1 gene duplications are more frequent in patients with progressive muscular atrophy. Amyotroph Lateral Scler Frontotemporal Degener. 2013;14:457–462. doi: 10.3109/21678421.2013.771367. [DOI] [PubMed] [Google Scholar]
- 60.Ben-Shachar S, Orr-Urtreger A, Bardugo E, Shomrat R, Yaron Y. Large-scale population screening for spinal muscular atrophy: clinical implications. Genet Med. 2011;13:110–114. doi: 10.1097/GIM.0b013e3182017c05. [DOI] [PubMed] [Google Scholar]
- 61.Su YN, Hung CC, Lin SY, Chen FY, Chern JP, et al. Carrier screening for spinal muscular atrophy (SMA) in 107,611 pregnant women during the period 2005-2009: a prospective population-based cohort study. PLoS One. 2011;6:e17067. doi: 10.1371/journal.pone.0017067. [DOI] [PMC free article] [PubMed] [Google Scholar]
- 62.Sugarman EA, Nagan N, Zhu H, Akmaev VR, Zhou Z, et al. Pan-ethnic carrier screening and prenatal diagnosis for spinal muscular atrophy: clinical laboratory analysis of >72,400 specimens. Eur J Hum Genet. 2012;20:27–32. doi: 10.1038/ejhg.2011.134. [DOI] [PMC free article] [PubMed] [Google Scholar]
- 63.Sukenik-Halevy R, Pesso R, Garbian N, Magal N, Shohat M. Large-scale population carrier screening for spinal muscular atrophy in Israel--effect of ethnicity on the false-negative rate. Genet Test Mol Biomarkers. 2010;14:319–324. doi: 10.1089/gtmb.2009.0089. [DOI] [PubMed] [Google Scholar]
- 64.Zlotogora J, Grotto I, Kaliner E, Gamzu R. The Israeli national population program of genetic carrier screening for reproductive purposes. Genet Med. 2016;18:203–206. doi: 10.1038/gim.2015.55. [DOI] [PubMed] [Google Scholar]
- 65.Labrum R, Rodda J, Krause A. The molecular basis of spinal muscular atrophy (SMA) in South African black patients. Neuromuscul Disord. 2007;17:684–692. doi: 10.1016/j.nmd.2007.05.005. [DOI] [PubMed] [Google Scholar]
- 66.Sangare M, Hendrickson B, Sango HA, Chen K, Nofziger J, et al. Genetics of low spinal muscular atrophy carrier frequency in sub-Saharan Africa. Ann Neurol. 2014;75:525–532. doi: 10.1002/ana.24114. [DOI] [PMC free article] [PubMed] [Google Scholar]
- 67.Sheng-Yuan Z, Xiong F, Chen YJ, Yan TZ, Zeng J, et al. Molecular characterization of SMN copy number derived from carrier screening and from core families with SMA in a Chinese population. Eur J Hum Genet. 2010;18:978–984. doi: 10.1038/ejhg.2010.54. [DOI] [PMC free article] [PubMed] [Google Scholar]
- 68.Chan V, Yip B, Yam I, Au P, Lin CK, et al. Carrier incidence for spinal muscular atrophy in southern Chinese. J Neurol. 2004;251:1089–1093. doi: 10.1007/s00415-004-0487-z. [DOI] [PubMed] [Google Scholar]
- 69.Contreras-Capetillo SN, Blanco HL, Cerda-Flores RM, Lugo-Trampe J, Torres-Munoz I, et al. Frequency of deletion carriers in a Mestizo population of central and northeastern Mexico: a pilot study. Exp Ther Med. 2015;9:2053–2058. doi: 10.3892/etm.2015.2436. [DOI] [PMC free article] [PubMed] [Google Scholar]
- 70.Goncalves-Rocha M, Oliveira J, Rodrigues L, Santos R. New approaches in molecular diagnosis and population carrier screening for spinal muscular atrophy. Genet Test Mol Biomarkers. 2011;15:319–326. doi: 10.1089/gtmb.2010.0164. [DOI] [PubMed] [Google Scholar]
- 71.Landaburu I, Gonzalvo MC, Clavero A, Ramirez JP, Yoldi A, et al. Genetic testing of sperm donors for cystic fibrosis and spinal muscular atrophy: evaluation of clinical utility. Eur J Obstet Gynecol Reprod Biol. 2013;170:183–187. doi: 10.1016/j.ejogrb.2013.06.022. [DOI] [PubMed] [Google Scholar]
- 72.Cali F, Ruggeri G, Chiavetta V, Scuderi C, Bianca S, et al. Carrier screening for spinal muscular atrophy in Italian population. J Genet. 2014;93:179–181. doi: 10.1007/s12041-014-0323-x. [DOI] [PubMed] [Google Scholar]
- 73.Jedrzejowska M, Milewski M, Zimowski J, Zagozdzon P, Kostera-Pruszczyk A, et al. Incidence of spinal muscular atrophy in Poland--more frequent than predicted? Neuroepidemiology. 2010;34:152–157. doi: 10.1159/000275492. [DOI] [PubMed] [Google Scholar]
- 74.Lyahyai J, Sbiti A, Barkat A, Ratbi I, Sefiani A. Spinal muscular atrophy carrier frequency and estimated prevalence of the disease in Moroccan newborns. Genet Test Mol Biomarkers. 2012;16:215–218. doi: 10.1089/gtmb.2011.0149. [DOI] [PubMed] [Google Scholar]
- 75.Wang KC, Chang CC, Chang YF, Wang SH, Chiang CK, Tsai CP. Evaluation and characterization of a high-resolution melting analysis kit for rapid carrier-screening test of spinal muscular atrophy. J Neurogenet. 2015;29:113–116. doi: 10.3109/01677063.2015.1033098. [DOI] [PubMed] [Google Scholar]
- 76.Chen TH, Tzeng CC, Wang CC, Wu SM, Chang JG, et al. Identification of bidirectional gene conversion between SMN1 and SMN2 by simultaneous analysis of SMN dosage and hybrid genes in a Chinese population. J Neurol Sci. 2011;308:83–87. doi: 10.1016/j.jns.2011.06.002. [DOI] [PubMed] [Google Scholar]
- 77.Luo M, Liu L, Peter I, Zhu J, Scott SA, et al. An Ashkenazi Jewish SMN1 haplotype specific to duplication alleles improves pan-ethnic carrier screening for spinal muscular atrophy. Genet Med. 2014;16:149–156. doi: 10.1038/gim.2013.84. [DOI] [PubMed] [Google Scholar]
- 78.Callum P, Iger J, Ray M, Sims CA, Falk RE. Outcome and experience of implementing spinal muscular atrophy carrier screening on sperm donors. Fertil Steril. 2010;94:1912–1914. doi: 10.1016/j.fertnstert.2009.12.071. [DOI] [PubMed] [Google Scholar]
- 79.Bueno KC, Gouvea SP, Genari AB, Funayama CA, Zanette DL, et al. Detection of spinal muscular atrophy carriers in a sample of the Brazilian population. Neuroepidemiology. 2011;36:105–108. doi: 10.1159/000324156. [DOI] [PubMed] [Google Scholar]
- 80.Larson JL, Silver AJ, Chan D, Borroto C, Spurrier B, Silver LM. Validation of a high resolution NGS method for detecting spinal muscular atrophy carriers among phase 3 participants in the 1000 genomes project. BMC Med Genet. 2015;16:100. doi: 10.1186/s12881-015-0246-2. [DOI] [PMC free article] [PubMed] [Google Scholar]
- 81.Chong JX, Oktay AA, Dai Z, Swoboda KJ, Prior TW, Ober C. A common spinal muscular atrophy deletion mutation is present on a single founder haplotype in the US Hutterites. Eur J Hum Genet. 2011;19:1045–1051. doi: 10.1038/ejhg.2011.85. [DOI] [PMC free article] [PubMed] [Google Scholar]
- 82.Anhuf D, Eggermann T, Rudnik-Schoneborn S, Zerres K. Determination of SMN1 and SMN2 copy number using TaqMan technology. Hum Mutat. 2003;22:74–78. doi: 10.1002/humu.10221. [DOI] [PubMed] [Google Scholar]
- 83.Corcia P, Camu W, Halimi JM, Vourc'h P, Antar C, et al. SMN1 gene, but not SMN2, is a risk factor for sporadic ALS. Neurology. 2006;67:1147–1150. doi: 10.1212/01.wnl.0000233830.85206.1e. [DOI] [PubMed] [Google Scholar]
- 84.Corcia P, Ingre C, Blasco H, Press R, Praline J, et al. Homozygous SMN2 deletion is a protective factor in the Swedish ALS population. Eur J Hum Genet. 2012;20:588–591. doi: 10.1038/ejhg.2011.255. [DOI] [PMC free article] [PubMed] [Google Scholar]
- 85.Cusin V, Clermont O, Gerard B, Chantereau D, Elion J. Prevalence of SMN1 deletion and duplication in carrier and normal populations: implication for genetic counselling. J Med Genet. 2003;40:e39. doi: 10.1136/jmg.40.4.e39. [DOI] [PMC free article] [PubMed] [Google Scholar]
- 86.Gerard B, Ginet N, Matthijs G, Evrard P, Baumann C, et al. Genotype determination at the survival motor neuron locus in a normal population and SMA carriers using competitive PCR and primer extension. Hum Mutat. 2000;16:253–263. doi: 10.1002/1098-1004(200009)16:3<253::AID-HUMU8>3.0.CO;2-8. [DOI] [PubMed] [Google Scholar]
- 87.Veldink JH, Kalmijn S, Van der Hout AH, Lemmink HH, Groeneveld GJ, et al. SMN genotypes producing less SMN protein increase susceptibility to and severity of sporadic ALS. Neurology. 2005;65:820–825. doi: 10.1212/01.wnl.0000174472.03292.dd. [DOI] [PubMed] [Google Scholar]
- 88.Veldink JH, van den Berg LH, Cobben JM, Stulp RP, De Jong JM, et al. Homozygous deletion of the survival motor neuron 2 gene is a prognostic factor in sporadic ALS. Neurology. 2001;56:749–752. doi: 10.1212/WNL.56.6.749. [DOI] [PubMed] [Google Scholar]
- 89.Basel-Vanagaite L, Taub E, Drasinover V, Magal N, Brudner A, et al. Genetic carrier screening for spinal muscular atrophy and spinal muscular atrophy with respiratory distress 1 in an isolated population in Israel. Genet Test. 2008;12:53–56. doi: 10.1089/gte.2007.0030. [DOI] [PubMed] [Google Scholar]
- 90.Chen KL, Wang YL, Rennert H, Joshi I, Mills JK, et al. Duplications and de novo deletions of the SMNt gene demonstrated by fluorescence-based carrier testing for spinal muscular atrophy. Am J Med Genet. 1999;85:463–469. doi: 10.1002/(SICI)1096-8628(19990827)85:5<463::AID-AJMG6>3.0.CO;2-V. [DOI] [PubMed] [Google Scholar]
- 91.Hasanzad M, Azad M, Kahrizi K, Saffar BS, Nafisi S, et al. Carrier frequency of SMA by quantitative analysis of the SMN1 deletion in the Iranian population. Eur J Neurol. 2010;17:160–162. doi: 10.1111/j.1468-1331.2009.02693.x. [DOI] [PubMed] [Google Scholar]
- 92.Huang CH, Chang YY, Chen CH, Kuo YS, Hwu WL, et al. Copy number analysis of survival motor neuron genes by multiplex ligation-dependent probe amplification. Genet Med. 2007;9:241–248. doi: 10.1097/GIM.0b013e31803d35bc. [DOI] [PubMed] [Google Scholar]
- 93.Lee TM, Kim SW, Lee KS, Jin HS, Koo SK, et al. Quantitative analysis of SMN1 gene and estimation of SMN1 deletion carrier frequency in Korean population based on real-time PCR. J Korean Med Sci. 2004;19:870–873. doi: 10.3346/jkms.2004.19.6.870. [DOI] [PMC free article] [PubMed] [Google Scholar]
- 94.Mailman MD, Heinz JW, Papp AC, Snyder PJ, Sedra MS, et al. Molecular analysis of spinal muscular atrophy and modification of the phenotype by SMN2. Genet Med. 2002;4:20–26. doi: 10.1097/00125817-200201000-00004. [DOI] [PubMed] [Google Scholar]
- 95.Majumdar R, Rehana Z, Al Jumah M, Fetaini N. Spinal muscular atrophy carrier screening by multiplex polymerase chain reaction using dried blood spot on filter paper. Ann Hum Genet. 2005;69:216–221. doi: 10.1046/j.1469-1809.2004.00149.x. [DOI] [PubMed] [Google Scholar]
- 96.McAndrew PE, Parsons DW, Simard LR, Rochette C, Ray PN, et al. Identification of proximal spinal muscular atrophy carriers and patients by analysis of SMNT and SMNC gene copy number. Am J Hum Genet. 1997;60:1411–1422. doi: 10.1086/515465. [DOI] [PMC free article] [PubMed] [Google Scholar]
- 97.Yoon S, Lee CH, Lee KA. Determination of SMN1 and SMN2 copy numbers in a Korean population using multiplex ligation-dependent probe amplification. Korean J Lab Med. 2010;30:93–96. doi: 10.3343/kjlm.2010.30.1.93. [DOI] [PubMed] [Google Scholar]
- 98.Ogino S, Leonard DG, Rennert H, Wilson RB. Spinal muscular atrophy genetic testing experience at an academic medical center. J Mol Diagn. 2002;4:53–58. doi: 10.1016/S1525-1578(10)60680-0. [DOI] [PMC free article] [PubMed] [Google Scholar]
- 99.Smith M, Calabro V, Chong B, Gardiner N, Cowie S, du Sart D. Population screening and cascade testing for carriers of SMA. Eur J Hum Genet. 2007;15:759–766. doi: 10.1038/sj.ejhg.5201821. [DOI] [PubMed] [Google Scholar]
- 100.Wirth B, Schmidt T, Hahnen E, Rudnik-Schoneborn S, Krawczak M, et al. De novo rearrangements found in 2% of index patients with spinal muscular atrophy: mutational mechanisms, parental origin, mutation rate, and implications for genetic counseling. Am J Hum Genet. 1997;61:1102–1111. doi: 10.1086/301608. [DOI] [PMC free article] [PubMed] [Google Scholar]
- 101.Prior TW, Snyder PJ, Rink BD, Pearl DK, Pyatt RE, et al. Newborn and carrier screening for spinal muscular atrophy. Am J Med Genet A. 2010;152A:1608–1616. doi: 10.1002/ajmg.a.33474. [DOI] [PubMed] [Google Scholar]
- 102.Jedrzejowska M, Borkowska J, Zimowski J, Kostera-Pruszczyk A, Milewski M, et al. Unaffected patients with a homozygous absence of the SMN1 gene. Eur J Hum Genet. 2008;16:930–934. doi: 10.1038/ejhg.2008.41. [DOI] [PubMed] [Google Scholar]
- 103.Prior TW, Swoboda KJ, Scott HD, Hejmanowski AQ. Homozygous SMN1 deletions in unaffected family members and modification of the phenotype by SMN2. Am J Med Genet A. 2004;130A:307–310. doi: 10.1002/ajmg.a.30251. [DOI] [PMC free article] [PubMed] [Google Scholar]
- 104.Jones C, Cook S, Hobby K, Jarecki J. SMA subtype concordance in siblings: findings from the cure SMA cohort. Neuromuscul Disord. 2016; [DOI] [PMC free article] [PubMed]
- 105.Cobben JM, van der Steege G, Grootscholten P, de Visser M, Scheffer H, Buys CH. Deletions of the survival motor neuron gene in unaffected siblings of patients with spinal muscular atrophy. Am J Hum Genet. 1995;57:805–808. [PMC free article] [PubMed] [Google Scholar]
- 106.DiDonato CJ, Ingraham SE, Mendell JR, Prior TW, Lenard S, et al. Deletion and conversion in spinal muscular atrophy patients: is there a relationship to severity? Ann Neurol. 1997;41:230–237. doi: 10.1002/ana.410410214. [DOI] [PubMed] [Google Scholar]
- 107.Hahnen E, Forkert R, Marke C, Rudnik-Schoneborn S, Schonling J, et al. Molecular analysis of candidate genes on chromosome 5q13 in autosomal recessive spinal muscular atrophy: evidence of homozygous deletions of the SMN gene in unaffected individuals. Hum Mol Genet. 1995;4:1927–1933. doi: 10.1093/hmg/4.10.1927. [DOI] [PubMed] [Google Scholar]
- 108.Somerville MJ, Hunter AG, Aubry HL, Korneluk RG, MacKenzie AE, Surh LC. Clinical application of the molecular diagnosis of spinal muscular atrophy: deletions of neuronal apoptosis inhibitor protein and survival motor neuron genes. Am J Med Genet. 1997;69:159–165. doi: 10.1002/(SICI)1096-8628(19970317)69:2<159::AID-AJMG8>3.0.CO;2-K. [DOI] [PubMed] [Google Scholar]
- 109.Wang CH, Xu J, Carter TA, Ross BM, Dominski MK, et al. Characterization of survival motor neuron (SMNT) gene deletions in asymptomatic carriers of spinal muscular atrophy. Hum Mol Genet. 1996;5:359–365. doi: 10.1093/hmg/5.3.359. [DOI] [PubMed] [Google Scholar]
- 110.Hughes MI, Hicks EM, Nevin NC, Patterson VH. The prevalence of inherited neuromuscular disease in Northern Ireland. Neuromuscul Disord. 1996;6:69–73. doi: 10.1016/0960-8966(94)00017-4. [DOI] [PubMed] [Google Scholar]
- 111.Winsor EJ, Murphy EG, Thompson MW, Reed TE. Genetics of childhood spinal muscular atrophy. J Med Genet. 1971;8:143–148. doi: 10.1136/jmg.8.2.143. [DOI] [PMC free article] [PubMed] [Google Scholar]
- 112.Ludvigsson P, Olafsson E, Hauser WA. Spinal muscular atrophy. Incidence in Iceland. Neuroepidemiology. 1999;18:265–269. doi: 10.1159/000026221. [DOI] [PubMed] [Google Scholar]
- 113.MacMillan JC, Harper PS. Single-gene neurological disorders in South Wales: an epidemiological study. Ann Neurol. 1991;30:411–414. doi: 10.1002/ana.410300314. [DOI] [PubMed] [Google Scholar]
- 114.Mostacciuolo ML, Danieli GA, Trevisan C, Muller E, Angelini C. Epidemiology of spinal muscular atrophies in a sample of the Italian population. Neuroepidemiology. 1992;11:34–38. doi: 10.1159/000110905. [DOI] [PubMed] [Google Scholar]
- 115.Pascalet-Guidon MJ, Bois E, Feingold J, Mattei JF, Combes JC, Hamon C. Cluster of acute infantile spinal muscular atrophy (Werdnig-Hoffmann disease) in a limited area of Reunion Island. Clin Genet. 1984;26:39–42. doi: 10.1111/j.1399-0004.1984.tb00785.x. [DOI] [PubMed] [Google Scholar]
- 116.Fried K, Mundel G. High incidence of spinal muscular atrophy type I (Werdnig - Hoffmann disease) in the Karaite community in Israel. Clin Genet. 1977;12:250–251. doi: 10.1111/j.1399-0004.1977.tb00934.x. [DOI] [PubMed] [Google Scholar]
Associated Data
This section collects any data citations, data availability statements, or supplementary materials included in this article.
Supplementary Materials
Bayesian analysis of copy number frequency, small mutations and de novo mutation rate. (DOCX 26 kb)
Overview carrier frequencies of SMA. (XLS 94 kb)
Copy numbers SMN1 gene in general population. (XLS 52 kb)
Data Availability Statement
The datasets supporting the conclusions of this article are included within the article and its Additional files 1, 2 and 3.