

Abstract
Electronic cigarettes (e-cig) have been introduced as a nicotine replacement therapy and have gained increasing attention and popularity. However, while findings on possible toxicological implications continue to grow, major knowledge gaps on both the complex chemistry of the exposure and toxicity exist, prohibiting public health assessors from assessing risks. Here a versatile electronic cigarette exposure generation system (Ecig-EGS) has been developed and characterized. Ecig-EGS allows generation of real world e-cig emission profiles under controlled operational conditions, real time monitoring and time-integrated particle/gas sampling for physico-chemical characterization, and toxicological assessment (both in vitro and in vivo). The platform is highly versatile and can be used with all e-cig types. It enables generation of precisely controlled e-cig exposure while critical operational parameters and environmental mixing conditions can be adjusted in a systematic manner to assess their impact on complex chemistry and toxicity of emissions. Results proved the versatility and reproducibility of Ecig-EGS. E-cig emission was found to contain 106 – 107 particles/cm3 with the mode diameter around 200nm, under air change rate of 60/h. Elevated CO2 and volatile organic specie generation was also observed. Furthermore, environmental mixing conditions also influenced e-cig emission profile. The versatility of Ecig-EGS will enable linking of operational and environmental parameters with exposure chemistry and toxicology and help in assessing health risks.
Keywords: Electronic cigarette, particulate matter, smoking, vaping, exposure assessment, exposure platform
Introduction
With the increase regulation of conventional cigarettes and their ban from public places, electronic cigarettes (e-cig), have emerged and advertised as nicotine replacement treatment (NRT) for smoking cessation (Dockrell et al. 2013; Berg et al. 2015). E-cigs are battery-operated devices vaporizing nicotine, flavors and other additives to simulate conventional smoking experience. E-cigs can be categorized in three broad types: 1) a disposable cigarette-like device (cig-a-like); 2) a mid-sized Vape Pen with a disposable tank; and 3) an advance personal vaporizer (APV) with a refillable tank (Lerner et al. 2015; Kosmider et al. 2014). After first introduced to the market by a Chinese pharmacist Hon Lik in 2004, the global production and sales of e-cigs have grown considerably, and are expected to continue in this trend. In 2014, there were already 466 individual e-cig brands with over 7700 flavors (Zhu et al. 2014) with global sales of $7 billion (Evans. 2015). With e-cig advertisement expanding, the use of e-cig also has been increasing contiguously (Kim et al. 2014; King et al. 2015) especially among adolescence (Wang et al. 2015; White et al. 2015). The consumers, however, have little knowledge on e-cig liquid ingredients and possible exposure health effects (Coleman et al. 2015).
Scientific knowledge on e-cig exposure and its physico-chemical properties continues to grow, associating their usage with exposure to particulate matter (PM) and gaseous pollutants (World Health Organization 2014). Exposure level can reach the range of 109 particles/cm3 (Ingebrethsen et al. 2012; Fuoco et al. 2014; Marini et al. 2014). Although some discrepancies in particle peak size was reported, ranging from 24–36nm (Schober et al. 2014) to 250–450nm (Ingebrethsen et al. 2012), the majority of literature reported peak PM size in the range of 100nm–200nm (Zhang et al. 2013; Fuoco et al. 2014; Marini et al. 2014). Moreover, many researchers found that e-cig can expose the consumers to a complex mixture of chemicals, including propylene glycol, glycerin, nicotine, carbonyls, volatile organic compounds (VOCs) and metals (Westenberger 2009; Trehy et al. 2011; Goniewicz et al. 2012; Pellegrino et al. 2012; Williams et al. 2013; Allen et al. 2015; Herrington & Myers 2015). Furthermore, some early studies claimed that smoking e-cig did not generated carcinogenic combustion by-products and thus was safer than conventional cigarettes (Laugesen et al.; Laugesen 2008). More specifically, several studies showed that compared to conventional cigarettes, e-cig generated less VOCs, carbonyls, polycyclic aromatic hydrocarbon (PAH) and metals by characterizing e-cig mainstream exposure (McAuley et al. 2012; Cervellati et al. 2014; Goniewicz et al. 2014; Tayyarah & Long 2014) and exhaled breath of smokers (Marco & Grimalt 2015). Also, urine biomarker measurement on toxicant and carcinogen metabolites of e-cig users showed significantly lower levels compared to tobacco cigarette users (Hecht et al. 2015). It is noteworthy that only limited studies have been focusing on e-cig emission profile, characterizing both PM and gas generation with several studies only characterized e-liquids used in various products instead of the e-cig emission (Etter et al. 2013; Cameron et al. 2014; Cheah et al. 2014). More importantly, the literature on physico-chemical characterization of emission profile is inconsistent and flooded with contradictory data because of the lack of a harmonized methodology on the generation of controlled real world exposure profiles (Pisinger & Døssing 2014). In fact, many discrepancies in literature can be attributed to the random and sometimes not reported properly type of e-cig (i.e. disposable cig-a-like or large refillable APV) (McAuley et al. 2012; Jensen et al. 2015), e-cig operating parameters (i.e. applied voltage, ranging from 3.2V to 5.0V) (Kosmider et al. 2014; Jensen et al. 2015), puffing protocol (i.e. puff duration ranging from 1.8s to 8s) (Goniewicz et al. 2012; Allen et al. 2015), and environmental conditions (i.e. residence time, temperature and relative humidity) (McAuley et al. 2012; Zhang et al. 2013). Such a systematic investigation of e-cig operating parameters, which is imperative to understand their effect on e-cig emission profile, emission formation mechanism, and biological effects, is currently missing and inhibits toxicologists and risk assessors to properly assess health implications (Goniewicz et al. 2012; Farsalinos et al. 2014; Kosmider et al. 2014; Jensen et al. 2015).
The high PM level, size distribution and the presence of chemicals in e-cig emission raise concerns on their potential deposition in respiratory tract and biological effects (Strak et al. 2012; Kim et al. 2015). The toxicity of e-cig emission is poorly understood, although evidence continues to grow. Both refill e-liquids and aerosol emission from e-cigs were found to cause cellular responses in in vitro toxicity studies pointing to potential mechanistic disease pathways (Behar et al. 2014; Rubenstein et al. 2015). Moreover, in vivo studies found that e-cig emission inhalation can cause deleterious effects to the lung and beyond (C.A. Lerner et al. 2015; Salturk et al. 2015). It is worth noting that such toxicological studies utilized e-cig liquid instillation, which cannot reflect real e-cig exposure because chemical transformation can happen during e-liquid vaporization (Lim & Kim 2014). Another major limitation of the current toxicological studies is the lack of dosimetry consideration, and the inability to link real-world PM exposures with toxicity (Cohen et al. 2015; DeLoid et al. 2015; Pal et al. 2015; Rubenstein et al. 2015; Cohen et al. 2014; Deloid et al. 2014; Cohen et al. 2013). Therefore, there is an urgent need to develop an integrated exposure generation platform that enables the systematic investigation of the emission profile and its physico-chemical properties, that can be used in both in-vitro and in-vivo toxicity assessment studies.
In order to address the above issues, an integrated exposure platform that enables the systematic physico-chemical and toxicological characterizations of e-cig emission was developed and evaluated here. The platform’s versatility, in terms of using various e-cig types, e-cig operational parameters, and environmental conditions, was demonstrated. Further, the effect of these parameters on the PM mass and number concentrations, size distribution, as well as CO, CO2 and VOCs levels was assessed using state of the art real time and time integrated instrumentation.
Methods
Electronic cigarette Exposure Generation System (Ecig-EGS)
Figure 1 illustrates Ecig-EGS platform. It consists of four major components: 1) E-cig generator and environmental mixing chamber; 2) Real time PM and gaseous pollutant monitoring; 3) Size fractionated, time-integrated PM sampling for off line physico-chemical and in-vitro/instillation toxicity characterization; 4) Inhalation chambers for in vivo inhalation toxicological assessment. In more detail:
Figure 1.
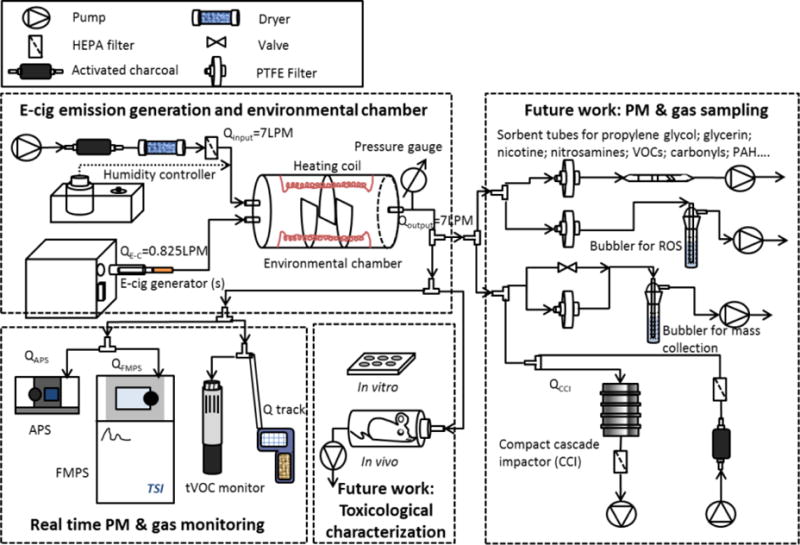
Electronic cigarette exposure generation system (Ecig-EGS).
E-cig generator
A single port e-cig generator (ECAG, e~Aerosols, LLC, Central Valley, NY) was used to generate e-cig emission. ECAG is a versatile device that was designed to accommodate e-cig smoking style (Lauterstein et al. 2016).The e-cig emissions are generated utilizing a “push through” air flow approach which does not require e-cig emission to go through pumps, which may introduce artifacts. Generator can be used with all major e-cig types (i.e. disposable cig-alike, mid-sized Vape Pen with disposable tank and large APV). An internal pump was used to supply the required flow for e-cig usage. The air used to generate e-cig emission was passed through a charcoal filter to remove VOCs and a high-efficiency particulate arrestance (HEPA) filter to remove any particles. Further for the mid-sized Vape Pen and the APVs, ECAG can control the voltage to operate the e-cig (2.1 – 5.7V). Its operation was fully programmable and can be used to simulate a variety of puffing protocols by adjusting puff duration, volume and interval. The puff volume can also be adjusted by changing the flow rate of the supplied air.
Environmental mixing chamber
ECAG was connected to a 7 liter environmental mixing chamber. The chamber is cylindrically-shaped and made of acrylic glass. The end-caps were held in place with spring loaded latches that allowed caps to be removed and cleaned. Compression foam was used to ensure airtight seal. Each cap had two tube connection points. Mixing chamber had three flaps in the center that were arranged to create turbulent flow and facilitate mixing and homogenization of e-cig emission. In order to minimize PM deposition and potential adsorption of the e-cig emission, all internal surfaces of the chamber were covered with Teflon. A small window was left uncovered to visually confirm the e-cig emission generation. The chamber was repeatedly tested for air leaks before each generation experiment. After each experiment the chamber caps were removed and the whole chamber, along with tubing and connectors were cleaned throughout with ethanol and dried with HEPA-filtered air. A magnehelic gauge was used to monitor the pressure changes.
The generated e-cig emission was mixed and diluted with air in the mixing chamber in order to simulate mixing conditions and ventilation. The dilution air was treated with an activated charcoal filter (Pall Life Sciences, Port Washington, NY) to remove ambient VOCs. A Whatman HEPA filter (GE Healthcare Life Sciences, Pittsburgh, PA) was also installed in series to remove background particles. The air flow was adjustable to achieve the desired dilution ratio in the mixing chamber. The residence time for e-cig emission in the chamber can be adjusted by controlling the total input and output air flows. In addition, the chamber was featured with temperature (T) and humidity control. To control the temperature, the chamber was wrapped with a low temperature heating coil that can raise the temperature of the chamber to 37°C. For controlling the humidity, the input air can be passed through a bubbler, which was placed on a Pierce Reacti-therm heating module (Thermo Scientific, Rockford, IL) to generate water vapour using deionized water. It is worth mentioning that the E-cig-EGS exposure system is a “modular” system. The system can be scaled up by using multiple e-cig generators in parallel combined with larger environmental chamber to accommodate higher flow rates when needed for large volume inhalation studies.
Real time PM and gaseous pollutant monitoring
PM size and number concentrations were monitored using real time instrumentation. A fast mobility particle sizer (FMPS, Model 3091, TSI Inc., Shoreview, MN) was used to monitor particle size ranged from approximately 5 to 500 nm (mobility diameter). FMPS sampling flow rate was fixed at 10LPM. The input flow was diluted 1:20 with HEPA filtered air (GE Healthcare Life Sciences, Pittsburgh, PA) to adjust for the FMPS sampling flow rate. An aerodynamic particle sizer (APS, Model 3321, TSI Inc., Shoreview, MN) was used to monitor size and concentration in real time for particles in the range of 0.5 to 20 μm (aerodynamic diameter). APS sampling rate was 5LPM without any dilution. The FMPS and APS sampling intervals were set to 60s.
In addition, the gaseous pollutants (CO and CO2) and environmental conditions (T and RH) were monitored using Q-Trak (Model 8551, TSI Inc., Shoreview, MN). The total VOC levels were also monitored with a photo ionization detector (tVOC monitor, GrayWolf Sensing Solutions, Shelton, CT).
Time-integrated, size fractionated PM sampling for physico-chemical and toxicological characterization
The Harvard compact cascade impactor (CCI) (Pirela et al. 2016; Pal et al. 2015; Pirela et al. 2014; Demokritou et al. 2004) was connected to e-cig mixing chamber for size-fractioned sampling. Particles were size fractionated and collected in three size fractions: PM0.1, PM0.1–2.5, PM2.5–10. A 47mm polytetrafluoroethylene (PTFE) filter was used to collect PM0.1 size fraction; polyurethane foam (PUF) impaction substrates were used for PM0.1–2.5 and PM2.5–10 size fractions. Total sampling duration was 15 minutes. The PUF and filters were conditioned in temperature and humidity controlled environment (24°C and 40%RH) for 48 hours before pre-and post- sampling and then weighed in order to calculate the mass size distribution using a Mettler Toledo XPE analytical microbalance (Mettler-Toledo LLC, Columbus, OH).
In vitro and in vivo toxicological assessment
Ecig-EGS can be used for both in vitro and in vivo toxicological characterization. The size fractionated PM collected using the CCI can be extracted, dispersed into liquid suspension and characterized according to previous established methodology developed by the authors (Pal et al. 2015; Chang et al. 2013). Particle suspension can be used to expose cells to access cellular effects (Watson et al. 2014; Lu et al. 2015; Sisler et al. 2015) or to study in vivo biological responses by intratracheal instillation (Pirela et al. 2013; Pirela et al. 2016). Moreover, Ecig-EGS can be connected to air-liquid–interface platform to directly expose cells to e-cig aerosol emission (Brobell et al. 2013). Ecig-EGS can also be used to provide output for in vivo animal inhalation studies. Please note that in this paper only data associated with the development and physico-chemical characterization of PM are reported and toxicity data will be included in upcoming manuscripts.
Ecig-EGS platform characterization experiments
In summary, the versatile Ecig-EGS enables the adjustment of e-cig type and its critical operational parameters and environmental conditions in the mixing chamber. In more detail the following parameters could be adjusted in a systematic manner to assess their effect on the exposure profile of the emissions: 1) e-cig type; 2) puffing protocol, which defines the puffing regime (puff volume, duration and interval); 3) applied voltage, which influences e-liquid vaporization temperature; 4) residence time, which is defined as the amount of time e-cig emission stayed in the mixing chamber. Residence time can be converted and expressed as air change rate, which is defined as how many times the air will be replaced in the mixing chamber in one hour (ACH); and 5) T and relative humidity (RH) of the mixing chamber.
The Ecig-EGS performance was assessed in terms of reproducibility and versatility in a series of controlled experiments. The emission profile of the investigated e-cigs was examined as a function of the e-cig type, e-cig operational parameters, and environmental mixing conditions. All the experimental parameters are summarized in Table 1. More specifically the following experiments were performed:
Table 1.
Summary of experiments
| E-cig type | Puffing protocol | E-cig operational voltage/heating coil temperature | Environmental temperature and relative humidity (RH) | Mixing chamber residence time |
|---|---|---|---|---|
| Disposal cig-a-like | MPP | 3.7V/195.1±2.3°C | 24°C & 35% | 60s |
| Prefilled cartomizer | MPP | 3.7V/195.1±2.3°C | 24°C & 35% | 60s |
| Refillable clearomizer | MPP | 2.2V/106.8±0.4°C | 24°C & 35% | 60s |
| 3.7V/195.1±2.3°C | 24°C & 35% | 240s | ||
| 24°C & 35% | 60s | |||
| 37°C & 25% | ||||
| 37°C & 50% | ||||
| 37°C & 75% | ||||
| 37°C & 90% | ||||
| 4.8V/212.1±4.9°C | 24°C & 35% | 60s | ||
| 5.7V/265.8±4.7°C | 24°C & 35% | 60s | ||
| FTC | 3.7V/195.1±2.3°C | 24°C & 35% | 60s | |
| Shallow | 3.7V/195.1±2.3°C | 24°C & 35% | 60s |
Stability and reproducibility
For reproducibility and stability investigation of the exposure platform, a modified puffing protocol (MPP), which reflected real consumers’ behavior of e-cig smoking (Farsalinos et al. 2013; Lee et al. 2015), was defined and used (puff volume: 55 ml; puff duration: 4s; puff interval: 30s). For these experiments an APV with the tobacco flavor (10mg/ml nicotine) at voltage of 3.7V was used. The residence time in the environmental mixing chamber was set at 60 s. The chamber environmental conditions were set at 24°C and 35%RH. The reproducibility was evaluated by performing four replicate experiments in different days with fresh e-liquid for each experiment. It is worth noting that Ecig-EGS has been tested for all three e-cig types for one hour and the particle size and number concentrations were found to be stable over time (Figure S3).
Versatility experiments
In order to showcase the versatility, each of the following operational/environmental parameters was modified one at the time and e-cig exposures were generated and characterized using both the real time and integrated PM sampling instrumentation described above. In more detail:
E-cig type
In addition to APV, a disposable cig-a-like and a mid-sized Vape Pen was used for this experiment. The disposable cig-a-like had its own battery and did not require any power from e-cig generator. The Vape Pen was operated at 3.7 V, as recommended by the manufacturer.
Puffing protocol
In addition to MPP, two other protocols were also applied for comparison purpose: the standardized puffing protocol for conventional cigarettes Federal Trade Commission protocol (FTC; puff volume: 35ml; puff duration: 2s; puff interval: 60s) (ISO 2012) and shallow puffing protocol (puff volume: 20ml; puff duration: 1s; puff interval: 10s). Shallow puffing protocol was defined to mimic frequent puffing with small puff volume.
Applied voltage and operating temperature
Based on the design of e-cig, an electrical circuit inside e-cig automatically engages the heating element to heat the e-liquid and generate the vapour by puffing or manually by pressing a button on e-cig itself. It is worth noting that APV type allows e-cig consumers to change voltage. For the investigations in this study, four voltages, 2.2V, 3.7V, 4.8V and 5.7V, were used in order to assess the effect of voltage on e-cig emission profile. The e-cig heating coil temperature (the temperature at which e-liquid was vaporized) corresponded to the applied voltage was also measured by probing the heating coil with a k-type thermocouple through the e-cig mouth piece. Temperatures were recorded by a digital data-logger as a function of time.
Residence time/air change rate in mixing chamber
To mimic active smoking, the smoker lung “washout time” of 60s was used which corresponds to an ACH of 60 (Invernizzi et al. 2007). In addition, a residence time of 240s (ACH of 15) was also investigated to mimic passive smoking in indoor smoking rooms (ASHRAE 2003; Repace 2005).
Environmental T and RH
The influence of T and RH of the mixing chamber was also investigated at a 37°C temperature. RH levels of 25%, 50% 75% and 90% were used in these investigations.
E-cig types used
Three different types of e-cigs were chosen based on market share sales in US and used in the aforementioned experiments: 1) An APV type (allows consumers to manually change the operational voltage and flavor) with tobacco flavor with 10mg/ml nicotine e-liquid (Zhu et al. 2014); 2) a disposable cig-a-like (tobacco, 4.5% nicotine by weight); and 3) a midsized Vape Pen type e-cig (tobacco, 2.4% nicotine).
Data processing and Statistical analysis
Data from the real time instrumentation were adjusted based on dilution ratios to reflect the actual values. All experiments were executed at least in triplicates.
The statistical values (total concentration, mean, mode and standard deviations) were calculated directly from the size distributions. The mode diameter was used as the representative value of the measurement and the standard deviation as the measurement error.
The two tails t-test was performed to evaluate the significance in statistical difference (p<0.05) (Kanji 2006).
Results
Ecig-EGS reproducibility and stability
Figures 2A and B show the particle number concentration as a function of particle size from FMPS and APS measurements, respectively for APV e-cig with tobacco flavor, operated under 3.7V with MPP puffing protocol. The environmental conditions were 24°C and 35% RH. The residence time applied in these experiments was 60s. A bimodal size distribution was evident across the size range from 5nm to 20μm. The majority of e-cig emitted particles were in the range of 5nm to 500nm, with the mode diameter at 191.1 ± 27.6 nm. The particle number concentration was stable across various experiments at approximately 2.5 ± 0.5 million particles/cm3, indicative of the reproducibility of the exposure generation platform. For the particles in the 0.5 to 20μm size range, the mode diameter was found to be 1.18 ± 0.13 μm. The particle number concentration in this range was 7000 ± 1500 particles/cm3.
Figure 2.
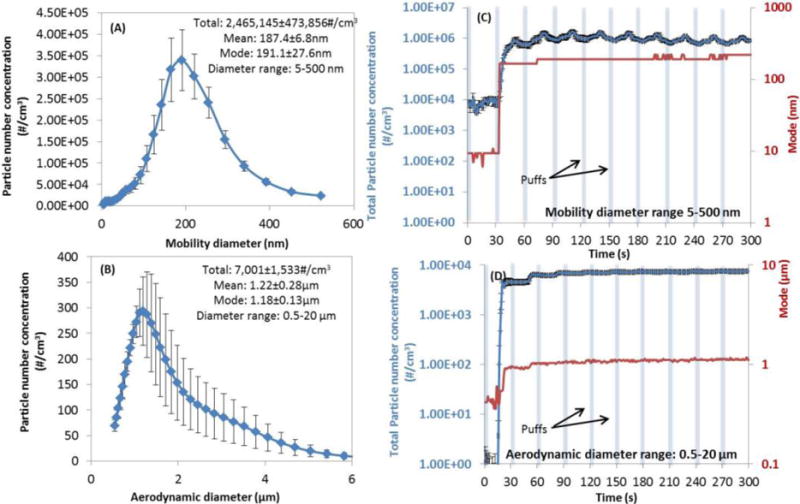
Reproducibility and stability of Ecig-EGS demonstrated by particle number concentration and mode. Reproducibility (data from four replicates on different days): (A) mobility diameter range of 5–500 nm; (B) aerodynamic diameter range of 0.5–20 μm; stability over first five minutes: (C) mobility diameter range of 5–500 nm; (D) aerodynamic diameter range of 0.5–20 μm. (Parameters: e-cig type: refillable APV with tobacco flavor; puffing protocol: MPP protocol; applied voltage: 3.7V; environmental condition: 24°C and 35%RH; chamber residence time: 60s).
Figures 2C and D illustrate the total particle number concentration as a function of time and mode diameter for APV type e-cig. The operational and environmental conditions were the same to that of Figures 2A and B, as described above. The particle number concentration reached steady state condition after one minute. Similar trend was observed for the mode diameter. Similar results were observed for disposable cig-a-like and prefilled Vape Pen (Figure S1). The particle number concentration was stable until the e-liquid was exhausted from the e-cig. The length of how long an e-cig can last depended on how much e-liquid was filled in the APV tank.
Versatile features of Ecig-EGS
E-cig type
Figure S1 shows the particle number concentrations for different e-cig types. In the range of 5nm to 500nm the disposable cig-a-like and mid-sized Vape Pen generated 10 times more particles, compared to large APV operated at 3.7V, (which is the same voltage for disposable cig-a-like and mid-sized Vape Pen) (Figure 2A). No significant size variations were observed among the three e-cig types. In the size range of 0.5μm to 20μm, both particle number concentration and size did not vary per e-cig type.
Puffing protocol
Figure 3 illustrates the difference in e-cig emission profile using different puffing protocols. For the same operational and environmental conditions (e-cig operated under 3.7V; the environmental chamber was under 24°C and 35%RH with the residence time of 60s), more particles were generated from MPP protocol as indicated by the particle number concentration profile. Furthermore, no significant change in mode diameter was observed among the used protocols for particles in the size range of 5–500 nm. In the size range of 0.5 to 20μm, mode diameter for the MPP protocol (1.13 ± 0.03 μm) was significantly larger (p<0.05) than the mode diameters of the other two protocols (0.96 ± 0 μm for FTC and 0.63 ± 0 μm for “shallow” protocol), indicative of possible different mechanisms of aerosol formation.
Figure 3.
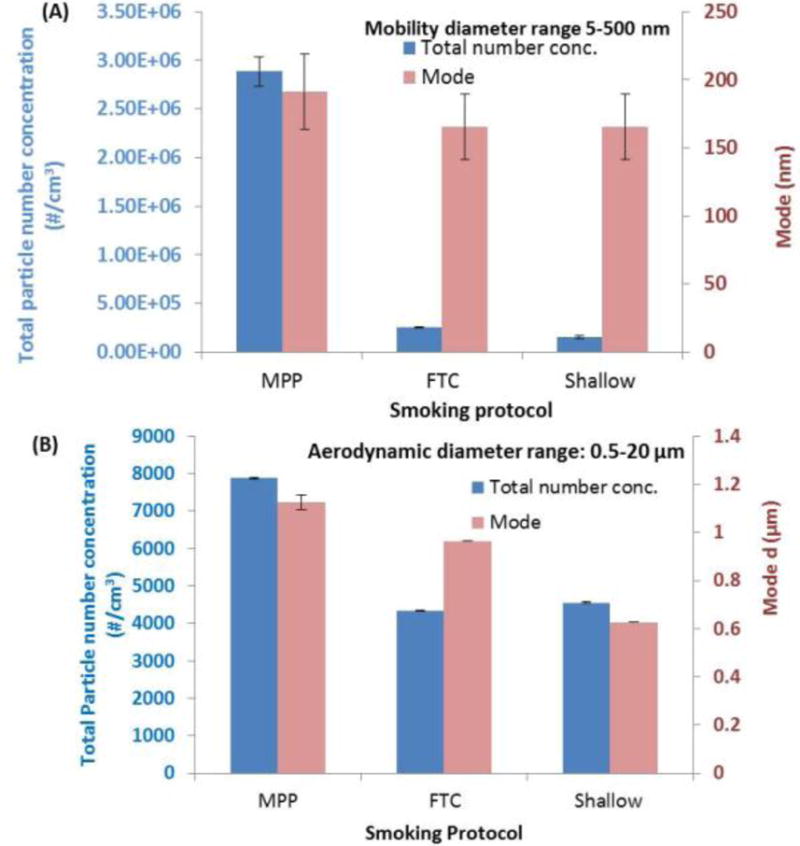
Total particle concentration and mode under three puffing protocols. MPP: Modified puffing protocol; puff volume 55ml, puff duration 4s, puff interval 30s. FTC: Federal Trade Commission protocol; puff volume 35ml, puff duration 2s, puff interval 60s. Shallow smoking protocol: puff volume 20ml, puff duration 1s, puff interval 10s. (A) mobility diameter range of 5–500 nm; (B) aerodynamic diameter range of 0.5–20 μm. (Other parameters: e-cig type: refillable APV with tobacco flavor; applied voltage: 3.7V; environmental condition: 24°C and 35%RH; chamber residence time: 60s).
Applied voltage and operating temperature
The applied voltages were correlated to the temperatures of e-cig heating coil (Figure S2). The final operating temperature was found to be a function of the applied voltage and the operational time of e-cig use. For the MPP protocol, as the voltage increases from 2.2V, 3.7V, 4.8V to 5.7V, the corresponding temperature also increases from 106.8, 195.1, 212.1 to 265.8°C respectively. It is worth noting that the temperature increases as a function of puffing time, with the rate of 20–50°C/second, and did not reach steady state within the four seconds of puffing duration (Figure S2).
Figure 4 shows the particle number concentration, mass concentration, mode particle diameter and VOCs and CO2 concentrations for different applied voltages for the APV type e-cig. Figure 4A shows that the maximum particle number concentration was observed at 212.1 °C where it increased by 120-fold compared to 106.8 °C low voltage operational temperature. For the highest temperature (265.8 °C) the number concentration dropped by 30% compared to the maximum observed concentration at 212.1 °C. In the 5–20 um size range, the maximum particle concentration was observed at the 195.1 °C. In both size ranges, mode diameter reached maximum at approximately 200°C then remained stable.
Figure 4.
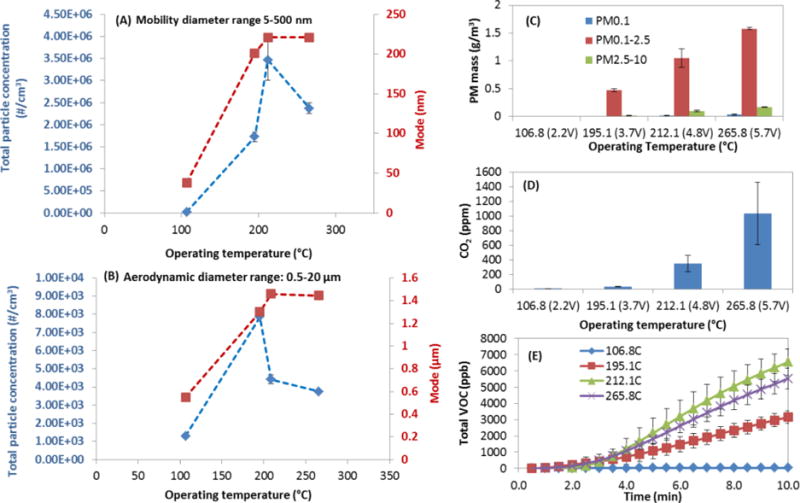
E-cig PM and gas generation under different operating temperatures (controlled by adjusting applied voltage). (A) particle number concentration and mode in mobility diameter range of 5–500 nm; (B) particle number concentration and mode in aerodynamic diameter range of 0.5–20 μm; (C) size-fractioned particle mass collection for 15 minutes by CCI; (D) CO2 generation monitored for 15 minutes by Qtrak; (E) total VOC monitored for 10 minutes by tVOC monitor. (Other parameters: e-cig type: refillable APV with tobacco flavor; puffing protocol: MPP protocol; environmental condition: 24°C and 35%RH; chamber residence time: 60s).
Evidently, more PM mass was collected as temperature increased as shown in Figure 4C. The total particle mass concentrations under 106.8, 195.1, 212.1 to 265.8°C were 0.001, 0.50, 1.17 and 1.79 g/m3 respectively. This corresponded with 0.04, 1.74, 4.09, 6.25 mg per puff, respectively for the four temperatures. Linear increase in particle mass concentration was observed as a function of temperature (R2=0.9009). The PM mass concentration increased more than 1500 times for the lowest to highest e-cig operational temperatures (from 106.8 to 265.8°C). At all the temperatures, the highest particle mass concentration was found on the PM0.1–2.5 stage of CCI: 0.0008g/m3 under 106.8°C, 0.47g/m3 under 195.1°C, 1.05g/m3 under 212.1°C and 1.58 g/m3 under 265.8°C. The particle mass on PM0.1–2.5 stage was accounted for 69 – 96% of the total mass for the investigated range of e-cig operational temperatures.
CO2 generation was closely related to operating voltage (Figure 4D). Less than 1 ppm CO2 was detected at 106.8°C. A linear regression between T and CO2 level was found from 195.1°C to 265.8°C (R2=0.9927). Similarly, total VOC levels were found to be associated with temperature (Figure 4E). Approximately twice amount of VOCs (~6000 ppb) were detected at 212.1°C and 265.8°C compared to 195.1°C (~3000 ppb). CO2 and VOC accumulated in the mixing chamber and the level of both kept increasing with time. The CO levels were below or at the limit of detection.
Air change rate/residence time
Figure 5 presents the effect of residence time and mixing/ventilation conditions. As shown, for residence time of 240s (passive smoking conditions in indoor environment) (ASHRAE 2003; Repace 2005), the particle number concentration was approximately 10 million/cm3. The input flow rate inside the 7L mixing chamber was 1.75LPM. This concentration was four times higher compared to a residence time of 60s (active smoking condition) (Invernizzi et al. 2007). In this case, the input flow rate was 7LPM. No significant change of mode diameter was observed for the two residence time scenarios.
Figure 5.
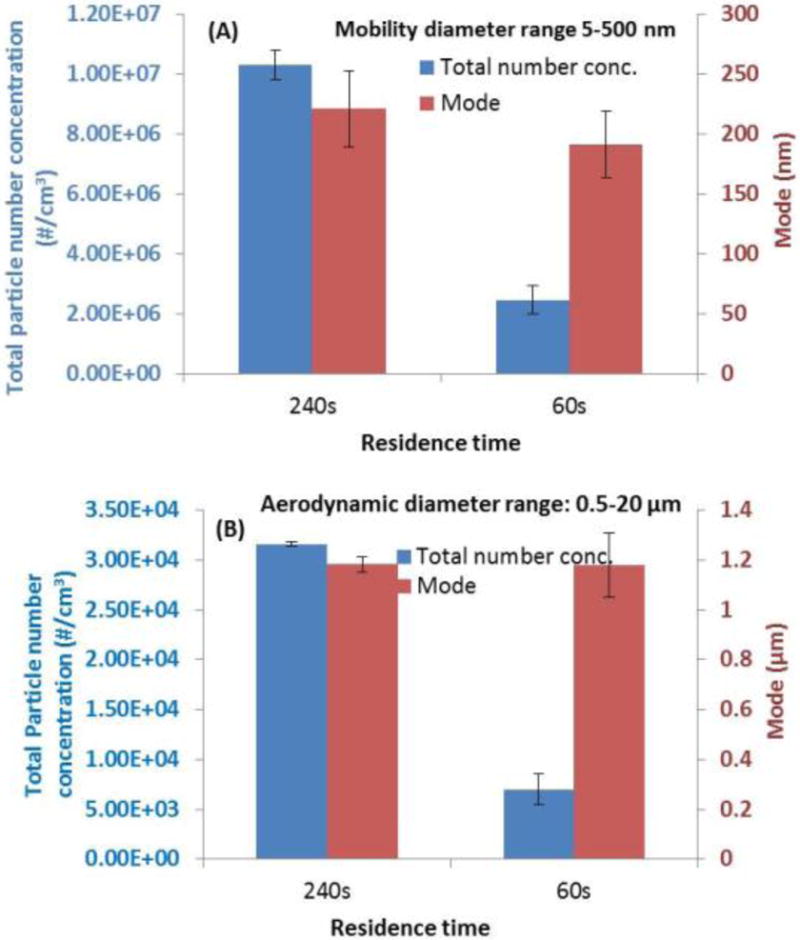
Total particle concentration and mode under two residence time/air exchange rates. Scenario 1: 240s residence time/air exchange rate 15/h; scenario 2: 60s residence time/air exchange rate 60/h. (A) mobility diameter range of 5–500 nm; (B) aerodynamic diameter range of 0.5–20 μm. (Other parameters: e-cig type: refillable APV with tobacco flavor; puffing protocol: MPP protocol; applied voltage: 3.7V; environmental condition: 24°C and 35%RH).
Environmental mixing conditions
Figure 6 shows the effect of the temperature and humidity on the particle number concentration and size distribution. In the 5 to 500nm size range, higher particle number concentration was observed at 37°C compared to the 24 °C regardless of the RH. For same 5 to 500nm size range, increased RH led to lower particle number concentration but no obvious change in particle size distribution. The mode diameter was stable at 220.7 nm for all tested RH mixing scenarios. In the 0.5 to 20μm size range, the particle number concentration decreased with the increase of RH. However, the mode diameter in this range evidently shifted to a larger diameter (1.72 ± 0 μm for 90% RH vs. 1.11 ± 0.02 μm for 25% RH; 1.20 ± 0 μm for 50% RH and 1.29 ± 0.03 μm for 75% RH). At 90% RH, there were noticeable more particles larger than 3μm. In addition, the particle size distribution became broader.
Figure 6.
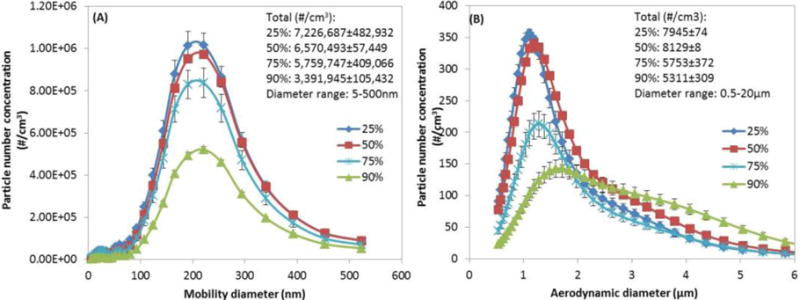
Particle number concentration generated at 37°C and four relative humidity. (A) mobility diameter range of 5–500 nm; (B) aerodynamic diameter range of 0.5–20 μm. (Other parameters: e-cig type: refillable APV with tobacco flavor; puffing protocol: MPP protocol; applied voltage: 3.7V; chamber residence time: 60s).
Discussion
Our results demonstrated the reproducibility and versatility of the developed Ecig-EGS platform in generating e-cig exposures in a systematic and controlled manner. Its utility to enable systematic physico-chemical and toxicological characterization is also demonstrated. The real time data presented also provided knowledge on e-cig emission profile and how e-cig types, operating parameters and environmental mixing conditions can influence the physical properties of emitted aerosol and possibly the chemical and toxicological profiles as well.
Real time monitoring data illustrated that e-cigs generated high amount of PM and the particle number concentration was in the range of millions/cm3. It is worth noting that in our experiment the pure e-cig emission was introduced and diluted in the mixing chamber. The residence time was carefully chosen as the smoke washout time in human lung (58.6s) (Invernizzi et al. 2007). Also the dilution ratio was similar to real dilution in smokers’ lung (~70 times) (Ganong 2010). A very important observation was the particle number concentration dependence on the e-cig type that can vary significantly and is in the order of tenths of million particles/cm3. Since the same operational parameters (puffing protocol and applied voltage) and environmental conditions (residence time, T and RH) were applied for these experiments, the difference in particle number concentration was attributed to either the difference in electronic control of heating/vaporization process or the variation in e-liquid properties, which was prefilled in disposable cig-a-like and Vape Pen. We plan to perform and report in a separate manuscript the detailed chemical properties of both e-liquid and emissions in order to further understand the aerosol formation mechanisms.
Furthermore for all e-cig types, the majority of the particles were below 500 nm in size with a single peak around 200nm, which is in agreement with previously reported findings (Zhang et al. 2013; Fuoco et al. 2014; Marini et al. 2014). There were also several thousand particles present in the 5 to 20μ size range. The findings also demonstrated the difference in e-cig emission particle number concentration due to e-cig type, which highlighted the importance of physico-chemical characterization. It is worth noting that this is in agreement to published literature. Similar to our findings, difference in particle number concentration among difference e-cigs types was also reported (McAuley et al. 2012). Discrepancy in literature in terms of particle number concentration is largely due to different dilution ratios that were not precisely reported (Ingebrethsen et al. 2012; Fuoco et al. 2014; Marini et al. 2014). As expected, fewer particles were observed in the studies where e-cig emission was largely diluted (in many cases intended to mimic secondhand e-cig exposure) (McAuley et al. 2012; Schripp et al. 2013; Geiss et al. 2014; Schober et al. 2014). In addition, there are studies that used various dilution conditions, and found difference in particle size distribution. For instance, Schober et al. (2014) reported the peaks were at 24–36nm (refillable APV); Schripp et al. (2013) observed a major peak at about 30nm and a secondary peak at about 100nm (refillable APV).
In total, the lack of harmonized protocols in terms of e-cig exposure generation and characterization and the proper reporting of type of e-cig and its chemical composition and operational parameters make it difficult for risk assessment purposes. The developed e-cig-EGS platform can help in addressing those issues.
Effect of Puffing protocols on e-cig emissions
Longer and more frequent puffing led to more particle generation (Figure 3) for APV with tobacco flavor under 3.7V operational voltage. The environmental conditions were 24°C and 35% RH. The residence time of the environmental chamber was 60s. In the size range of 5 to 500nm, significant more particles were observed from MPP protocol compared to FTC and shallow smoking protocol. This was because “longer” puffs resulted in more electrical energy converted to heat, which led to higher e-cig evaporation temperature (Figure S2). However, it is worth noting that the particle size distribution did not changed as a function of the puffing protocol for the 5 to 500nm size range. In the 0.5 to 20μm size range, larger particle formation was observed for the MPP protocol. The reported 10–20 fold change in particle number concentration and differences in size distribution (Figure 3) as well as the difference in the e-cig operational temperature (for example, when both operated at 3.7V, the heating coil temperature of MPP protocol was 47 °C higher than the temperature of FTC protocol, (Figure S2)), might also have an effect on both the chemical and toxicological profile of the emissions. Further physico-chemical and toxicological studies are required to assess this hypothesis and results will be reported in future manuscripts.
These findings extenuates the need for the development of a standard puffing protocol for physico-chemical and toxicological assessment studies or at minimum to report the puffing conditions. It is worth noting that it is known that e-cig smoking has different puffing characteristics than conventional smoking. Longer puffing time (~4s) was observed for both e-cig users (McAuley et al. 2012; Farsalinos et al. 2013, Williams et al. 2013; Geiss et al. 2014; Herrington & Myers 2015 Lee et al. 2015) compared to conventional tobacco users.
Effect of applied voltage and operating temperature
Our study is among the first to demonstrate that particle formation in e-cig emission is highly influenced by applied voltage. The influence of applied voltage on particle mass generation in e-cig emission has been ignored in literature. In our study, significantly more particle mass was collected under higher voltages (more than 1500 times more under 5.7V compared to 2.2V). This is in agreement with previous observations that more e-liquid was consumed at higher voltage (Kosmider et al. 2014). However, Kosmider et al (2014) did not characterize particle concentration in emitted aerosol. Higher voltage resulted in greater energy transformed to heat and higher e-cig heating coil temperature (Rowell & Tarran 2015). An increase of applied voltage from 2.2 to 5.7V resulted in an operating temperature increase from 106.8 to 265.8°C. This in agreement with published literature (Rowell & Tarran 2015). Higher operating temperature resulted in greater e-liquid vaporization and thus more particle mass in aerosol phase.
Higher CO2 and VOC levels were observed at higher temperatures as a result of higher evaporation/pyrolysis temperatures. It is worth noting that the particle number and mass concentration, CO2 and VOCs levels exhibited maxima that did not coincide among them. This insinuates that there are multiple mechanisms such as vaporization/condensation and combustion as indicated by the high CO2 levels.
Furthermore, it is expected that in addition to the PM and gaseous compounds generation rate effect, the chemical composition will be affected. It has been hypothesized (McAuley et al. 2012) and proposed (World Health Organization 2014) that voltage/temperature can influence e-cig emission formation. However, only two studies on the effect of voltage on carbonyls have been published. Jensen et al. (2015) found formaldehyde in e-cig emission applying 5.0 V voltage but not at 3.3 V. Kosmider et al. (2014) also found 4 – 200 fold increase in formaldehyde, acetaldehyde and acetone level when voltage was increased from 3.2 to 4.8V. Research on the influence of applied voltage on e-cig emission properties and toxicity is imperative because the majority of e-cig consumers are currently using advanced e-cigs (Dawkins et al. 2013; Giovenco et al. 2014) that enable them to adjust and use high voltage conditions (Yingst et al. 2015). Therefore more research is needed to both understand the effect of applied voltage on toxicological outcomes as well as the behavior of advanced e-cig users in terms of voltage use.
Effect of residence time/air change rate and environmental conditions (T and RH)
Residence time/air change rate influenced e-cig particle number concentration and size distribution (Figure 5). As expected, residence time of 60s with four times more dilution compared to residence time of 240s resulted to approximately four times lower particle number concentration. Furthermore, environmental mixing conditions (T and RH) primarily affect particle agglomeration and further partitioning between gas and particulate phase, and thus affect the particle number concentration and size. Larger particle diameters were observed as RH increased. The particle size increase can be attributed both to condensational and hygroscopic growth of particles (Demokritou et al. 2002; Gupta et al. 2004a; Gupta et al. 2004b). According to a recently published computational model, the initial droplet diameter and RH were the dominant parameters for e-cig particle hygroscopic behavior (Feng et al. 2015). The T and RH conditions are important determinants of particle size which defines fate and transport and lung deposition (Hinds 1999; Robinson et al. 2006; Gowadia et al. 2009; Feng et al. 2015).
Despite of the disagreement in particle size distribution due to unharmonized methodologies, e-cig emitted PM can be expected to deposit on respiratory tract due to their submicron size (Londahl et al. 2006). The developed Ecig-EGS will be used to investigate the chemical composition and toxicity of e-cig exposures under a variety of operational parameters in the future.
Conclusions
This is the first attempt to systematically investigate the e-cig emission and influencing parameters. The developed versatile Ecig-EGS platform enables e-cig exposure generation with controllable operational and environmental parameters. It allows physico-chemical and toxicological characterization that can provide information to link operational and environmental parameters with the physico-chemical properties and biological effects. The present paper is the first of a series of studies on e-cig exposure. Authors are performing follow up studies to further assess the physico-chemical and morphological characterization on both e-liquid and e-cig aerosol emissions. Furthermore, in vitro and in vivo toxicological studies will be conducted to assess the biological effects of e-cig exposure. The developed Ecig-EGS will help in improving our understanding on the complex chemistry and toxicity of e-cig exposure. Data on how e-cig operational parameters affect aerosol formation and its physic chemical and toxicological properties can also prompt safer-by-design approaches and provide information to public health assessors to assess risks.
Supplementary Material
Acknowledgments
Funding for this study was provided by NIEHS Grant ES-000002. Jiayuan Zhao gratefully thanks Swiss National Science Foundation for the Early Postdoc Mobility Fellowship (P2LAP3_161808).
Footnotes
Declaration of interest statement
The authors declare no conflicts of interest.
References
- Allen JG, Flanigan SS, Leblanc M, et al. Flavoring chemicals in E-cigarettes: diacetyl, 2,3-pentanedione, and acetoin in a sample of 51 products, including fruit-, candy-, and cocktail-flavored E-cigarettes. Env Heal Perspect. 2016;124:733–9. doi: 10.1289/ehp.1510185. [DOI] [PMC free article] [PubMed] [Google Scholar]
- American Society of Heating, Refrigerating and Air-Conditioning Engineers. ANSI/ASHRAE Standard 62-2001. Ventilation for Acceptable Indoor Air Quality 2003 [Google Scholar]
- Behar RZ, Davis B, Wang Y, Bahl V, Lin S, Talbot P. Identification of toxicants in cinnamon-flavored electronic cigarette refill fluids. Toxicol Vitr [Internet] 2014;28:198–208. doi: 10.1016/j.tiv.2013.10.006. Available from: http://dx.doi.org/10.1016/j.tiv.2013.10.006. [DOI] [PubMed] [Google Scholar]
- Berg CJ, Haardoerfer R, Escoffery C, Zheng P, Kegler M. Cigarette users’ interest in using or switching to electronic nicotine delivery systems for smokeless tobacco for harm reduction, cessation, or novelty: A cross-sectional survey of US adults. Nicotine Tob Res. 2015;17:245–255. doi: 10.1093/ntr/ntu103. [DOI] [PMC free article] [PubMed] [Google Scholar]
- Brobell D, Tröller S, Dziurowitz N, Plitzko S, Linsel G, Asbach C, Azong-Wara N, Fissan H, Schmidt-Ott A. A thermal precipitator for the deposition of airborne nanoparticles onto living cells-Rationale and development. J Aerosol Sci [Internet] 2013;63:75–86. Available from: http://dx.doi.org/10.1016/j.jaerosci.2013.04.012. [Google Scholar]
- Cameron JM, Howell DN, White JR, Andrenyak DM, Layton ME, Roll JM. Variable and potentially fatal amounts of nicotine in e-cigarette nicotine solutions. Tob Control [Internet] 2014;23:77–78. doi: 10.1136/tobaccocontrol-2012-050604. Available from: http://tobaccocontrol.bmj.com/cgi/doi/10.1136/tobaccocontrol-2012-050604. [DOI] [PubMed] [Google Scholar]
- Cervellati F, Muresan XM, Sticozzi C, Gambari R, Montagner G, Forman HJ, Torricelli C, Maioli E, Valacchi G. Comparative effects between electronic and cigarette smoke in human keratinocytes and epithelial lung cells. Toxicol Vitr [Internet] 2014;28:999–1005. doi: 10.1016/j.tiv.2014.04.012. Available from: http://linkinghub.elsevier.com/retrieve/pii/S08872333140007057. [DOI] [PMC free article] [PubMed] [Google Scholar]
- Chang C, Demokritou P, Shafer M, Christiani D. Physicochemical and toxicological characteristics of welding fume derived particles generated from real time welding processes. Environ Sci Process Impacts [Internet] 2013;15:214–24. doi: 10.1039/c2em30505d. Available from: http://www.ncbi.nlm.nih.gov/pubmed/24592438. [DOI] [PubMed] [Google Scholar]
- Cheah NP, Chong NWL, Tan J, Morsed FA, Yee SK. Electronic nicotine delivery systems: regulatory and safety challenges: Singapore perspective. Tob Control [Internet] 2014;23:119–125. doi: 10.1136/tobaccocontrol-2012-050483. Available from: http://tobaccocontrol.bmj.com/cgi/doi/10.1136/tobaccocontrol-2012-050483. [DOI] [PubMed] [Google Scholar]
- Cohen J, Deloid G, Pyrgiotakis G, Demokritou P. Interactions of engineered nanomaterials in physiological media and implications for in vitro dosimetry. Nanotoxicology [Internet] 2013;7:417–31. doi: 10.3109/17435390.2012.666576. Available from: http://www.pubmedcentral.nih.gov/articlerender.fcgi?artid=4479135&tool=pmcentrez&rendertype=abstract. [DOI] [PMC free article] [PubMed] [Google Scholar]
- Cohen JM, Deloid M, Demokritou P. A critical review of in vitro dosimetry for engineered nanomaterials. Nanomedicine. 2015;10:3015–3032. doi: 10.2217/nnm.15.129. [DOI] [PubMed] [Google Scholar]
- Cohen JM, Teeguarden JG, Demokritou P. An integrated approach for the in vitro dosimetry of engineered nanomaterials. Part Fibre Toxicol [Internet] 2014;11:20. doi: 10.1186/1743-8977-11-20. Available from: http://www.pubmedcentral.nih.gov/articlerender.fcgi?artid=4024018&tool=pmcentrez&rendertype=abstract. [DOI] [PMC free article] [PubMed] [Google Scholar]
- Coleman BN, Johnson SE, Tessman GK, et al. “It’s not smoke. It’s not tar. It’s not 4000 chemicals. Case closed”: exploring attitudes, beliefs, and perceived social norms of e-cigarette use among adult users. Drug Alcohol Depend. 2016;159:80–5. doi: 10.1016/j.drugalcdep.2015.11.028. [DOI] [PMC free article] [PubMed] [Google Scholar]
- Dawkins L, Turner J, Roberts A, Soar K. “Vaping” profiles and preferences: An online survey of electronic cigarette users. Addiction. 2013;108:1115–1125. doi: 10.1111/add.12150. [DOI] [PubMed] [Google Scholar]
- Deloid G, Cohen JM, Darrah T, Derk R, Rojanasakul L, Pyrgiotakis G, Wohlleben W, Demokritou P. Estimating the effective density of engineered nanomaterials for in vitro dosimetry. Nat Commun [Internet] 2014;5:3514. doi: 10.1038/ncomms4514. Available from: http://www.ncbi.nlm.nih.gov/pubmed/24675174. [DOI] [PMC free article] [PubMed] [Google Scholar]
- DeLoid GM, Cohen JM, Pyrgiotakis G, Pirela SV, Pal A, Liu J, Srebric J, Demokritou P. Advanced computational modeling for in vitro nanomaterial dosimetry. Part Fibre Toxicol [Internet] 2015;12:32. doi: 10.1186/s12989-015-0109-1. Available from: http://particleandfibretoxicology.biomedcentral.com/articles/10.1186/s12989-015-0109-1. [DOI] [PMC free article] [PubMed] [Google Scholar]
- Demokritou P, Gupta T, Koutrakis P. A High Volume Apparatus for the Condensational Growth of Ultrafine Particles for Inhalation Toxicological Studies. Aerosol Sci Technol [Internet] 2002;36:1061–1072. Available from: http://www.tandfonline.com/doi/abs/10.1080/02786820290092230. [Google Scholar]
- Demokritou P, Lee SJ, Ferguson ST, Koutrakis P. A compact multistage (cascade) impactor for the characterization of atmospheric aerosols. J Aerosol Sci. 2004;35:281–299. [Google Scholar]
- Dockrell M, Morrison R, Bauld L, McNeill A. E-cigarettes: Prevalence and attitudes in great britain. Nicotine Tob Res. 2013;15:1737–1744. doi: 10.1093/ntr/ntt057. [DOI] [PMC free article] [PubMed] [Google Scholar]
- Etter JF, Zäther E, Svensson S. Analysis of refill liquids for electronic cigarettes. Addiction. 2013;108:1671–1679. doi: 10.1111/add.12235. [DOI] [PubMed] [Google Scholar]
- Evans P. E-Cigarette Makers Face Rise of Fakes_E-cigarette global sales hit $7 billion at the end of 2014. The Wall Street Journal 2015 Feb 20; [Google Scholar]
- Farsalinos K, Romagna G, Tsiapras D, Kyrzopoulos S, Voudris V. Characteristics, Perceived Side Effects and Benefits of Electronic Cigarette Use: A Worldwide Survey of More than 19,000 Consumers. Int J Environ Res Public Health [Internet] 2014;11:4356–4373. doi: 10.3390/ijerph110404356. Available from: http://www.mdpi.com/1660-4601/11/4/4356/ [DOI] [PMC free article] [PubMed] [Google Scholar]
- Farsalinos KE, Romagna G, Tsiapras D, Kyrzopoulos S, Voudris V. Evaluation of electronic cigarette use (Vaping) topography and estimation of liquid consumption: Implications for research protocol standards definition and for public health authorities’ regulation. Int J Environ Res Public Health. 2013;10:2500–2514. doi: 10.3390/ijerph10062500. [DOI] [PMC free article] [PubMed] [Google Scholar]
- Feng Y, Kleinstreuer C, Rostami A. Evaporation and condensation of multicomponent electronic cigarette droplets and conventional cigarette smoke particles in an idealized G3–G6 triple bifurcating unit. J Aerosol Sci [Internet] 2015;80:58–74. Available from: http://dx.doi.org/10.1016/j.jaerosci.2014.11.002. [Google Scholar]
- Fuoco F, Buonanno G, Stabile L, Vigo P. Influential parameters on particle concentration and size distribution in the mainstream of ecigarettes. Environ Pollut. 2014;184:523–529. doi: 10.1016/j.envpol.2013.10.010. [DOI] [PubMed] [Google Scholar]
- Ganong WF. Review of Medical Physiology. 23rd. New York: The McGraw-Hill Companies, Inc; 2010. [Google Scholar]
- Geiss O, Bianchi I, Barahona F, Barrero-Moreno J. Characterisation of mainstream and passive vapours emitted by selected electronic cigarettes. Int J Hyg Environ Health [Internet] 2014;218:169–180. doi: 10.1016/j.ijheh.2014.10.001. Available from: http://www.sciencedirect.com/science/article/pii/S1438463914000972. [DOI] [PubMed] [Google Scholar]
- Giovenco DP, Lewis MJ, Delnevo CD. Factors associated with e-cigarette use: A national population survey of current and former smokers. Am J Prev Med [Internet] 2014;47:476–480. doi: 10.1016/j.amepre.2014.04.009. Available from: http://dx.doi.org/10.1016/j.amepre.2014.04.009. [DOI] [PMC free article] [PubMed] [Google Scholar]
- Goniewicz ML, Knysak J, Gawron M, Kosmider L, Sobczak A, Kurek J, Prokopowicz A, Jablonska-Czapla M, Rosik-Dulewska C, Havel C, et al. Levels of selected carcinogens and toxicants in vapour from electronic cigarettes. Tob Control [Internet] 2014;23:133–9. doi: 10.1136/tobaccocontrol-2012-050859. Available from: http://tobaccocontrol.bmj.com/content/early/2013/03/05/tobaccocontrol-2012-050859.abstract. [DOI] [PMC free article] [PubMed] [Google Scholar]
- Goniewicz ML, Kuma T, Gawron M, Knysak J, Kosmider L. Nicotine levels in electronic cigarettes. Nicotine Tob Res. 2012;15:158–166. doi: 10.1093/ntr/nts103. [DOI] [PubMed] [Google Scholar]
- Gowadia N, Oldham MJ, Dunn-Rankin D. Particle size distribution of nicotine in mainstream smoke from 2R4F, Marlboro Medium, and Quest1 cigarettes under different puffing regimens. Inhal Toxicol. 2009;21:435–446. doi: 10.1080/08958370802512535. [DOI] [PubMed] [Google Scholar]
- Gupta T, Demokritou P, Koutrakis P. Development and performance evaluation of a high-volume ultrafine particle concentrator for inhalation toxicological studies. Inhal Toxicol. 2004a;16:851–862. doi: 10.1080/08958370490506664. [DOI] [PubMed] [Google Scholar]
- Gupta T, Demokritou P, Koutrakis P. Effects of Physicochemical Properties of Ultrafine Particles on the Performance of an Ultrafine Particle Concentrator. Aerosol Sci Technol. 2004b;38:37–45. [Google Scholar]
- Hecht SS, Carmella SG, Kotandeniya D, et al. Evaluation of toxicant and carcinogen metabolites in the urine of E-cigarette users versus cigarette smokers. Nicotine Tob Res. 2015;6:704–9. doi: 10.1093/ntr/ntu218. [DOI] [PMC free article] [PubMed] [Google Scholar]
- Herrington JS, Myers C. Electronic cigarette solutions and resultant aerosol profiles. J Chromatogr A [Internet] 2015;1418:192–199. doi: 10.1016/j.chroma.2015.09.034. Available from: http://linkinghub.elsevier.com/retrieve/pii/S0021967315013400. [DOI] [PubMed] [Google Scholar]
- Hinds W. Aerosol technology-Properties, Behavior, and Measurement of Airborne Particles. 2nd. place unknown; John Wiley, NY: 1999. [Google Scholar]
- Ingebrethsen BJ, Cole SK, Alderman SL. Electronic cigarette aerosol particle size distribution measurements. Inhal Toxicol [Internet] 2012;24:976–984. doi: 10.3109/08958378.2012.744781. Available from: http://www.ncbi.nlm.nih.gov/pubmed/23216158. [DOI] [PubMed] [Google Scholar]
- Invernizzi G, Ruprecht A, De Marco C, Paredi P, Boffi R. Residual tobacco smoke: measurement of its washout time in the lung and of its contribution to environmental tobacco smoke. Tob Control [Internet] 2007;16:29–33. doi: 10.1136/tc.2006.017020. Available from: http://tobaccocontrol.bmj.com/cgi/doi/10.1136/tc.2006.017020. [DOI] [PMC free article] [PubMed] [Google Scholar]
- ISO. ISO 3308: Routine Analytical Cigarette-Smoking Machine—Definitions and Standard Conditions. International Organization for Standardization (ISO); Geneva, Switzerland: 2012. place unknown. [Google Scholar]
- Jensen P, Luo W, Pankow J, Strongin R, Peyton D. Hidden Formaldehyde in E-Cigarette Aerosols. N Engl J Med [Internet] 2015;372:389–392. doi: 10.1056/NEJMc1413069. Available from: http://www.nejm.org/doi/abs/10.1056/NEJMc1414731. [DOI] [PubMed] [Google Scholar]
- Kanji GK. 100 Statistical Tests. 3rd. London: SAGE Publications; 2006. [Google Scholar]
- Kim AE, Arnold KY, Makarenko O. E-cigarette advertising expenditures in the U.S., 2011–2012. Am J Prev Med [Internet] 2014;46:409–412. doi: 10.1016/j.amepre.2013.11.003. Available from: http://dx.doi.org/10.1016/j.amepre.2013.11.003. [DOI] [PubMed] [Google Scholar]
- Kim K-H, Kabir E, Kabir S. A review on the human health impact of airborne particulate matter. Environ Int [Internet] 2015;74:136–143. doi: 10.1016/j.envint.2014.10.005. Available from: http://www.sciencedirect.com/science/article/pii/S0160412014002992. [DOI] [PubMed] [Google Scholar]
- King Ba, Patel R, Nguyen K, Dube SR. Original investigation Trends in Awareness and Use of Electronic Cigarettes Among U. S. Adults, 2010–2013. Nicotine Tob Res. 2015;17:219–227. doi: 10.1093/ntr/ntu191. [DOI] [PMC free article] [PubMed] [Google Scholar]
- Kosmider L, Sobczak A, Fik M, Knysak J, Zaciera M, Kurek J, Goniewicz ML. Carbonyl Compounds in Electronic Cigarette Vapors: Effects of Nicotine Solvent and Battery Output Voltage. Nicotine Tob Res [Internet] 2014;16:1319–1326. doi: 10.1093/ntr/ntu078. Available from: http://ntr.oxfordjournals.org/cgi/doi/10.1093/ntr/ntu078. [DOI] [PMC free article] [PubMed] [Google Scholar]
- Laugesen M. Safety report on the Ruyan_ e-cigarette cartridge and inhaled aerosol. Christchurch, New Zealand: Health New Zealand Ltd; 2008. pp. 1–23. [Google Scholar]
- Laugesen M, Thornley S, Mcrobbie H, Bullen C. How safe is an E-cigarette? The results of an independent chemical and microbiological analysis. SRNT Conference Portland Oregon; March 2008. 2008. pp. 1–14. poster. [Google Scholar]
- Laugesen M. Safety Report on the Ruyan ® e-cigarette Cartridge and Inhaled Aerosol. Heal NZ. 2008:1–23. [Google Scholar]
- Lauterstein DE, Tijerina PB, Corbett K, Oksuz BA, Shen SS, Gordon T, Klein CB, Zelikoff JT. Frontal Cortex Transcriptome Analysis of Mice Exposed to Electronic Cigarettes During Early Life Stages. Int J Environ Res Public Health. 2016;13:1–14. doi: 10.3390/ijerph13040417. [DOI] [PMC free article] [PubMed] [Google Scholar]
- Lee YH, Gawron M, Goniewicz ML. Changes in puffing behavior among smokers who switched from tobacco to electronic cigarettes. Addict Behav [Internet] 2015;48:1–4. doi: 10.1016/j.addbeh.2015.04.003. Available from: http://linkinghub.elsevier.com/retrieve/pii/S0306460315001446. [DOI] [PMC free article] [PubMed] [Google Scholar]
- Lerner C, Sundar I, Watson R, Elder A, Jones R, Done D, Kurtzman R, Ossip D, Robinson R, McIntosh S, Rahman I. Environmental Health Hazards of e-Cigarettes and their Components: Oxidants and Copper in e-cigarette aerosols Chad. Env Pollut. 2015;198:100–107. doi: 10.1016/j.envpol.2014.12.033. [DOI] [PMC free article] [PubMed] [Google Scholar]
- Lerner CA, Sundar IK, Yao H, Gerloff J, Ossip DJ, McIntosh S, Robinson R, Rahman I. Vapors produced by electronic cigarettes and E-juices with flavorings induce toxicity, oxidative stress, and inflammatory response in lung epithelial cells and in mouse lung. PLoS One. 2015;10:1–26. doi: 10.1371/journal.pone.0116732. [DOI] [PMC free article] [PubMed] [Google Scholar]
- Bin Lim H, Kim SH. Inhallation of e-cigarette cartridge solution aggravates allergen-induced airway inflammation and hyper-responsiveness in mice. Toxicol Res. 2014;30:13–18. doi: 10.5487/TR.2014.30.1.013. [DOI] [PMC free article] [PubMed] [Google Scholar]
- Londahl J, Pagels J, Swietlicki E, Zhou J, Ketzel M, Massling A, Bohgard M. A set-up for field studies of respiratory tract deposition of fine and ultrafine particles in humans. J Aerosol Sci. 2006;37:1152–1163. [Google Scholar]
- Lu X, Miousse IR, Pirela SV, et al. In vivo epigenetic effects induced by engineered nanomaterials: a case study of copper oxide and laser printer-emitted engineered nanoparticles. Nanotoxicology. 2016;10:629–39. doi: 10.3109/17435390.2015.1108473. [DOI] [PMC free article] [PubMed] [Google Scholar]
- Marco E, Grimalt JO. A rapid method for the chromatographic analysis of volatile organic compounds in exhaled breath of tobacco cigarette and electronic cigarette smokers. J Chromatogr A [Internet] 2015;1410:51–59. doi: 10.1016/j.chroma.2015.07.094. Available from: http://linkinghub.elsevier.com/retrieve/pii/S0021967315010821. [DOI] [PubMed] [Google Scholar]
- Marini S, Buonanno G, Stabile L, Ficco G. Short-term effects of electronic and tobacco cigarettes on exhaled nitric oxide. Toxicol Appl Pharmacol [Internet] 2014;278:9–15. doi: 10.1016/j.taap.2014.04.004. Available from: http://linkinghub.elsevier.com/retrieve/pii/S0041008X14001367. [DOI] [PubMed] [Google Scholar]
- McAuley TR, Hopke PK, Zhao J, Babaian S. Comparison of the effects of e-cigarette vapor and cigarette smoke on indoor air quality. Inhal Toxicol. 2012;24:850–857. doi: 10.3109/08958378.2012.724728. [DOI] [PubMed] [Google Scholar]
- Pal AK, Bello D, Cohen J, Demokritou P. Implications of in-vitro dosimetry on toxicological ranking of low aspect ratio engineered nanomaterials Anoop. Nanotoxicology. 2015;9:871–885. doi: 10.3109/17435390.2014.986670. [DOI] [PMC free article] [PubMed] [Google Scholar]
- Pal AK, Watson CY, Pirela SV, Singh D, Chalbot MCG, Kavouras I, Demokritou P. Linking exposures of particles released from nano-enabled products to toxicology: An integrated methodology for particle sampling, extraction, dispersion, and dosing. Toxicol Sci. 2015;146:321–333. doi: 10.1093/toxsci/kfv095. [DOI] [PMC free article] [PubMed] [Google Scholar]
- Pellegrino RM, Tinghino B, Mangiaracina G, Marani A, Vitali M, Protano C, Osborn JF, Cattaruzza MS. Electronic cigarettes: an evaluation of exposure to chemicals and fine particulate matter (PM) Ann Ig. 2012;24:279–288. [PubMed] [Google Scholar]
- Pirela S, Molina R, Watson C, Cohen JM, Bello D, Demokritou P, Brain J. Effects of copy center particles on the lungs: a toxicological characterization using a Balb/c mouse model. Inhal Toxicol [Internet] 2013;25:498–508. doi: 10.3109/08958378.2013.806614. Available from: http://www.pubmedcentral.nih.gov/articlerender.fcgi?artid=4393332&tool=pmcentrez&rendertype=abstract. [DOI] [PMC free article] [PubMed] [Google Scholar]
- Pirela SV, Pyrgiotakis G, Bello D, Thomas T, Castranova V, Demokritou P. Development and characterization of an exposure platform suitable for physico-chemical, morphological and toxicological characterization of printer-emitted particles (PEPs) Inhal Toxicol [Internet] 2014;26:400–8. doi: 10.3109/08958378.2014.908987. Available from: http://www.pubmedcentral.nih.gov/articlerender.fcgi?artid=4383100&tool=pmcentrez&rendertype=abstract. [DOI] [PMC free article] [PubMed] [Google Scholar]
- Pirela SV, Lu X, Miousse I, Sisler JD, Qian Y, Guo N, Koturbash I, Castranova V, Thomas T, Godleski J, Demokritou P. Effects of intratracheally instilled laser printer-emitted engineered nanoparticles in a mouse model: A case study of toxicological implications from nanomaterials released during consumer use. NanoImpact [Internet] 2016;1:1–8. doi: 10.1016/j.impact.2015.12.001. Available from: http://www.sciencedirect.com/science/article/pii/S245207481530001X. [DOI] [PMC free article] [PubMed] [Google Scholar]
- Pisinger C, Døssing M. A systematic review of health effects of electronic cigarettes. Prev Med (Baltim) [Internet] 2014;69:248–260. doi: 10.1016/j.ypmed.2014.10.009. Available from: http://linkinghub.elsevier.com/retrieve/pii/S0091743514003739. [DOI] [PubMed] [Google Scholar]
- Repace J. Controlling tobacco smoke pollution. ASHRAE IAQ Applications. 2005 Summer;62005(3) [Google Scholar]
- Robinson RJ, Oldham MJ, Clinkenbeard RE, Rai P. Experimental and numerical smoke carcinogen deposition in a multi-generation human replica tracheobronchial model. Ann Biomed Eng. 2006;34:373–383. doi: 10.1007/s10439-005-9049-5. [DOI] [PubMed] [Google Scholar]
- Rowell TR, Tarran R. Will chronic e-cigarette use cause lung disease? Am J Physiol Lung Cell Mol Physiol. 2015;309:L1398–409. doi: 10.1152/ajplung.00272.2015. [DOI] [PMC free article] [PubMed] [Google Scholar]
- Rubenstein DA, Hom S, Ghebrehiwet B, Yin W. Tobacco and e-cigarette products initiate Kupffer cell inflammatory responses. Mol Immunol [Internet] 2015;67:652–660. doi: 10.1016/j.molimm.2015.05.020. Available from: http://linkinghub.elsevier.com/retrieve/pii/S0161589015004137. [DOI] [PubMed] [Google Scholar]
- Salturk Z, Çakir Ç, Sünnetçi G, Atar Y, Kumral TL, Yildirim G, Berkiten G, Uyar Y. Effects of Electronic Nicotine Delivery System on Larynx: Experimental Study. J Voice. 2015;29:560–563. doi: 10.1016/j.jvoice.2014.10.013. [DOI] [PubMed] [Google Scholar]
- Schober W, Szendrei K, Matzen W, Osiander-Fuchs H, Heitmann D, Schettgen T, Jörres Ra, Fromme H. Use of electronic cigarettes (e-cigarettes) impairs indoor air quality and increases FeNO levels of e-cigarette consumers. Int J Hyg Environ Health [Internet] 2014;217:628–637. doi: 10.1016/j.ijheh.2013.11.003. Available from: http://dx.doi.org/10.1016/j.ijheh.2013.11.003. [DOI] [PubMed] [Google Scholar]
- Schripp T, Markewitz D, Uhde E, Salthammer T. Does e-cigarette consumption cause passive vaping? Indoor Air. 2013;23:25–31. doi: 10.1111/j.1600-0668.2012.00792.x. [DOI] [PubMed] [Google Scholar]
- Sisler JD, Pirela SV, Friend S, Farcas M, Schwegler-Berry D, Shvedova A, Castranova V, Demokritou P, Qian Y. Small airway epithelial cells exposure to printer-emitted engineered nanoparticles induces cellular effects on human microvascular endothelial cells in an alveolar-capillary co-culture model. Nanotoxicology [Internet] 2015;9:769–79. doi: 10.3109/17435390.2014.976603. Available from: http://www.ncbi.nlm.nih.gov/pubmed/25387250. [DOI] [PMC free article] [PubMed] [Google Scholar]
- Strak M, Janssen NAH, Godri KJ, Gosens I, Mudway IS, Cassee FR, Lebret E, Kelly FJ, Harrison RM, Brunekreef B, et al. Respiratory health effects of airborne particulate matter: The role of particle size, composition, and oxidative potential-the RAPTES project. Environ Health Perspect. 2012;120:1183–1189. doi: 10.1289/ehp.1104389. [DOI] [PMC free article] [PubMed] [Google Scholar]
- Tayyarah R, Long GA. Comparison of select analytes in aerosol from e-cigarettes with smoke from conventional cigarettes and with ambient air. Regul Toxicol Pharmacol [Internet] 2014;70:704–10. doi: 10.1016/j.yrtph.2014.10.010. Available from: http://www.sciencedirect.com/science/article/pii/S0273230014002505. [DOI] [PubMed] [Google Scholar]
- Trehy ML, Ye W, Hadwiger ME, Moore TW, Allgire JF, Woodruff JT, Ahadi SS, Black JC, Westenberger BJ. Analysis of Electronic Cigarette Cartridges, Refill Solutions, and Smoke for Nicotine and Nicotine Related Impurities. J Liq Chromatogr Relat Technol [Internet] 2011;34:1442–1458. Available from: http://www.tandfonline.com/doi/abs/10.1080/10826076.2011.572213. [Google Scholar]
- Wang M, SaiYin H, LokTung L, Lam T. Addictive Behaviors Electronic cigarette use and its association with smoking in Hong Kong Chinese adolescents. Addict Behav [Internet] 2015;50:124–127. doi: 10.1016/j.addbeh.2015.06.037. Available from: http://dx.doi.org/10.1016/j.addbeh.2015.06.037. [DOI] [PubMed] [Google Scholar]
- Watson C, Ge J, Cohen J, Pyrgiotakis G, Engelward BP, Demokritou P. High-throughput screening platform for engineered nanoparticle-mediated genotoxicity using cometchip technology. ACS Nano. 2014;8:2118–2133. doi: 10.1021/nn404871p. [DOI] [PMC free article] [PubMed] [Google Scholar]
- Westenberger BJ. Evaluation of e-cigarettes. Washington, DC: U.S. Food and Drug Administration; 2009. [Google Scholar]
- White J, Li J, Newcombe R, Walton D. Tripling use of electronic cigarettes among New Zealand adolescents between 2012 and 2014. J Adolesc Heal. 2015;56:522–528. doi: 10.1016/j.jadohealth.2015.01.022. [DOI] [PubMed] [Google Scholar]
- Williams M, Villarreal A, Bozhilov K, Lin S, Talbot P. Metal and Silicate Particles Including Nanoparticles Are Present in Electronic Cigarette Cartomizer Fluid and Aerosol. PLoS One [Internet] 2013;8:e57987. doi: 10.1371/journal.pone.0057987. Available from: http://dx.plos.org/10.1371/journal.pone.0057987. [DOI] [PMC free article] [PubMed] [Google Scholar]
- World Health Organization. Electronic nicotine delivery systems. Conference of the Parties to the WHO Framework Convention on Tobacco Control; Sixth session Moscow; Russian Federation; 2014. [Google Scholar]
- Yingst JM, Veldheer S, Hrabovsky S, Nichols TT, Wilson SJ, Foulds J. Factors associated with electronic cigarette users’ device preferences and transition from first generation to advanced generation devices. Nicotine Tob Res. 2015;17:1242–1246. doi: 10.1093/ntr/ntv052. [DOI] [PMC free article] [PubMed] [Google Scholar]
- Zhang Y, Sumner W, Chen DR. In Vitro Particle Size Distributions in Electronic and Conventional Cigarette Aerosols Suggest Comparable Deposition Patterns. Nicotine Tob Res [Internet] 2013;15:501–508. doi: 10.1093/ntr/nts165. Available from: http://ntr.oxfordjournals.org/cgi/doi/10.1093/ntr/nts165. [DOI] [PubMed] [Google Scholar]
- Zhu S-H, Sun JY, Bonnevie E, Cummins SE, Gamst A, Yin L, Lee M. Four hundred and sixty brands of e-cigarettes and counting: implications for product regulation. Tob Control [Internet] 2014;23:iii3–iii9. doi: 10.1136/tobaccocontrol-2014-051670. Available from: http://tobaccocontrol.bmj.com/cgi/doi/10.1136/tobaccocontrol-2014-051670. [DOI] [PMC free article] [PubMed] [Google Scholar]
Associated Data
This section collects any data citations, data availability statements, or supplementary materials included in this article.