Vertebrate photoreceptors need to distinguish light signals from background noise to convey visual information to downstream bipolar cells. By affecting both signal and noise, Astakhova et al. find that increases in intracellular cAMP can improve the signal-to-noise ratio by twofold.
Abstract
The absolute sensitivity of vertebrate retinas is set by a background noise, called dark noise, which originates from several different cell types and is generated by different molecular mechanisms. The major share of dark noise is produced by photoreceptors and consists of two components, discrete and continuous. Discrete noise is generated by spontaneous thermal activations of visual pigment. These events are undistinguishable from real single-photon responses (SPRs) and might be considered an equivalent of the signal. Continuous noise is produced by spontaneous fluctuations of the catalytic activity of the cGMP phosphodiesterase. This masks both SPR and spontaneous SPR-like responses. Circadian rhythms affect photoreceptors, among other systems by periodically increasing intracellular cAMP levels ([cAMP]in), which increases the size and changes the shape of SPRs. Here, we show that forskolin, a tool that increases [cAMP]in, affects the magnitude and frequency spectrum of the continuous and discrete components of dark noise in photoreceptors. By changing both components of rod signaling, the signal and the noise, cAMP is able to increase the photoreceptor signal-to-noise ratio by twofold. We propose that this results in a substantial improvement of signal detection, without compromising noise rejection, at the rod bipolar cell synapse.
Introduction
Dark-adapted retinal rod photoreceptors achieve ultimate sensitivity being able to count single photons. However, to elicit a minimum sense of light in the visual system, it requires that a few (five to seven) photons were absorbed and evoked responses in rods within the same receptive field (Hecht et al., 1942; reviewed in Rieke and Baylor, 1998a). It is suggested that the threshold is set by the collective noise accompanying the signal flow through the visual system (reviewed in Pahlberg and Sampath, 2011). One of the noise sources resides in photoreceptors themselves. Even in complete darkness, rods produce fluctuations of the flowing current that consist of two components, discrete and continuous (Baylor et al., 1980). The discrete noise is generated by spontaneous thermal activations of the visual pigment, which evoke waves of photocurrent indistinguishable from responses of the cell to real photons. The “continuous” noise is plausibly attributed to spontaneous fluctuations of the catalytic activity of the cGMP phosphodiesterase (Rieke and Baylor, 1996).
Because the discrete dark events cannot be distinguished from responses to photons, their rejection or loss during further retinal processing would inevitably hamper the detection of real weak stimuli. In a sense, the discrete dark noise can be considered an equivalent of the signal that should be discriminated from other sources of the noise in the visual system. An obvious source of the noise is the continuous noise generated by rods themselves. In an individual rod, the amplitude of the single-photon response (SPR) exceeds the SD of continuous current fluctuations by three- to fivefold, so discrete events can usually be detected in recordings from isolated rods. However, the second link in the signal flow chain, the ON rod bipolar cell, collects signals from many rods (20–100 in mammalians; Berntson et al., 2004; Trexler et al., 2011; reviewed in Field et al., 2005; Pahlberg and Sampath, 2011). Even at intensities well above the behavioral threshold, one photon at best arrives at a particular bipolar receptive field during the physiological summation time. Yet during the same period, the bipolar cell also collects continuous noise from all wired rods. Thus, the total level of the continuous noise at the rod bipolar synapses significantly exceeds the level of the response to single photon. If there were linear transfer of the signal from rods to rod bipolars, responses to light would sink in the continuous noise. Ameliorating the problem, the rod bipolar synapse transfer function is significantly nonlinear. Its threshold-like character selectively passes high-amplitude SPRs and suppresses low-amplitude continuous noise coming from each individual rod input (van Rossum and Smith, 1998; Field and Rieke, 2002; Berntson et al., 2004; Sampath and Rieke, 2004; Trexler et al., 2011). So it is obvious that the signal-to-noise ratio (SNR) in individual rods may be an important factor in adaptation of the visual system to various lighting conditions.
One of the adaptations may be the adjustment of retinal sensitivity during natural day–night transition. It is shown that photoreceptors are affected by the circadian cycle, which is controlled in the retina by a reciprocal pair of neurotransmitters, dopamine and melatonin (reviewed in Witkovsky, 2004; Wiechmann and Sherry, 2013; McMahon et al., 2014; Popova, 2014). Dopamine via D2 dopamine receptors suppresses synthesis of cAMP in retinal rods (Cohen and Blazynski, 1990; Cohen et al., 1992; Nir et al., 2002; Patel et al., 2003). In the dark period of the cycle, when dopamine content in the retina is low, cAMP concentration in rod cytoplasm is up to two times higher than in the light period (Traverso et al., 2002; Ivanova and Iuvone, 2003; Fukuhara et al., 2004; Li et al., 2008). In the preceding study, we have demonstrated that an artificial elevation of intracellular cAMP level by an activator of the adenylyl cyclase forskolin increases size and changes shape of SPRs of frog rod photoreceptors (Astakhova et al., 2012) without markedly affecting biochemical amplification. Here, we report that forskolin also affects the magnitude and frequency spectrum of the continuous component of the dark noise of the toad photoreceptor current. The mean rate of SPR-like discrete events does not change. We show that simultaneous changes of both components of rod signaling, the signal and the noise, increase the photoreceptor SNR by ca. twofold. This may result in a substantial improvement of signal detection without compromising noise rejection at the bipolar level, provided that the nonlinear filter at the synapse is properly adjusted.
Materials and methods
Animals and preparations
Adult frogs Rana ridibunda were caught in wild in southern Russia; toads Bufo bufo were caught in a St. Petersburg neighborhood. Both amphibian species were kept for up to 6 mo with free access to water at 10–15°C on a natural day–night cycle and fed by mealworms. Animals were treated in accordance with the European Communities Council Directive (24th November 1986; 86/609/EEC), and the protocol was approved by the local Institutional Animal Care and Use Committee. Before the experiment, animals were dark-adapted overnight. Eyes were enucleated, and the retinas were extracted under dim red light. All further procedures were conducted at infrared TV surveillance. Suction recordings were performed from rods attached to small pieces of the retina, as devised by Baylor et al. (1979a).
Electrical recordings and solutions
The specific details of our suction setup design and functioning are described previously (Astakhova et al., 2008). Change of the solutions in the perfusion chamber was achieved by switching the basic perfusion and typically was complete in ∼5 min. The light stimulation system consisted of two independent channels based on high-output LEDs with λmax = 521 and 631 nm. Comparing sensitivities at the two wavelengths allowed distinguishing between red (rhodopsin) and “green” (blue-sensitive) rods. All presented recordings were done from rhodopsin rods using 521-nm stimuli. Stimulus intensity was controlled by switchable ND filters and LED current. Typically, we used 10-ms flashes to stimulate a rod. Responses were low-pass filtered at 20 or 30 Hz (8-pole analog Bessel filter) and recorded at 2-ms digitization interval. Flash intensity was calibrated for the majority of individual rods using the Poisson statistics of responses to weak flashes (Baylor et al., 1979b). Because even few-photon responses are not quite linear but rather compressed as the result of saturation, the amplitude of every response was corrected for saturation by calculating imaginary “linear” responses as described previously (Astakhova et al., 2012). Long-lasting recordings of the dark current noise were divided into epochs containing 16,384 points (32.7-s duration). Alternatively, to reduce the volume of data, original recordings could be outputted in 10-ms intervals and divided into 4,096-point epochs (40.96-s duration). Each epoch was corrected for slow trend (see Appendix) and used for further analysis. Power density spectrum of the noise was computed using conventional Fast-Fourier transform algorithm (FFT function in MathCad 13, MathSoft, or FFT Power Spectral Density function in LabView software). In every rod, the noise spectra in various experimental conditions were calculated as the mean of spectra of 40–60 epochs.
Throughout the text, data are presented as mean ± SEM. All experimental data were analyzed using STATISTICA software. In most cases, effects of forskolin are expressed as a ratio of post- and pretreated parameters and analyzed with t test for single means (α = 0.05).
Solutions
Main Ringer solution referred to as normal contained (mM): 90 NaCl, 2.5 KCl, 1.4 MgCl2, 1.05 CaCl2, 5 NaHCO3, 5 HEPES, 10 glucose, and 0.05 EDTA, pH adjusted to 7.6. Drug-containing solution was normal solution plus 2 µM of forskolin (Sigma-Aldrich). Temperature was held at 17–19°C.
Typical experimental protocol
A cell chosen under infrared was first tested in normal solution by short light flashes of different intensities, to determine its sensitivity and the size of the dark current. Then 20 to 60 epochs of the photoreceptor current were recorded in complete darkness, whereupon the cell was tested again. At this point, a series of 40 responses to very dim flashes (from 2 to 4 photoisomerizations per flash) was recorded to estimate the size and the shape of the single quantum response, as in Baylor et al. (1979b). Next, the normal Ringer solution in the bathing chamber was replaced by drug-containing solution, and the cell was allowed to stay in this solution for ∼25 min to develop the effect(s) of the drug. Then again the epochs of the dark current were recorded and the cell was tested to control its sensitivity and the dark current size. Typical duration of the whole protocol was between 1.5 and 2 h, and only those cells whose parameters were stable during the entire period were included in the analysis.
Results
Forskolin affects sensitivity of attached rod photoreceptors but not their dark current
Earlier we have demonstrated that forskolin affects the sensitivity of isolated frog rod photoreceptors. An application of 2 µM of forskolin to the outer segment of the rod sucked with the inner segment in the pipette resulted in ∼2.4 times elevation of sensitivity, whereas the magnitude of the dark current did not change systematically. The sensitivity increase was caused by a retardation of the photoresponse turn-off; the steepness of the rising phase of the response (= biochemical amplification) did not change (Astakhova et al., 2012). In the present work, we made recordings from rods attached to the retina and sucked outer segment in the pipette. This was necessary to ensure stability of the cell’s condition during long-lasting recordings of the dark noise. Thus, we had to test whether the application of forskolin to the inner segment of a retina-attached rod has the same effect on photoresponse as the application to the outer segment of an isolated rod.
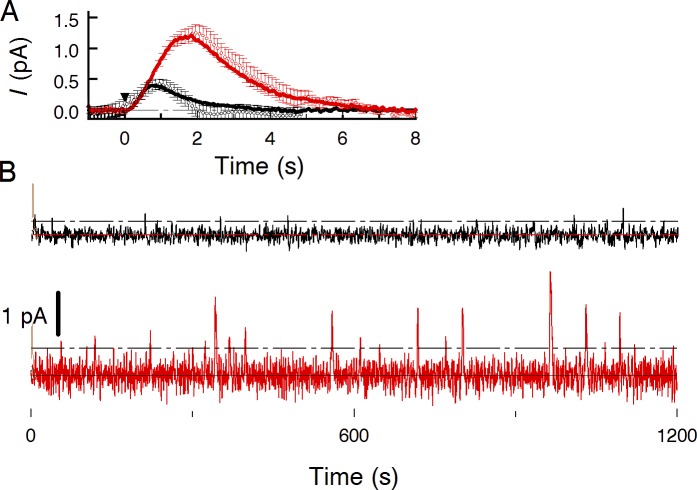
It appeared that the effect of forskolin on retina-attached cells closely mimicked that in isolated rods. Applying 2 µM forskolin to the inner segment produced 2.1 ± 0.5 times (n = 12) increase of sensitivity to weak nonsaturating light stimuli in frog rods and 2.1 ± 0.6 times (n = 13) increase of sensitivity in toad rods (Fig. 1 A). The magnitude of the dark current in attached rods was not affected by forskolin (Table 1). Amplification of the cascade did not change either (compare initial parts of black and red curves in Fig. 1 A).
Figure 1.
Sample recordings of the dark current of a toad rod in normal and forskolin-containing Ringer. (A) SPRs in normal Ringer (black curve) and Ringer with 2 mM forskolin (red curve) derived from statistics of 40 responses to weak (mean 2.2 R*) flashes. Circles with error bars show discrete dark events that were cut off continuous records, aligned along time axis and averaged. Each point is the mean of 15 events ± SEM. (B) Long-lasting continuous record of the rod in complete darkness, in normal Ringer (black trace) and in forskolin-containing solution (red trace). Recordings were digitally low-pass filtered at 3 Hz (8-pole Bessel filter) and corrected for slow irregularities of the base line (Appendix, Fig. 10). Dark current was 24.4 pA and did not change more than ±0.5 pA during the recording.
Table 1. Stability of the dark current during the experiment.
| Species | Id NR | Id Forsk | Forsk/NR ratio |
|---|---|---|---|
| pA | pA | ||
| Frog | 30.3 ± 3.3 (10) | 29.2 ± 3.9 (10) | 0.95 ± 0.06 (10) |
| Toad | 22.8 ± 1.6 (11) | 20.5 ± 2.0 (11) | 0.89 ± 0.06 (11) |
Dark current in normal Ringer, Id NR, was measured at the start of the recording. Dark current in forskolin-containing solution, Id Forsk, was measured at the end of the perfusion with forskolin. Each value is mean ± SEM. The number of rods is given in parentheses. Paired t test shows no statistically significant effect of forskolin.
Forskolin similarly affects both the responses to singe photons and discrete dark current noise
In both B. bufo and R. ridibunda rods, forskolin affected the dark noise. In accordance with the increase of light sensitivity to flashes, the amplitude of discrete dark events in 2 µM forskolin increased over twofold (Table 2; compare red and black curves in Fig. 1, A and B). The continuous noise also obviously increased, at least in toad rods. To analyze the effect of forskolin on discrete dark events, we identified the events as positive-going peaks that exceeded three SDs of the continuous noise. Then ∼10-s long stretches that contained the events were excised from the record. The stretches were mutually aligned along the time axis by minimizing sum of squares difference over the rising phase between the fronts of the discrete events. Further, the stretches were averaged. Fig. 1 A shows that both in normal Ringer and in forskolin-containing solution, mean discrete events virtually coincided with mean SPRs. Thus, forskolin identically affected the light-initiated and thermally initiated processes. In this particular cell, the amplitude of the SPR rose threefold, and the time to peak increased 2.3 times. The slope of the response front did not change. Rate of the discrete dark events did not change significantly either (Table 2).
Table 2. Effect of forskolin on the parameters of photoresponse and dark current noise.
| Species | SPRNR | SPRForsk | SPRForsk/ SPRNR | SDNR | SDForsk | SDForsk/SDNR | S/NNR | S/Nforsk | S/Nforsk/S/NNR | νdeNR | νdeForsk | νdeForsk/νdeNR |
|---|---|---|---|---|---|---|---|---|---|---|---|---|
| pA | pA | pA | pA | µm−3s−1 × 10⁻⁶ | µm−3s−1 × 10⁻⁶ | |||||||
| Frog | 0.48 ± 0.09 (9) | 0.87 ± 0.13 (9) | 2.1 ± 0.30a (9) | 0.20 ± 0.01 (8) | 0.21 ± 0.02 (8) | 1.03 ± 0.06 (8) | 2.30 ± 0.42 (8) | 4.17 ± 0.57 (8) | 2.08 ± 0.29a (8) | 22 ± 2.5 (5) | 21 ± 3.4 (5) | 0.97 ± 0.19 (5) |
| Toad | 0.84 ± 0.13 (10) | 1.69 ± 0.18 (10) | 2.32 ± 0.35a (10) | 0.23 ± 0.02 (10) | 0.28 ± 0.02 (10) | 1.20 ± 0.05a (10) | 3.36 ± 0.53 (9) | 6.32 ± 0.8 (9) | 2.10 ± 0.34a (9) | 9.3 ± 1.8 (6) | 9.2 ± 1.0 (6) | 1.09 ± 0.13 (6) |
SPRNR and SPRForsk are amplitudes of SPRs in normal Ringer and in forskolin-containing solution, respectively. SD is standard deviation of continuous dark noise. S/N = SPR/SD stands for SNR. νdeNR and νdeForsk are rates of discrete dark events expressed as the number of events per second per µm3 of the rod outer segment volume.
Statistically significant effects of forskolin perfusion (P < 0.05).
Forskolin increases the power of the continuous dark noise in toad rods and changes its frequency spectrum
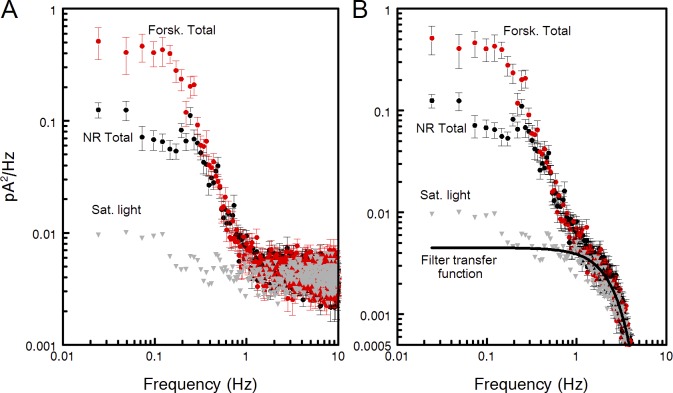
Long-term recordings of the dark noise, which could last up to a couple of hours, inevitably suffered from irregular drift of the base line. The procedure of removing slow irregular oscillations and drift of the base line is described in the Appendix. Power spectra of the dark noise traces corrected this way runs beyond ca. 3 Hz approximately horizontally in all experimental conditions (Fig. 2 A). Apparently, in this range it is dominated by the instrumental noise that is seen in the recordings on saturating light background (Fig. 2 A, gray triangles). The noise originating in the phototransduction cascade was isolated by subtracting the instrumental noise from total noise. All further noise spectra were processed this way; in addition, a Bessel-type digital filtering with cut off at 3 Hz was applied (Fig. 2 B).
Figure 2.
Sample power spectra of total (continuous and discrete) dark noise in normal Ringer (NR) and forskolin perfusion (Forsk). Recordings were digitized at 2 ms and analogue-filtered at 20 Hz. During processing, the spectra were outputted at 10-ms digitization, and each spectrum computed as the mean of 30 epochs of 40.96-s duration. Error bars show SEMs. Dark current was 23 pA. (A) Raw spectra of the recordings without extra digital filtration. Gray triangles show the spectrum of the noise recorded in saturating light when all cGMP-gated channels are closed. This spectrum was further used as characterizing instrumental noise. (B) Spectra of A digitally filtered by ksmooth function in MathCad using 165-ms window that is a good approximation of 8-pole Bessel 3-Hz filtration. The power gain transfer function of the filter is shown by the heavy black line. The curve is downscaled for best match to the mean of all three experimental spectra between 1 and 10 Hz.
The dark noise consists of at least three components: discrete events produced by random spontaneous activation of rhodopsin, continuous noise caused by fluctuations of the dark PDE activity, and channel noise (Rieke and Baylor, 1996). The spectrum of the channel noise is multi-component and extends to ≈1,000 Hz. Below 1 Hz, the channel noise is approximately two orders of magnitude lower than the other two sources, but may dominate the noise above a few hertz (Rieke and Baylor, 1996). We saw no effect of forskolin in this region (Fig. 2 A), so the channel noise was neglected during the analysis of the dark noise between 0 and 3 Hz.
The two components of the noise, discrete events and continuous noise, have to be separated for further analysis. In most cells, the discrete events could reliably be detected against the background continuous noise (like in Fig. 1 B) as the peaks that cross the criterion level of three SDs of the continuous noise. Then they were counted by eye. Further, short stretches containing individual events were cut off the recordings. The rest was concatenated and used to calculate the amplitude distribution, SD, and the power spectrum of the continuous noise.
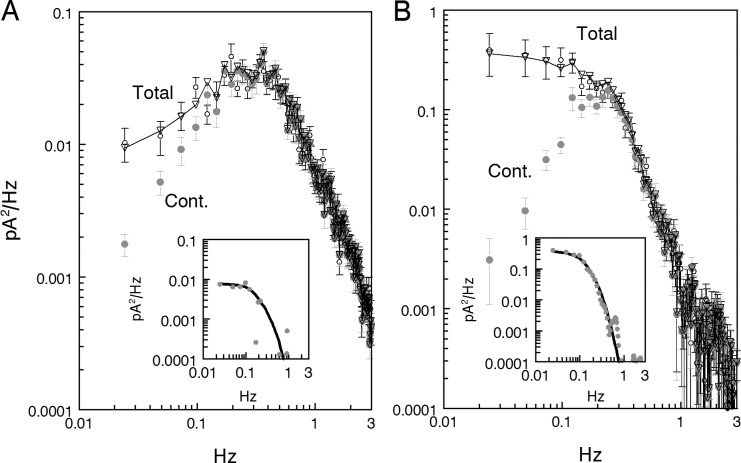
This favorable situation is illustrated in Fig. 3. The total (discrete and continuous) noise spectra in normal Ringer and forskolin-containing solution were plotted from recordings in Fig. 1 B. Corresponding continuous noise spectra were computed after excising discrete events from the curves (13 criterion-crossing waves in normal Ringer and 19 events in forskolin). Perfusion with forskolin increased the peak power of the total noise by an order of magnitude (Fig. 3, A and B, open black circles). The effect of forskolin on the peak of the continuous noise was approximately sixfold (Fig. 3, A and B, gray filled circles). As should be expected, adding the power spectrum of the SPR occurring once in 92 s in normal Ringer (13 events per 1,200 s) to the continuous nose yields a good approximation of the total noise (Fig. 3 A, downward triangles). Good approximation of the total noise in forskolin solution can be obtained by adding to the continuous noise the spectrum of SPR occurring once in 52 s (Fig. 3 B, downward triangles). Another approach to determining the frequency of discrete vents is to compare the difference between the total and continuous power spectra with the power spectrum of averaged SPRs, as shown in insets in Fig. 3 (A and B). The two approaches yielded the same result. However, the rate of discrete events in forskolin solution (once in 52 s) inferred from noise analysis is higher than should be expected based on 19 clearly discernible discrete events per 1,200 s (once in 63 s). Possible reasons for this discrepancy will be considered in the Discussion.
Figure 3.
Separation of discrete and continuous noise. (A) Normal Ringer. (B) Forskolin-containing perfusion. Same spectra as in Fig. 2 B, but corrected by subtracting instrumental noise. Graphs labeled Total refer to original recordings containing both continuous and discrete noise. Graphs labeled Continuous were calculated from recordings with manually removed discrete dark events as described in the Appendix. 13 discrete events were counted in A and 19 events in B, yielding a mean interval between events of 92 and 63 s, respectively. Insets show difference spectra between Total and Continuous curves smoothed with 3-point running mean (gray circles). Smooth black lines in the insets show power spectra of model fits to averaged SPRs, one event per 92 s in A and one event per 53 s in B. If the SPR spectra are summed with the corresponding continuous spectra, the result fits total noise quite well (downward triangles in main panels). The frequency of discrete events derived from spectral fit in normal Ringer coincides with that obtained by direct count. In forskolin (B), however, the events rate derived from spectral fit was substantially higher than follows from direct count. A possible reason for discrepancy is given in the Discussion.
If discrete events cannot be isolated by eye with confidence because of lower SNR, the mean rate of the events was determined by fitting the histogram of recorded current values p(i) (total noise) with the probability density histogram of the SPR convolved with a Gaussian continuous noise (Donner et al., 1990):
| (1) |
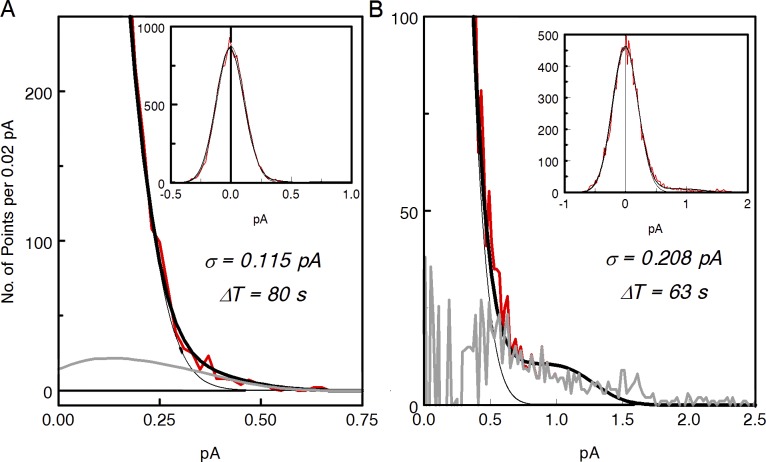
Here, A is a normalizing factor, σ2 is the dispersion of the continuous noise and, r(t) is the response of the cell to single quantum. ΔT(s) is the mean interval between two SPR-like dark events, that is, the reciprocal of the mean frequency of events. r(t) was obtained from the statistics of ∼40 responses to weak (2–4 R*) flashes (see Methods, Baylor et al., 1979b). σ and ΔT were found by fitting Eq. 1 to the experimental histogram of the dark current values (Fig. 4). σ is unambiguously determined by fitting the left (negative) wing of the distribution. Notably, the fit was always excellent showing that the continuous noise is indeed Gaussian-distributed. Thus, ΔT is the only free fitting parameter. ΔT was chosen to obtain the area of the positive part of the fit equal to the area of the positive part of the experimental histogram.
Figure 4.
Determining the rate of discrete dark events by histogram fit. (A and B) Noisy black lines in insets show histograms of the noise current values in normal Ringer (A) and in Ringer + 2 mM forskolin (B). Histogram bin 0.01 pA. Heavy black lines in main panes are best approximations of the experimental histograms with the Eq. 1. As r(t) in Eq. 1, SPRs determined from few-photon statistics were taken. Parameters of the fits are given in each panel. Thin black lines show the Gaussians component of the continuous noise from Eq. 1. Difference in the mean rate of the spontaneous events between A and B is apparently the result of statistical fluctuations. The full set of data from the cell shows no statistically significant effect of forskolin on discrete events rate (Table 2). The noisy gray line in B shows the difference between the experimental histogram and Gaussian of the continuous noise. It represents the contribution of discrete events to histogram. The smooth gray line in A is the difference between total fitted histogram and the Gaussian of continuous noise. It is supposed to be an analogue of the gray curve in B that cannot be reasonably computed in A because of poor SNR.
Eq. 1 provided a good fit to data in normal Ringer (Fig. 4 A). Rates of discrete events derived this way were within ±15% of values obtained by direct count. As an additional check of the histogram method, we tested it with a dim light of known intensity (≈0.02–0.06 isomerizations per second). The result confirms that the histogram method is accurate within 20% in normal Ringer. In contrast, quality of the fit to the far right wing of the histogram in forskolin solution was rather poor (Fig. 4 B). Rates of discrete events obtained in forskolin could be 40% off the value reliable counted in the rods with the highest SNR. The problem will be considered in the Discussion.
The SNR that we define as the ratio of the SPR amplitude to the SD of the continuous noise increased under forskolin action 2.08 ± 0.27 times (value ± SEM) in frog and 2.1 ± 0.34 times (value ± SEM) in toad rods (Table 2).
Thus, we show that the treatment by 2 µM forskolin, probably via elevated intracellular cAMP level, significantly increases powers of both components of the dark current noise, continuous and discrete, and changes their frequency spectra. Power of the discrete component increases as the result of higher amplitude and duration of the dark photon-like events. The rate of the events does not change significantly (Table 2). The increase of the continuous noise is obviously related to changed properties of the basally active phosphodiesterase (PDE), but at the moment one may only guess what factors might cause it.
Discussion
Possible molecular mechanisms underlying changes of the dark noise
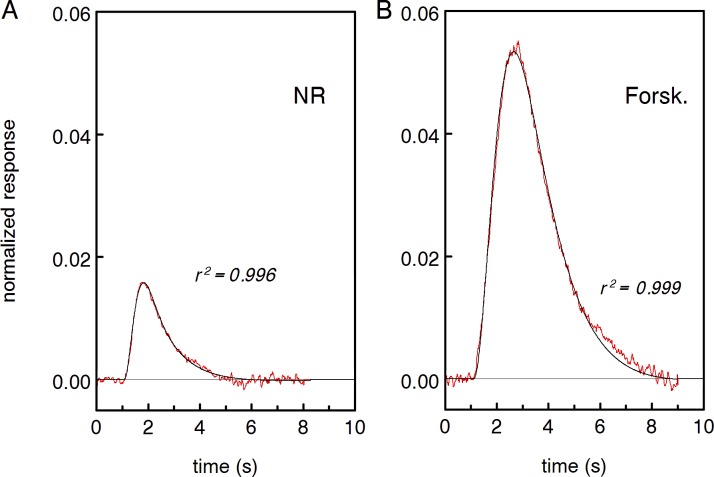
The basic experimental finding of this paper is that elevation of intracellular cAMP level caused by application of forskolin to intact rods significantly affects both major components of the noise of the dark current in amphibian rod photoreceptors. The power of discrete and continuous noise increases, and the shapes of their spectra change. The mechanisms of these changes are different. The power spectrum of the discrete noise changes because single quantum responses and discrete dark events grow in amplitude and get slower (Fig. 1 A). Earlier, we have shown that the increase of the SPR amplitude under forskolin is caused by a delayed recovery of the response. Biochemical amplification remained virtually constant that can be ascertained from unchanged initial slope of the response (Astakhova et al., 2012; see also Fig. 1 A of the present paper). We used our minimum essential model (MEM) of phototransduction (Astakhova et al., 2012, 2015) for quantifying changes of the parameters of the cascade induced by forskolin. MEM provided excellent description of the responses (Fig. 5). Parameters of the fits are given in Table 3.
Figure 5.
MEM (Astakhova et al., 2015) provides good approximation of SPRs. (A and B) The noisy red line in each panel is the mean SPR. Smooth black lines are generated by the model. Parameters of the fits are given in Table 3.
Table 3. Basic response-shaping parameters of MEM fitting of SPRs shown in Fig. 5.
| Parameter | Units | NR | Forsk. | |
|---|---|---|---|---|
| Dark cGMP turnover rate | Pd | s−1 | 0.625 | 0.21 |
| Dark cGMP concentration | cGd | µM | 3 | 3 |
| Fraction of dark current carried by Ca2+ | fCa | - | 0.15 | 0.25 |
| Dark Ca2+ concentration | Cad | µM | 0.5 | 0.75 |
| Fast cytoplasmic Ca2+ turnover rate | β | s−1 | 3.2 | 2.2 |
| Maximum guanylate cyclase activity at 0 Ca2+ | αmax | µM⋅s−1 | 12.4 | 12 |
| Rate of Rh turn-off at Cad | Rhd | s−1 | 0.964 | 0.81 |
| Rate of inactivation of light-activated PDE | kE | s−1 | 3 | 1.1 |
| Rate of PDE activation by R* | νRE | s−1 | 200 | 180 |
In accordance with our previous results (Astakhova et al., 2012), the basic changes were threefold decrease of the dark cGMP turnover rate (basal PDE activity Pd), 1.66-fold increase of the fraction of dark current carried by Ca2+, and 1.5-fold increase of dark cytoplasmic Ca2+ concentration (the numbers refer to the particular cell shown in Fig. 5). Some other changes revealed by MEM (slower cytoplasmic Ca2+ turnover, slower turn-off of light-activated rhodopsin, and slower turn-off of light-activated PDE) may result from elevated cytoplasmic calcium. Importantly, no special adjustment was necessary to the model parameters, except Pd, to ensure unchanged dark current. Inhibition of cGMP synthesis by elevated Ca2+ was completely compensated by reduced Pd. A key parameter of guanylate cyclase, its maximum activity at zero Ca2+, remained unchanged. Apparent small decrease of the rate of activation of the cascade νRE is at the border of detectability. The parameters derived from MEM were close to the values that we obtained earlier, partly in direct experimental measurements (Astakhova et al., 2012). Therefore, we used the parameters of Table 3 as constraints for further fitting of the model of generation of the continuous dark noise developed by Rieke and Baylor (1996).
High amplitude of discrete dark events in rods treated by forskolin allows to reliably isolate them from continuous recordings, at least in toad rods. It provided good direct evidence that the (mean) discrete dark events are identical to (mean) SPRs (Fig. 2). This fact was established in the first paper on rod dark noise, although in a less direct way by spectral analysis (Baylor et al., 1980). It is exemplified in the insets of our Fig. 3. Comparison of discrete dark events and SPRs could not reliably be done in frog rods, though, because of the substantially poorer SNR compared with toads (Table 2).
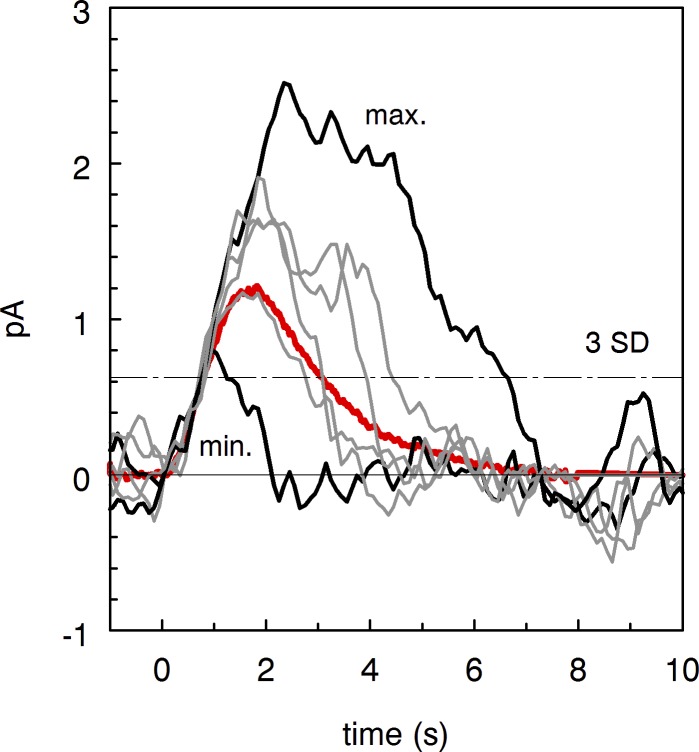
Amplitudes of discrete dark events in toad rods varied greatly. Coefficient of variation CV = SEM/Mean was 0.312 ± 0.026 in normal Ringer and 0.382 ± 0.026 in forskolin perfusion. Mean CVforsk to CVNR ratio was 1.26 ± 0.105 (10 rods). Difference was significant in paired t test (P < 0.05). Comparison of mutually aligned individual discrete events reveals an interesting feature. Though there is a big variation of the amplitudes of the events (over threefold), all responses follow the same initial trace peeling away from it at various moments (Fig. 6). The behavior is similar to that of a fraction of light-induced SPRs in Bufo marinus rods reported by Whitlock and Lamb (1999) (Fig. 2 B). However, this fraction of SPR was specifically selected by Whitlock and Lamb (1999) from an entire population of SPRs as exhibiting this property. No such selection was done in Fig. 6, so this variability seems a general property of discrete dark events, at least in our experiments. Notably, discrete dark events shown in Fig. 6 strikingly resemble the responses generated by the Binary Model of rhodopsin turn-off recently developed by Lamb and Kraft (2016) (see Fig. 2 in Lamb and Kraft [2016]).
Figure 6.
Comparison of individual discrete events in forskolin-containing perfusion. Discrete events were identified as peaks crossing three SDs of the continuous noise and excised from the recording shown in Fig. 1 B. Then individual waves were shifted along the time axis for the least squares match between their initial rising phases. Mean of 15 excised dark events is similar to mean SPR taken from Fig. 1 A (heavy red line). The dot-dashed horizontal line shows the criterion level to select discrete events.
It is generally assumed that SPRs are pretty standard, having CV ≈ 0.2 and following similar time course. Thus, the mechanisms are sought that could ensure such a reproducibility (e.g., reviewed in Rieke and Baylor, 1998b; Lamb and Kraft, 2016). Obviously, elevation of cAMP by forskolin may be a good tool for studying mechanisms responsible for reproducibility of SPRs in rods. Unfortunately, this problem was outside the scope of the present work.
Gross variability of individual discrete events means that a “mean” event (or averaged SPR) is not necessarily an accurate representation of individual responses. This explains the fact that it was not possible to accurately predict the probability distribution of the total noise by a convolution of the continuous Gaussian noise with averaged SPR though the latter is identical to mean discrete event (Eq. 1 and Figs. 1 A and 4 B). This may also explain the discrepancy between the results of estimating the rate of discrete events by simply counting them and by spectral analyses (see Fig. 3 and related test). Because the power noise is a quadratic form of the current, the power of the mean current response shown in Fig. 6 is lower than the mean power of its individual current components. Hence the difference between the total (discrete + continuous) power and the power of the continuous noise in Fig. 3 B is larger than the power of a mean discrete event times the number of the events. Therefore, calculating the number of greatly varying events via mean noise power spectra yields an overestimate.
Action of cAMP on continuous noise
One of the initial objectives of our work was to clarify what molecular parameters of the phosphodiesterase are affected by cAMP-dependent phosphorylation. The experiments of Rieke and Baylor (1996) established that the sole source of the continuous noise in rods is fluctuations of dark PDE activity. The mean basal (“dark”) PDE activity and its noise were supposed to arise from random jumps of individual PDE molecules between completely inactive and fully active state. We have found that the basal PDE activity (hence cGMP turnover rate) in rod decreases two- to threefold under forskolin action (Astakhova et al., 2012; and the present work), pointing to changes of the kinetics of PDE spontaneous activation and inactivation. General increase of low-frequency noise (Fig. 3) in forskolin-containing perfusion is consistent with the slowed cGMP turnover. However, our attempts to further analyze the factors that may underlie observed noise changes within the framework of Rieke and Baylor (1996) model failed. We were unable to reasonably fit the power spectra of the continuous noise with the theoretical equation (see Eq. 26 in Rieke and Baylor [1996]), provided that the fit was restrained by values of a few basic parameters known from independent experiments. The scheme in Rieke and Baylor (1996) starts from two molecular rate constants that determine random jumps of each PDE from a basal zero-activity state to fully active state (k1), and its relaxation back to zero (k2). Along with the catalytic activity of single PDE subunit â, they set the mean PDE activity Pd (hence cGMP turnover rate) and create random fluctuations of the rate of cGMP hydrolysis (we use notation as in Rieke and Baylor [1996]). Further, fluctuations of the hydrolysis are translated into fluctuations of cGMP concentration whose magnitude and frequency spectrum depend on Pd and the rate of Ca2+ feedback onto cGMP synthesis (β). Randomly changing cGMP concentration, via cGMP-gated channels, produces noisy dark current that is measured in physiological experiment.
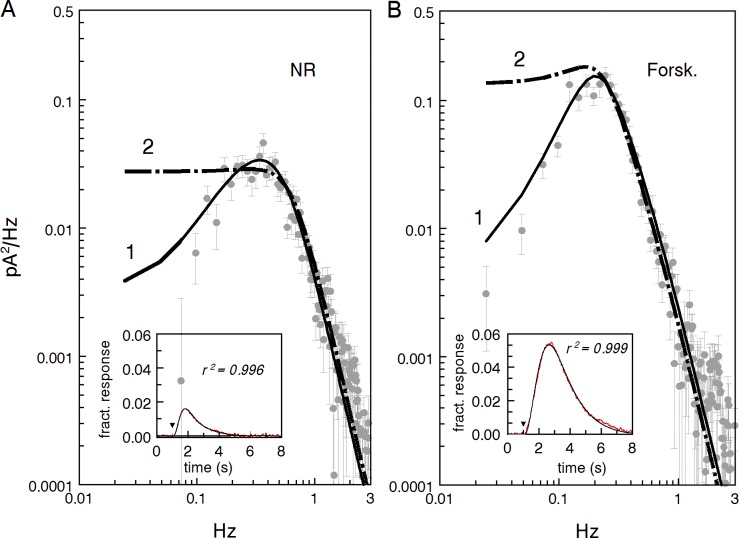
There is no information on values of k1 and k2 so they can be varied freely during fitting. However, the ranges of possible values of Pd, β, and â are known rather reliably (Pd and β, Astakhova et al., 2008, 2012, 2015; â, Leskov et al., 2000; Muradov et al., 2010). We found that if no constraints are applied to values of the three parameters, it is possible to reproduce experimental spectra of continuous noise fairy well (Fig. 7, symbols and solid curves 1). The deduced Pd, β, and â, however, would be approximately an order of magnitude different from those obtained on the same rod with MEM-modeling of SPRs (Fig. 7, insets). In contrast, if the critical parameters were kept close to experimental data, reasonable fitting was not possible (Fig. 7, dot-dashed lines 2). Fitting and nonfitting parameters, along with the parameters from MEM fits to SPRs, are given in Table 4.
Figure 7.
Attempts to fit continuous dark noise with the model of noise generation by Rieke and Baylor (1996). (A and B) Insets show mean SPRs of the same rod (red lines) fit by MEM (smooth black lines). Reasonable fits of the noise by Rieke and Baylor (1996) model can be obtained both in normal Ringer and forskolin solution if the fitting parameters are nonrestrained (curves 1 in main panes). If the noise-fitting parameters were kept close to the values derived from MEM, reasonable fit was not possible (lines 2). Parameters of the SPR and of “good” and “poor” fits to noise are given in Table 4.
Table 4. Comparing parameters of the transduction cascade derived from MEM and from fitting continuous noise spectra, as in Fig. 7.
| Parameter | Units | NR | Forsk. | ||||||
|---|---|---|---|---|---|---|---|---|---|
| MEM | Noise 1 | Noise 2 | MEM | Noise 1 | Noise 2 | ||||
| Dark cGMP turnover rate | Pd | s−1 | 0.625 | 5.5 | 0.6 | 0.21 | 1.6 | 0.25 | |
| Fast cytoplasmic Ca2+ turnover rate | β | s−1 | 3.2 | 0.45 | 6 | 2.2 | 0.25 | 2 | |
| PDE subunit activity, turnovers per ROS volume | â | µM⋅s−1 | 4.7 × 10⁻⁴ | 1.45 × 10⁻⁵ | 4 × 10⁻⁵ | 4.7 × 10⁻⁴ | 1.65 × 10⁻⁵ | 6.8 × 10⁻⁵ | |
| Rate of inactivation of spontaneously activated PDE | kE | s−1 | - | 1.9 | 7 | - | 4 | 4.75 | |
Columns labeled Noise 1 refer to good-quality fits (curves 1 in Fig. 7, A and B), and those labeled Noise 2 refer to poor fits (curves 2 in Fig. 7, A and B).
The experimental data of Rieke and Baylor (1996) convincingly place the primary source of the continuous dark current noise in PDE molecules and exclude preceding stages of the transduction cascade. Yet it seems that their kinetic scheme for noise production fails. Thus, the molecular mechanisms responsible for the changes of the continuous dark noise in our experiments remain unclear.
SNR and detection of threshold stimuli
As we show, treatment with forskolin, probably via elevated intracellular cAMP level, substantially increases the ratio of the amplitude of the SPR to the SD of the continuous dark noise (Table 2). This increase can be crucial for reliable detection of the photon responses at the second step of the signal transmission at the level of rod bipolar cells. Rod bipolar cells in mammalian retina pool inputs from 20 to 100 rods, and only 1 of 10,000 rods absorbs a photon during the summation time at visual threshold (reviewed by Walraven et al., 1990; Sampath and Rieke, 2004; Pahlberg and Sampath, 2011). Hence, at best a single rod is photon-activated within the receptive field of a given bipolar, whereas the continuous noise is at the same time collected from each rod in the receptive field. Thus, if all rod inputs were linearly summed, the SNR at the bipolar level would decrease 5- to 10-fold, and the photon signal would sink in the continuous noise.
The problem was recognized and its possible solution suggested and corroborated by experimental findings (van Rossum and Smith, 1998; Field and Rieke, 2002; Berntson et al., 2004; Sampath and Rieke, 2004; Trexler et al., 2011; Reingruber et al., 2013). It appeared that the transfer function of the rod bipolar synapse is threshold-like. It selectively suppresses low-amplitude continuous noise and passes high-amplitude discrete responses (whether spontaneous or photon-induced), thus making their detection at the bipolar level possible.
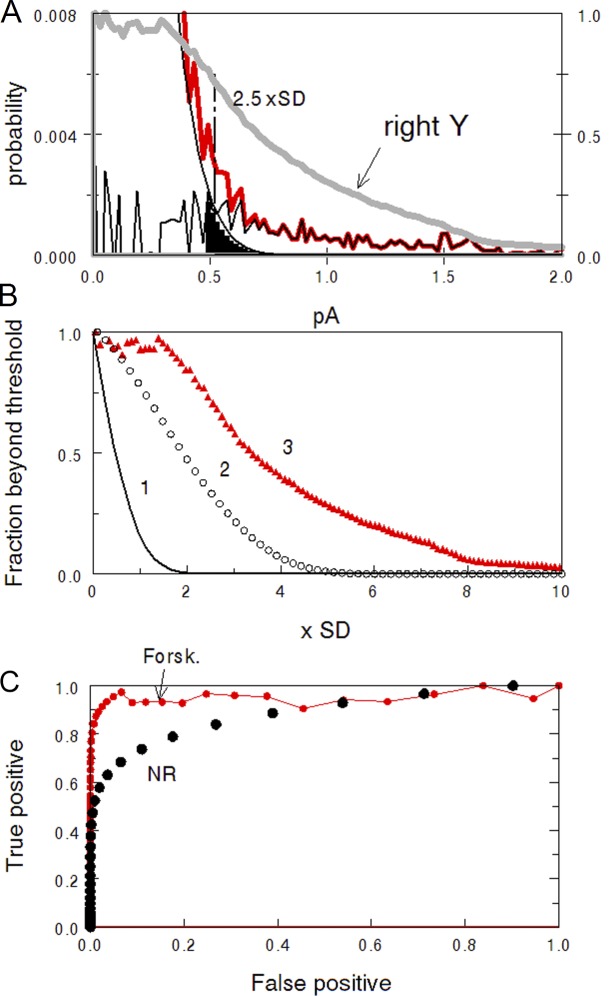
Because the ratio of the amplitudes of the continuous and discrete signals is not high, their separation by the threshold mechanism is not perfect. Depending on the threshold level, random excursions of the continuous noise may exceed the threshold (false alarm), or a discrete response can be rejected (false negative, missing signal). This can be illustrated by a receiver operating characteristic (ROC) analysis (Fig. 8). The smooth black line in Fig. 8 A (essentially Fig. 4 B) shows the positive branch of the probability distribution of readings of continuous noise (determined from Gaussian fitting to the negative branch of the experimental distribution not affected by discrete noise). The red line shows the experimental current distribution that includes both the continuous and discrete noise. The heavy black line is the difference between the total and continuous noise and shows the contribution of discrete events to the histogram. Certain decision threshold can be set (Fig. 8 A, dot-dashed line), so the current values above the threshold are considered a signal, and below it, a noise. For instance, the black-shaded area under the Gaussian and above 2.5 SD threshold belongs to continuous noise erroneously counted as a signal, that is, represents the probability of false alarm. The heavy gray line shows the probability of “real” signal (SPR or discrete dark event) crossing the threshold, that is, the probability of correct detection.
Figure 8.
ROC analysis of the dark noise. (A) The right tail of the histogram of total dark noise from Fig. 4 B. Red line, experimental histogram. Smooth black line, Gaussian of the continuous noise. The noisy black line is the difference between the two showing contribution of discrete events to total noise. Cut-off level set at 2.5 SDs of the Gaussian passes the signals from black-filled area, producing false alarms. The heavy gray curve shows the area below the noisy black curve as a function of the cut-off level, normalized to full area at zero cut-off. It shows the probability of true positive responses. (B) Fraction of continuous noise and discrete signals passing beyond a cut-off level plotted on x. Curve 1, continuous noise above threshold, i.e., false alarms. Circles 2, passed positive signal in normal Ringer (data taken from Fig. 4 A). Triangles 2, passed positive signal in forskolin, data from A. (C) ROC curves showing the relation between the probability of false alarms and true positive responses.
After normalizing to unit at zero threshold (everything passes), the corresponding curves show the probability of false alarm and true alarm as a function of threshold tr (Fig. 8 B). Because the continuous noise is Gaussian, the probability of false alarm is erfc(tr/SD) shown in Fig. 8 B by the smooth dark line. Here erfc() is the complementary error function, tr is the threshold, and SD is the standard deviation of the Gaussian. Empty circles show the probability of “true positives” (correct detections) in normal Ringer calculated for the cell shown in Fig. 8 A. Red triangles show “true positives” versus threshold function in forskolin perfusion for the same cell. It is seen that setting the threshold at, say, 2.5 SD efficiently eliminates continuous noise but at the same time results in 75% loss of signal in normal Ringer, and ∼50% loss of signal in forskolin.
Fig. 8 C is plotted in a traditional ROC way, as a relation between the probabilities of false alarms and true positives, using the decision threshold as a parameter. It is seen that a forskolin-treated cell approaches a perfect detector while its performance in normal Ringer is far more inferior.
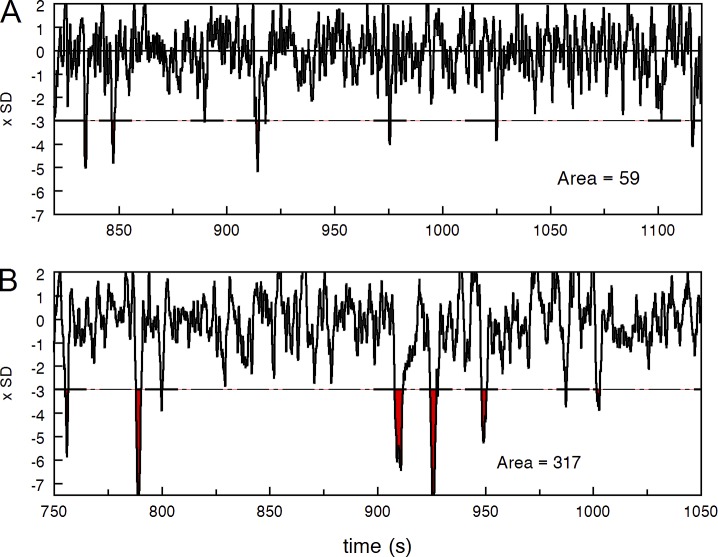
The increase of SNR shown by ROC analysis may not correctly reveal actual improvement of the discrimination of discrete events against the continuous noise, though. The analysis just counts the instances of crossing the threshold by either noise or by signal. It is reasonable to assume that the detectability of a postsynaptic signal in a bipolar is determined not by the mere fact of crossing the threshold level but rather by the time integral of the signal beyond the threshold. Then, for instance, setting a step-wise synaptic threshold at three SDs of the Gaussian continuous noise would result in the probability of the false alarm of 2.1 × 10⁻³. In the same bipolar, 70% increase of the rod SNR caused by forskolin would increase the area of the supra-threshold signal fivefold (Fig. 9). Mean effect on 10 cells was 6.2 ± 2.1-fold.
Figure 9.
Effect of forskolin on detectability of SPRs (either caused by real light or evoked by spontaneous rhodopsin activation) against the continuous noise. (A and B) Long-lasting continuous record of the toad rod in complete darkness in normal Ringer (A) and in forskolin-containing solution (B). Dash-dotted lines in A and B show the supposed threshold level at the rod bipolar synapse equal to three SDs of the continuous noise. Red shaded areas show time integral of the signal beyond the threshold, and values of the areas (in arbitrary units) are reported in the corresponding panels.
Thus, elevated cAMP may substantially increase the postsynaptic signal still keeping negligible false alarm level. The rejection of the continuous noise, however, can only be achieved if the threshold-like synaptic transfer function is properly adjusted, as shown by Okawa et al. (2010) on GCAP-KO mice. Therefore, circadian changes in the cAMP content may have an adaptive significance improving the detection of low-intensity stimuli. It is worth noting, however, that no filtering can further discriminate between discrete events evoked by actual photons, and random spontaneous acts of dark activation of rhodopsin. “Real” vision, that is, recognition of surrounding objects by their size, shape, and lightness, needs first a statistically reliable discrimination between spontaneous rhodopsin activations and mean number of arriving photons, and, second, a good statistics of photons coming from different areas of the image. Besides, extra noise can be added at later stages of signal processing in the retina (Chichilnisky and Rieke, 2005). Therefore, the supposedly beneficial effect of elevated cAMP may only be important for detecting stimuli close to the absolute threshold.
Appendix
Correcting long-term recordings for very low frequency drift
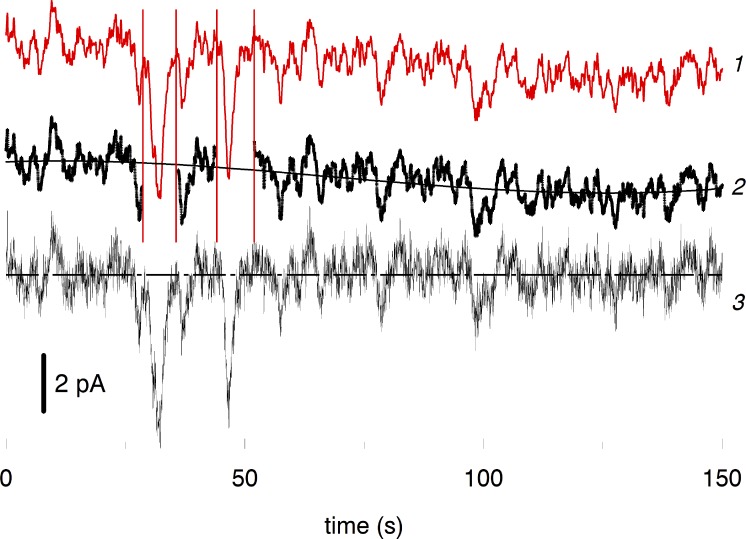
Long-term recordings of the dark noise, which could last up to a couple of hours, inevitably suffered from slow irregular drift of the base line. The drift distorts the histogram of the current values that was used in further analysis, so it had to be removed. The simplest task was dealing with recordings with a good SNR where individual discrete evens could easily be identified, like in toad rods or in frog rods after application of forskolin. The entire record was chopped into stretches of ∼100-s duration, and each stretch was processed separately. The record was digitally low-pass filtered at 3 Hz to improve the visibility of the discrete events (Fig. 10, line 1). Then short pieces of the record that contained discrete events were cut-off, leaving stretches only consisting of the continuous noise (heavy line 2). The resulting data were fit by a least-square polynomial of up to the third order (smooth line across 2), and the polynomial was subtracted from the original nonfiltered stretch leaving the complete (continuous and discrete) record free of the slow drift (curve 3). 100-s stretches, each corrected for the drift, were further concatenated to obtain an entire drift-free record containing both discrete and continuous noise (like those shown in Fig. 1 of the main text). The baseline-corrected stretches left after removal of discrete events were also concatenated to obtain the continuous noise record, which was further subjected to analysis.
Figure 10.
Correction of the recordings for slow irregularities of the base line. Curve 1 is a stretch of an original recording low-pass filtered at 3 Hz to more clearly show discrete dark events. Curve 2, two discrete dark events marked with vertical lines are cut-off from the curve 1 leaving continuous noise. The smooth line through 2 is the best-fitting third-order polynomial representing the baseline drift. Curve 3 shows the original record filtered at 10 Hz and corrected for base line irregularity. The curves are separated vertically to facilitate comparison.
Sometimes it was not possible to separate discrete events from the continuous noise with 100% confidence, like in frog rods in normal Ringer. Then all “suspicious” negative deviations that exceeded 2.5 SD of the continuous noise were considered putative discrete events and cut off the record. The rest was corrected for the slow drift as shown in Fig. 10. The error introduced by possible excess rejection of random big excursions of the current was neglected.
Acknowledgments
This work was supported by Russian Foundation for Basic Research grant 14-04-00428 to M.L. Firsov and Academic Program for Basic Research grant 01201351571.
The authors declare no competing financial interests.
Richard W. Aldrich served as editor.
Footnotes
Abbreviations used:
- MEM
- minimum essential model
- ROC
- receiver operating characteristic
- SNR
- signal-to-noise ratio
- SPR
- single-photon response
References
- Astakhova L.A., Firsov M.L., and Govardovskii V.I.. 2008. Kinetics of turn-offs of frog rod phototransduction cascade. J. Gen. Physiol. 132:587–604. 10.1085/jgp.200810034 [DOI] [PMC free article] [PubMed] [Google Scholar]
- Astakhova L.A., Samoiliuk E.V., Govardovskii V.I., and Firsov M.L.. 2012. cAMP controls rod photoreceptor sensitivity via multiple targets in the phototransduction cascade. J. Gen. Physiol. 140:421–433. 10.1085/jgp.201210811 [DOI] [PMC free article] [PubMed] [Google Scholar]
- Astakhova L., Firsov M., and Govardovskii V.. 2015. Activation and quenching of the phototransduction cascade in retinal cones as inferred from electrophysiology and mathematical modeling. Mol. Vis. 21:244–263. [PMC free article] [PubMed] [Google Scholar]
- Baylor D.A., Lamb T.D., and Yau K.-W.. 1979a The membrane current of single rod outer segments. J. Physiol. 288:589–611. [PMC free article] [PubMed] [Google Scholar]
- Baylor D.A., Lamb T.D., and Yau K.-W.. 1979b Responses of retinal rods to single photons. J. Physiol. 288:613–634. [PMC free article] [PubMed] [Google Scholar]
- Baylor D.A., Matthews G., and Yau K.-W.K.-W.. 1980. Two components of electrical dark noise in toad retinal rod outer segments. J. Physiol. 309:591–621. 10.1113/jphysiol.1980.sp013529 [DOI] [PMC free article] [PubMed] [Google Scholar]
- Berntson A., Smith R.G., and Taylor W.R.. 2004. Transmission of single photon signals through a binary synapse in the mammalian retina. Vis. Neurosci. 21:693–702. 10.1017/S0952523804215048 [DOI] [PubMed] [Google Scholar]
- Chichilnisky E.J., and Rieke F.. 2005. Detection sensitivity and temporal resolution of visual signals near absolute threshold in the salamander retina. J. Neurosci. 25:318–330. 10.1523/JNEUROSCI.2339-04.2005 [DOI] [PMC free article] [PubMed] [Google Scholar]
- Cohen A.I., and Blazynski C.. 1990. Dopamine and its agonists reduce a light-sensitive pool of cyclic AMP in mouse photoreceptors. Vis. Neurosci. 4:43–52. 10.1017/S0952523800002753 [DOI] [PubMed] [Google Scholar]
- Cohen A.I., Todd R.D., Harmon S., and O’Malley K.L.. 1992. Photoreceptors of mouse retinas possess D4 receptors coupled to adenylate cyclase. Proc. Natl. Acad. Sci. USA. 89:12093–12097. 10.1073/pnas.89.24.12093 [DOI] [PMC free article] [PubMed] [Google Scholar]
- Donner K., Firsov M.L., and Govardovskii V.I.. 1990. The frequency of isomerization-like ‘dark’ events in rhodopsin and porphyropsin rods of the bull-frog retina. J. Physiol. 428:673–692. 10.1113/jphysiol.1990.sp018234 [DOI] [PMC free article] [PubMed] [Google Scholar]
- Field G.D., and Rieke F.. 2002. Nonlinear signal transfer from mouse rods to bipolar cells and implications for visual sensitivity. Neuron. 34:773–785. 10.1016/S0896-6273(02)00700-6 [DOI] [PubMed] [Google Scholar]
- Field G.D., Sampath A.P., and Rieke F.. 2005. Retinal processing near absolute threshold: from behavior to mechanism. Annu. Rev. Physiol. 67:491–514. 10.1146/annurev.physiol.67.031103.151256 [DOI] [PubMed] [Google Scholar]
- Fukuhara C., Liu C., Ivanova T.N., Chan G.C., Storm D.R., Iuvone P.M., and Tosini G.. 2004. Gating of the cAMP signaling cascade and melatonin synthesis by the circadian clock in mammalian retina. J. Neurosci. 24:1803–1811. 10.1523/JNEUROSCI.4988-03.2004 [DOI] [PMC free article] [PubMed] [Google Scholar]
- Hecht S., Shlaer S., and Pirenne M.H.. 1942. Energy, quanta, and vision. J. Gen. Physiol. 25:819–840. 10.1085/jgp.25.6.819 [DOI] [PMC free article] [PubMed] [Google Scholar]
- Ivanova T.N., and Iuvone P.M.. 2003. Circadian rhythm and photic control of cAMP level in chick retinal cell cultures: a mechanism for coupling the circadian oscillator to the melatonin-synthesizing enzyme, arylalkylamine N-acetyltransferase, in photoreceptor cells. Brain Res. 991:96–103. 10.1016/j.brainres.2003.08.003 [DOI] [PubMed] [Google Scholar]
- Lamb T.D., and Kraft T.W.. 2016. Quantitative modeling of the molecular steps underlying shut-off of rhodopsin activity in rod phototransduction. Mol. Vis. 22:674–696. [PMC free article] [PubMed] [Google Scholar]
- Leskov I.B., Klenchin V.A., Handy J.W., Whitlock G.G., Govardovskii V.I., Bownds M.D., Lamb T.D., Pugh E.N. Jr., and Arshavsky V.Y.. 2000. The gain of rod phototransduction: reconciliation of biochemical and electrophysiological measurements. Neuron. 27:525–537. 10.1016/S0896-6273(00)00063-5 [DOI] [PubMed] [Google Scholar]
- Li P., Chaurasia S.S., Gao Y., Carr A.L., Iuvone P.M., and Li L.. 2008. CLOCK is required for maintaining the circadian rhythms of Opsin mRNA expression in photoreceptor cells. J. Biol. Chem. 283:31673–31678. 10.1074/jbc.M803875200 [DOI] [PMC free article] [PubMed] [Google Scholar]
- McMahon D.G., Iuvone P.M., and Tosini G.. 2014. Circadian organization of the mammalian retina: from gene regulation to physiology and diseases. Prog. Retin. Eye Res. 39:58–76. 10.1016/j.preteyeres.2013.12.001 [DOI] [PMC free article] [PubMed] [Google Scholar]
- Muradov H., Boyd K.K., and Artemyev N.O.. 2010. Rod phosphodiesterase-6 PDE6A and PDE6B subunits are enzymatically equivalent. J. Biol. Chem. 285:39828–39834. 10.1074/jbc.M110.170068 [DOI] [PMC free article] [PubMed] [Google Scholar]
- Nir I., Harrison J.M., Haque R., Low M.J., Grandy D.K., Rubinstein M., and Iuvone P.M.. 2002. Dysfunctional light-evoked regulation of cAMP in photoreceptors and abnormal retinal adaptation in mice lacking dopamine D4 receptors. J. Neurosci. 22:2063–2073. [DOI] [PMC free article] [PubMed] [Google Scholar]
- Okawa H., Pahlberg J., Rieke F., Birnbaumer L., and Sampath A.P.. 2010. Coordinated control of sensitivity by two splice variants of Gα(o) in retinal ON bipolar cells. J. Gen. Physiol. 136:443–454. 10.1085/jgp.201010477 [DOI] [PMC free article] [PubMed] [Google Scholar]
- Pahlberg J., and Sampath A.P.. 2011. Visual threshold is set by linear and nonlinear mechanisms in the retina that mitigate noise: how neural circuits in the retina improve the signal-to-noise ratio of the single-photon response. BioEssays. 33:438–447. 10.1002/bies.201100014 [DOI] [PMC free article] [PubMed] [Google Scholar]
- Patel S., Chapman K.L., Marston D., Hutson P.H., and Ragan C.I.. 2003. Pharmacological and functional characterisation of dopamine D4 receptors in the rat retina. Neuropharmacology. 44:1038–1046. 10.1016/S0028-3908(03)00112-6 [DOI] [PubMed] [Google Scholar]
- Popova E. 2014. Role of dopamine in distal retina. J. Comp. Physiol. A Neuroethol. Sens. Neural Behav. Physiol. 200:333–358. 10.1007/s00359-014-0906-2 [DOI] [PubMed] [Google Scholar]
- Reingruber J., Pahlberg J., Woodruff M.L., Sampath A.P., Fain G.L., and Holcman D.. 2013. Detection of single photons by toad and mouse rods. Proc. Natl. Acad. Sci. USA. 110:19378–19383. 10.1073/pnas.1314030110 [DOI] [PMC free article] [PubMed] [Google Scholar]
- Rieke F., and Baylor D.A.. 1996. Molecular origin of continuous dark noise in rod photoreceptors. Biophys. J. 71:2553–2572. 10.1016/S0006-3495(96)79448-1 [DOI] [PMC free article] [PubMed] [Google Scholar]
- Rieke F., and Baylor D.A.. 1998a Single-photon detection by rod cells of the retina. Rev. Mod. Phys. 70:1027–1036. 10.1103/RevModPhys.70.1027 [DOI] [Google Scholar]
- Rieke F., and Baylor D.A.. 1998b Origin of reproducibility in the responses of retinal rods to single photons. Biophys. J. 75:1836–1857. 10.1016/S0006-3495(98)77625-8 [DOI] [PMC free article] [PubMed] [Google Scholar]
- Sampath A.P., and Rieke F.. 2004. Selective transmission of single photon responses by saturation at the rod-to-rod bipolar synapse. Neuron. 41:431–443. 10.1016/S0896-6273(04)00005-4 [DOI] [PubMed] [Google Scholar]
- Traverso V., Bush R.A., Sieving P.A., and Deretic D.. 2002. Retinal cAMP levels during the progression of retinal degeneration in rhodopsin P23H and S334ter transgenic rats. Invest. Ophthalmol. Vis. Sci. 43:1655–1661. [PubMed] [Google Scholar]
- Trexler E.B., Casti A.R., and Zhang Y.. 2011. Nonlinearity and noise at the rod-rod bipolar cell synapse. Vis. Neurosci. 28:61–68. 10.1017/S0952523810000301 [DOI] [PMC free article] [PubMed] [Google Scholar]
- van Rossum M.C., and Smith R.G.. 1998. Noise removal at the rod synapse of mammalian retina. Vis. Neurosci. 15:809–821. 10.1017/S0952523898155037 [DOI] [PubMed] [Google Scholar]
- Walraven J., Enroth-Cugell C., Hood D.C., MacLeod D.I.A., and Schnapf J.L.. 1990. The control of visual sensitivity. In Visual Perception: The Neurophysiological Foundations. Spillmann L., and Werner S.J., editors. Academic Press, San Diego, CA: 53–101. 10.1016/B978-0-12-657675-7.50011-9 [DOI] [Google Scholar]
- Whitlock G.G., and Lamb T.D.. 1999. Variability in the time course of single photon responses from toad rods: termination of rhodopsin’s activity. Neuron. 23:337–351. 10.1016/S0896-6273(00)80784-9 [DOI] [PubMed] [Google Scholar]
- Wiechmann A.F., and Sherry D.M.. 2013. Role of melatonin and its receptors in the vertebrate retina. Int. Rev. Cell Mol. Biol. 300:211–242. 10.1016/B978-0-12-405210-9.00006-0 [DOI] [PubMed] [Google Scholar]
- Witkovsky P. 2004. Dopamine and retinal function. Doc. Ophthalmol. 108:17–39. 10.1023/B:DOOP.0000019487.88486.0a [DOI] [PubMed] [Google Scholar]


