

Abstract
The present study illustrates the optimization and characterization of β-glucosidase from a bacterial isolate, strain SG9. Sixty-eight different variables were first screened by one factor at a time method. The screened variable optimization was then performed by Plackett–Burman design followed by Box–Behnken response surface methodology. Thirty-one variables were screened, of which five variables were found to be significant. Box–Behnken design was then performed using the most significant variables, viz., esculin, K2HPO4 and MgSO4. The maximum enzyme activity was observed with an optimal medium composition of esculin (1.9 g/L), K2HPO4 (0. 5 g/L) and MgSO4 (0.3 g/L) with a predicted value of 3392.01 IU. The maximum β-glucosidase production achieved was 3340 IU. The bacterial strain was identified by 16S rRNA gene sequence and biochemical characterization. The strain was identified as Bacillus stratosphericus and is a first report of its kind.
Electronic supplementary material
The online version of this article (doi:10.1007/s13205-017-0866-7) contains supplementary material, which is available to authorized users.
Keywords: β-Glucosidase, Optimization, Bacillus stratosphericus, Plackett–Burman design, Box–Behnken design
Introduction
β-Glucosidases are industrially important enzymes and are useful in various biotechnological processes (Veena et al. 2011). The ubiquitous nature of β-glucosidase in the entire living kingdom is due to their occurrence in diverse bacteria, plants, yeast, fungi and animals. It is primarily a component of cellulase enzyme system in bacteria and fungi that results in cellobiose and short chain oligosaccharides which on hydrolysis produces glucose, a rate-limiting step. As the chain length of glucose increases, the enzyme activity reduces (Bhatia et al. 2002). β-Glucosidase activity in yeast, for example, Debaryomyces hansenii is responsible for producing different flavouring compounds such as terpenols, phenylethyl and benzyl alcohols (Bhatia et al. 2002). In insects, this enzyme is involved in the defence mechanism by facilitating the release of cyanides from cyano-glucoside precursors (Bhatia et al. 2002). β-Glucosidase in humans has therapeutic importance in Gaucher’s disease. Patients with this disorder are given intravenous injection of the purified enzyme sourced from human placenta. This is because the β-glucosidase deficient cells are incapable of glycosylceramides hydrolyzation; accumulation in the reticuloendothelial cells lysosomes is responsible for enlargement of spleen, lymph nodes and liver (Bhatia et al. 2002).
Diverse plant species like sorghum, rice and maize have been reported to exhibit β-glucosidase activity (Verdoucq et al. 2003). The utilization of this enzyme is found mostly in conversion of cellulose. In addition, this enzyme is involved in a wide range of applications; phytohormone activation, seed development and plants pathogen defence, bitter compounds hydrolysis during juice extraction and aroma release from wine grapes, oncogenesis and cellular signaling and even in detergent, pharmaceutical and cosmetic industries (Bai et al. 2013). β-Glucosidase can be utilized as markers for enzyme specificity evolution studies and metabolism of carbohydrates. This enzyme is also responsible for aromatic compounds release from fruits as well as printing ink deinking from waste paper (Dhake and Patil 2005). Moreover, bioconversion of Panax ginseng major ginsenoside Rb1 to minor ginsenosides possessing therapeutic importance was exhibited by ginseng field soil microbes producing β-glucosidase (Veena et al. 2011). β-Glucosidase also exhibited transglucosidase property because they may be involved in glucoconjugate synthesis in plants. Each plant was found to possess several putative isozymes of this enzyme after the revelation of genomic sequence (Ketudat et al. 2015).
β-Glucosidase activity containing bacteria are significant for improved absorption and higher estrogenecity as microflora of intestine produces aglycones from glucoside isoflavones hydrolysis, thus, leading to their hydrolysis (Hu et al. 2007). This enzyme is found in a wide range of bacteria, for instance, Penicillium purpurogenum (Dhake and Patil 2005), Ceriporiopsis subvermispora (Magalhaes et al. 2006), Flavobacterium johnsonae (Okamota et al. 2000), Trichoderma harzianum type C-4 (Yun et al. 2001), Lactobacillus plantarum (Spano et al. 2005) and Dyella koreensis spp. (An et al. 2005). The enzyme is also involved in phenolic anti-oxidants bioconversion obtained from soybean powder and soymilk fermentation, since it enhances isoflavone aglycone levels (Otieno and Shah 2007). β-Glucosidases in bacteria are detected by chromogenic substrates since a century, most commonly of which is esculin, a natural glucoside. Quinoline-β-d-glucoside was found to be equivalent to esculin for Gram-negative bacteria detection. Apart from these alizarin-β-d-glucoside, 3,4-dihydroxyflavone-β-d-glucoside, 3′,4′-dihydroxyflavone-β-d-glucoside, 3′,4′-dihydroxyflavone-β-d-glucoside and ginsenosides are also utilized for this enzyme assay (Veena et al. 2011).
The present study was carried out to screen β-glucosidase producing bacteria isolated from different ecological niches of India and maintained in the in-house culture repository of the institute. Bacillus stratosphericus strain SG9 was identified as a potential β-glucosidase producer and the cultural conditions and the nutritional requirements for this strain have been optimized using Plackett–Burman design followed by Box–Behnken response surface methodology.
Materials and methods
Chemicals
The chemicals were procured from Sigma Chemicals, USA, Sisco Research Laboratories (SRL), Mumbai, India and Himedia Laboratories, Mumbai, India unless otherwise stated. The chemicals used were of analytical grade and were used as such without any further purification.
Screening microbes with β-glucosidase activity
The primary screening of the 3400 bacterial strains available in the in-house culture repository was carried out on plate screening method. The microorganisms were cultured on nutrient agar plates supplemented with esculin (0.5 g/L) and ferric ammonium citrate (0.2 g/L). The plates were incubated at 37 °C for about 24 h and the colonies forming brown or black coloration around them were considered as esculin hydrolyzing bacteria.
Organism identification
The promising strain short-listed based on enzyme activity was subjected to identification by genomic DNA isolation followed by 16S rRNA gene sequencing. The microbial culture was grown for 24 h and then centrifuged at 12,000×g for 2 min, after which the culture pellet was collected for genomic DNA isolation using Bacterial Genomic DNA isolation kit (Sigma Aldrich, USA). 16S rRNA gene was amplified from chromosomal DNA using universal primer set 1492R (5′ TACGGYTACCTTGTTACGACTT 3′) and 27F (5′ AGAGTTTGATCMTGGCTCAG 3′), after which the PCR products were sequenced by Eurofins Genomics India Pvt. Ltd (Bengaluru, India). The gene sequences were then compiled using Chromas (Technelysium Pty Ltd, Australia). The 16S rDNA sequence of strain SG9 was submitted to GenBank bearing accession number KY078548. The sequence homology was analyzed by BLAST program offered by NCBI (http://www.ncbi.nlm.nih.gov/). Construction of phylogenetic tree was done by neighbor-joining method (Saitou and Nei 1987) using MEGA6 program (Tamura et al. 2013) along with bootstrap analysis based on 1000 replications.
Morphological and biochemical characteristics
The promising isolate was subjected to various morphological, biochemical and physiological characteristic studies using the methods listed in Bergey’s Manual of Determinative Bacteriology (Holt et al. 1994). The morphological studies were carried out using on the Olympus BX51 fluorescent microscope with an oil immersion objective (100×). The sensitivity of the strain was tested on different antibiotics using antibiotics discs (Himedia, India).
Selection of appropriate nutrient solution for growth
The growth of the bacterial strains was tested in five different media, viz., Luria–Bertani medium, Nutrient broth, tryptophan soya broth (TSB), de Mann, Rogosa and Sharpe (MRS) medium and 2XYT (1% yeast extract, 1.6% peptone and 0.5% NaCl). These media were tested at both half and full concentrations with and without addition of esculin (0.1%) substrate. Samples were collected at regular intervals of 12 h for 72 h and centrifuged at 6000 rpm for 15 min. The supernatants were assayed for enzyme activity. The media without organism inoculation served as blanks. The above experiments with all the different media were repeated thrice.
Secondary screening of the enzyme
The positive strains obtained from the primary screening were then subjected to secondary screening in TSB. The media were supplemented with esculin (0.1%) as substrate. The samples were collected at regular interval of 12 h for 72 h. The supernatant was examined for enzyme activity and the microorganism showing promising activity was selected for further studies.
β-Glucosidase assay
The assay for evaluating the enzymatic activity of β-glucosidase was carried out using the following method: 0.4 ml of 50 mM citrate buffer (pH 4.5) was added to 0.5 ml of 5 mM p-nitrophenyl pyranoglucoside (pNPG) and incubated at 50 °C for 10 min. 0.1 ml of the enzyme solution was then added to it and incubated at 50 °C for 30 min. 1 ml of 1 M Na2CO3 was then added to stop the reaction. The contents were cooled at room temperature after which the color developed was measured at 400 nm on a UV–Visible spectrophotometer (Lambda 35, Perkin-Elmer). One unit of β-glucosidase is the amount of enzyme required to liberate 1 µmol of p-nitrophenol per min under the assay conditions (Ghose and Bisaria 1987). The standard curve was prepared using para-nitrophenol (PNP) at a concentration of 1 mM.
Appropriate medium for enzyme production
The medium used for the optimal enzyme production had the following composition (g/L): dextrose 2.5, yeast extract 2.5, peptone 7.5, (NH4)2SO4 1.5, KH2PO4 2, K2HPO4 2, MgSO4·7H2O 0.3, CaCl2 0.3, FeSO4·7H2O 0.01, and KCl 0.05. The optimization studies were carried out using this medium by varying the respective components.
Measurement of enzyme production as a function of time
The optimal enzyme production time with respect to cell growth was measured by recording the cell growth absorbance at 600 nm and calculating the corresponding enzyme activity at various time intervals.
Optimization studies
Effect of temperature and pH
Effect of temperature on β-glucosidase production and cell growth was attained by maintaining the culture medium at various temperatures of 25, 37, 40, 45, 50, 55 and 60 °C. The effect of pH on β-glucosidase production and cell growth was performed by incubating at various pH ranges (pH 1–10) using different buffers. The pH 1–6 was adjusted with 1 N HCl and pH 7–10 with 1 M NaOH. The experiments were carried out in triplicates.
Effect of nutritional parameters
Different carbon sources (concentration of 2.5 g/L) such as dextrose, lactose, fructose, sucrose, cellulose, mannitol and mannose were examined for their effect on enzyme production and cell growth. The effect of nitrogen sources (concentration of 2.5 g/L) on the enzyme production was studied by evaluating a diverse range of nitrogen sources, viz., yeast extract, peptone, urea (NH4)2SO4, NaNO3, KNO3, NH4NO3, soymeal extract, beef extract and skim milk. Various phosphate sources (concentration of 2 g/L) such as K2HPO4, KH2PO4, Na2HPO4 and NaH2PO4 were used to examine their effect on enzyme production and cell growth. The effect of metal ions on the enzyme production and cell growth was done by utilizing wide range of metal ions such as CaCl2, MgSO4, FeSO4, MnSO4, ZnSO4, CuSO4, mercuric chloride, KCl, EDTA and barium chloride. The metal ions were used at a concentration of 0.264 g/L. All the surfactants (concentration of 2 g/L) such as polyethylene glycol (PEG) 20,000, Triton X‐100, Tween 20, Tween 40, Tween 60, Tween 80 and sodium dodecyl sulfate (SDS) were examined for their effect on enzyme production. The effect of different substrates (concentration of 1 g/L) such as salicin, carboxy methyl cellulose (CMC), gentiobiose, esculin and cellobiose was examined on enzyme production. The effect of esculin concentration was also examined on enzyme production and cell growth. The different substrate concentrations studied were 0.05, 0.1, 0.15, 0.2, 0.3, 0.5, 1.0 and 1.5%. All the optimization experiments were carried out in triplicates.
Independent variables screening with Plackett–Burman Design
An array of medium components was selected from high to low concentrations to perform the Plackett–Burman (PB) (Plackett and Burman 1946) experimental design using Design-Expert version 10 software (State-Ease Inc., USA). The experimental design was adopted to screen the variables that considerably influenced β-glucosidase production. The design is based on the process that screens ‘N’ variables by conducting ‘N + 1’ experiments. Thirty-one independent variables listed in Table 1 were taken into consideration for screening in 36 runs that included 4 central points. Each variable was taken in three levels, low level (−1), median level (0) and high level (+1). The median level was taken for the central point experiments. The experiments were done in duplicates and the average was considered as the response. The PB experimental design is based on the first-order model:
| 1 |
where Y is the response variable (β-glucosidase activity), β 0 is the model intercept, β i is the linear coefficient and X i is the level of the independent variable.
Table 1.
Independent variables for screening using Plackett–Burman design
| Nutrient code | Components (g/L) | Levels | ||
|---|---|---|---|---|
| Low level (−) | Level 0 | High level (+) | ||
| X 1 | Dextrose | 1.5 | 2.5 | 3.5 |
| X 2 | Lactose | 1.5 | 2.5 | 3.5 |
| X 3 | Fructose | 1.5 | 2.5 | 3.5 |
| X 4 | Sucrose | 1.5 | 2.5 | 3.5 |
| X 5 | Mannitol | 1.5 | 2.5 | 3.5 |
| X 6 | Mannose | 1.5 | 2.5 | 3.5 |
| X 7 | Temperature | 25 °C | 35 °C | 45 °C |
| X 8 | Yeast extract | 1.5 | 2.5 | 3.5 |
| X 9 | Peptone | 6.5 | 7.5 | 8.5 |
| X 10 | Urea | 1.5 | 2.5 | 3.5 |
| X 11 | (NH4)2SO4 | 0.5 | 1.5 | 2.5 |
| X 12 | NaNO3 | 0.5 | 1.5 | 2.5 |
| X 13 | KNO3 | 0.5 | 1.5 | 2.5 |
| X 14 | Beef extract | 0.5 | 1.5 | 2.5 |
| X 15 | NH4NO3 | 0.5 | 1.5 | 2.5 |
| X 16 | K2HPO4 | 1 | 2 | 3 |
| X 17 | KH2PO4 | 1 | 2 | 3 |
| X 18 | Na2HPO4 | 1 | 2 | 3 |
| X 19 | NaH2PO4 | 1 | 2 | 3 |
| X 20 | Esculin | 0. 5 | 1 | 1.5 |
| X 21 | CaCl2 | 0.15 | 0.3 | 1.5 |
| X 22 | MnSO4 | 0.005 | 0.01 | 0.02 |
| X 23 | FeSO4 | 0.005 | 0.01 | 0.02 |
| X 24 | MgSO4 | 0.15 | 0.3 | 1.5 |
| X 25 | ZnSO4 | 0.005 | 0.01 | 0.02 |
| X 26 | CuSO4 | 0.005 | 0.01 | 0.02 |
| X 27 | KCl | 0.025 | 0.05 | 0.075 |
| X 28 | EDTA | 0.005 | 0.01 | 0.02 |
| X 29 | SDS (%) | 0.1 | 0.2 | 0.3 |
| X 30 | PEG (%) | 0.1 | 0.2 | 0.3 |
| X 31 | pH | 3.5 | 4.5 | 5.5 |
The experiment was further analyzed by ANOVA on the basis of enzyme activity. Variables showing significance (P < 0.1) as a result of regression analysis were further thought to have greater influence on enzyme activity and, thereby, considered for optimization by Box–Behnken design.
Optimization by Box–Behnken Design (BBD)
The significant variables identified after Plackett–Burman design were further optimized using Box–Behnken response surface design (Box and Behnken 1960). These design techniques based on statistical experiments lead to the optimal yield. BBD is a rotatable, independent quadratic design having the absence of fractional factorial or embedded factorial points, with the combination of variables at the centre and at midpoints of edges of the variable space (Shanmugaprakash et al. 2014). It is helpful in setting up second-order surface models since it standardizes concentration at only three levels, viz, −1, 0, and +1. The experiments were performed in duplicates with the average being considered as the response. The polynomial equation for this model is
| 2 |
where Y is the predicted response, β 0 is the regression coefficients, βi is the linear coefficient, βii is the quadratic coefficients, βij is the interaction coefficients and Xi is the coded levels of independent variables.
In the present study, the independent variables are coded as X 1, X 2 and X 3 till X 31 for which the second-order polynomial equation is
| 3 |
Results and discussion
Screening of microbes with β-glucosidase activity and media selection
A total of 3400 bacterial cultures were subjected to primary screening of the β-glucosidase enzyme. A total of 664 cultures were found to show less than 20 mm diameter area (double positives) and 77 bacterial cultures showed 20–30 mm diameter area (triple positives) on nutrient agar plates supplemented with esculin (Supplementary Fig. S1 and Table S1). The triple positive bacterial strains were further subjected to secondary screening based on enzyme activity estimation. Based on the results obtained, a strain designated as SG9 was selected for further studies. TSB medium supplemented with esculin proved to a good medium for optimization studies since it supported good growth and enzyme activity after 24 h. The enzyme activity as a function of time indicated that the maximum enzymatic activity (3001.4 IU) was observed after 24 h with an optical density of 1.202, with the onset of stationary growth phase followed by gradual reduction in the enzyme activity (Fig. 1). These results corroborate with the earlier study (Sepahy and Jabalameli 2011). However, the enzyme activity decreased after 24 h which may be due to the fact that the depletion of nutrients and by-products formation takes place during the stationary phase of growth (Parry et al. 2001).
Fig. 1.

Growth kinetics profile of strain SG9 with reference to enzymatic activity
Phylogenetic analysis
A 16S rRNA gene sequence (1498 bp) of the strain SG9 was used for homology analysis by BLAST. The traditional (Fig. 2) view of the phylogenetic tree has been presented. The 16S rRNA-based phylogenetic analysis of the strain SG9 indicates that it belongs to the genus Bacillus and is closely related by 99% to Bacillus stratosphericus strain A7 (Accession no. KX262677) and Bacillus stratosphericus strain IHB B 6832 (Accession no. KF668462) and 96% to Bacillus altitudinis strain IHB B 1045 (Accession no. KF475828). Moreover, its a universal accord that a 70% relatedness level of DNA–DNA is considered for defining species (Wayne et al. 1987). The phylogenetic properties of the strain SG9 are consistent with that of the genus Bacillus along with relative gene sequence similarities with 99% homology with different strains of Bacillus stratosphericus and, hence, the name Bacillus stratosphericus strain SG9 was proposed. The comparative details on the polyphasic assessment of the strain SG9 with other three type strains such as Bacillus xiamenensis MCCC 1A00008 (Lai et al. 2014), Bacillus aerophilus strain 28 K and Bacillus stratosphericus MTCC 7305 (Shivaji et al. 2006) were based on the literature data which have been included in the Supplementary Table S2.
Fig. 2.

Phylogenetic tree based on 16S rRNA gene sequences of strain SG9 with different species of genus Bacillus. Bootstrap analysis was performed with 1000 replications. The bar scale shows 5 nucleotide exchanges per 100 nucleotide
Optimization studies
One factor at a time method
Effect of carbon source
Different carbon sources such as dextrose, lactose, fructose, sucrose, cellulose, mannitol and mannose were evaluated for their effect on cell growth and enzyme production. The highest enzyme activity (2929.16 IU) was observed after 24 h of growth with mannitol (2.5 g/L) as the carbon source, followed by dextrose (2775 IU) and lactose (2150 IU). The data in this regard are shown in Fig. 3a. Further, mannitol was observed to be an optimal carbon source for bacterial cellulose production (Ramana et al. 2000; Yodsuwan et al. 2012) and cellulose production (Jonas and Farah 1998; Panesar et al. 2009).
Fig. 3.
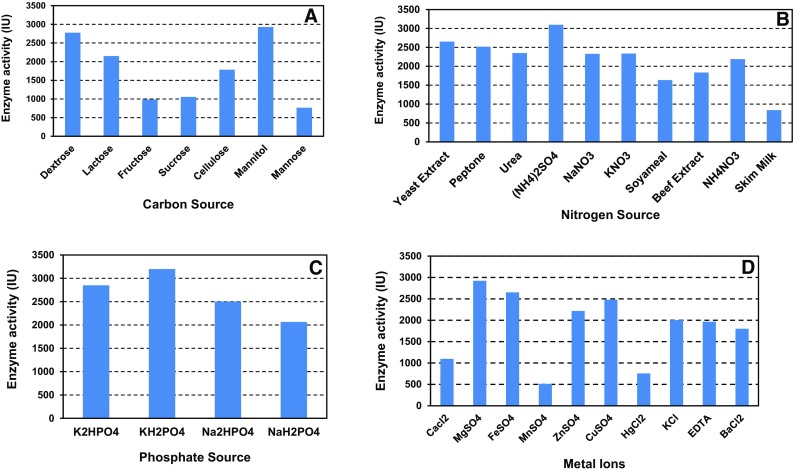
Optimization studies of a carbon sources, b nitrogen sources, c phosphate sources and d metal ions showing effect on enzyme production
Effect of nitrogen source
The effect of various nitrogen sources (both organic and inorganic nitrogen sources) examined at a concentration of 1.5 g/L showed that (NH4)2SO4 supported maximum enzyme activity of 3097.2 IU, followed by yeast extract (2651.5 IU) and peptone (2518.0 IU). The data in this regard are shown in Fig. 3b. These results corroborate with the earlier studies on Bacillus species (Samiullah et al. 2009) and Ccllulomonas sp. (Rodriguez et al. 1996). Other studies also support that ammonium sulfate supplementation favored maximum cellulase production by Ruminococcus albus strain SY3 (Wood et al. 1982), Bacillus pumilus strain BPCRI6 (Kotchoni et al. 2003), Bacillus subtilis strain BL62 (Heck et al. 2002) and Streptomyces sp. strain BRC2 (Chellapandi and Himanshu 2008).
Effect of phosphate source
Different phosphate salts were evaluated for their effect on enzyme activity at a concentration of 2 g/L. The maximum enzyme activity (3198.6 IU) was observed with K2HPO4, followed by KH2PO4 (2850 IU) and Na2HPO4 (2501.4 IU) (Fig. 3c). These results are in agreement with earlier studies on β glucosidase production by Aspergillus terreus (El-Naggar et al. 2015), lipase production from R. oligosporus (Ali et al. 2012) and uricase production (Atalla et al. 2009).
Effect of metal ions source
An array of metal ions such as CaCl2, MgSO4, FeSO4, MnSO4, ZnSO4, CuSO4, HgCl2, KCl and BaCl2 was added individually in the basal medium at a concentration of 0.02%. The maximum enzyme activity was observed with MgSO4 (2922.2 IU) followed by FeSO4 (2651.4 IU) and CuSO4 (2179.2 IU) (Fig. 3d). These results were supported by the earlier studies on cellulase production by B. altitudinis (Sreeja et al. 2013), lipase production by P. pseudoalcaligenes F-111 (Lin et al. 1995) and P. pseudoalcaligenes KKA-5 (Sharon et al. 1998).
Effect of surfactants
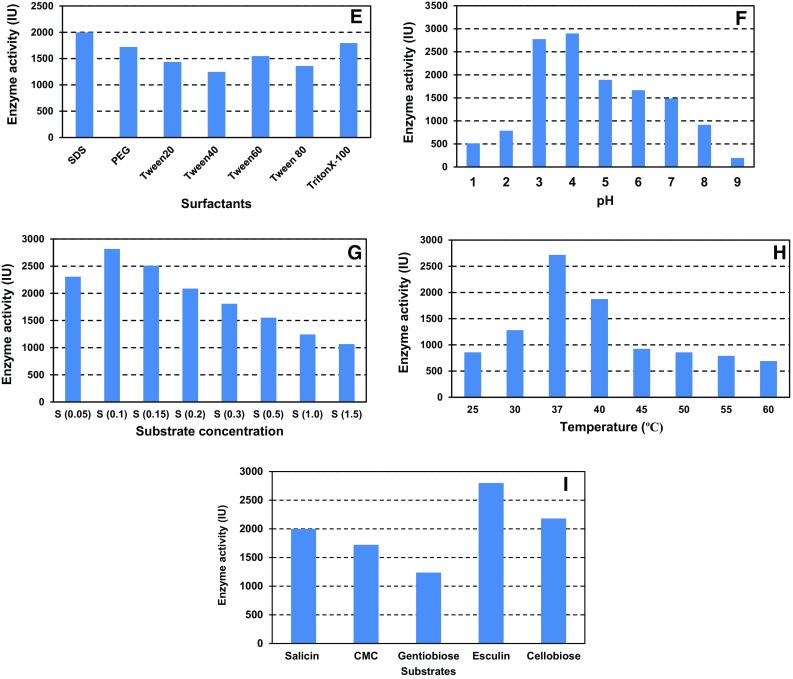
Different surfactants at a concentration of 2 g/L were examined for their effect on cell growth and enzyme production. SDS showed maximum enzymatic activity (1998.61 IU), whereas Tween 40 (546.23 IU) showed the least effect. The remaining surfactants showed considerable activity, viz., Triton X-100 (945.06 IU), PEG (1722.22 IU), Tween 60 (1001.12 IU), Tween 20 (836.11 IU) and Tween 80 (759.01 IU) (Fig. 4e). Hence, some of the surfactants supported partial inhibitory effect. The reason may be due to the solubilization of proteins present in the membrane which causes an increase in the membrane permeability, thus enhancing the secretion of biomolecules (Rao and Satyanarayana 2003). These results support the earlier studies for protease production from marine Sacccharopolyspora species (Raut et al. 2013), amylase from Bacillus tequilensis RG-01 (Tiwari et al. 2014) and extracellular phytase by Pseudomonas aeruginosa p6 (Sasirekha et al. 2012).
Fig. 4.
Optimization studies of e surfactants, f substrates, g substrate concentration, h temperature and i pH showing effect on enzyme production
Effect of substrates
Five different types of substrates were examined for their effect on the enzyme production and cell growth. Esculin (2799.72 IU) showed promising enzyme activity among them. Cellobiose gave considerable activity (2180.56 IU), whereas salicin (1998.61 IU) and CMC (1722.22 IU) gave moderate activity. Therefore, esculin was selected as a substrate for further studies (Fig. 4f). The present study was supported by the earlier observation (Wright et al. 1992).
Effect of substrate concentration
Esculin was tested at different concentrations to study its effect on cell growth and enzyme production. The maximum enzyme activity was observed at 0.1% (2817.4 IU) followed by 0.15% (2508.7 IU) and 0.05% (2305.8 IU) (Fig. 4g).
Effect of temperature and pH
The enzyme production along with cell growth was tested at different temperatures in the range of 25 to 60 °C with an interval of 5 °C. Optimal enzyme activity (2717.4 IU) was observed at 37 °C for 24 h which corroborates with the results of Samiullah et al. (2009) for Bacillus sp. (Fig. 4h). The influence of various pH (pH 1–10) was examined by adjusting the pH with NaOH and HCl. The optimal enzyme activity was observed at pH 4 (2898.6 IU) followed by pH 3 (2775 IU). Acidic pH was observed to support good cell growth and enzyme activity and, hence, was selected for further studies (Fig. 4i). Singh and Kumar (1998) earlier reported an optimum pH of 5.5 for cellulase production from Bacillus brevis.
Plackett–Burman design
The prime objective for performing the design of experiments is to maximize the enzyme yield by optimization of the production condition. The conventional optimization method is unable to scrutinize all the possible combination of independent variables at a time. Sixty-eight different variables were screened individually using one factor at a time method and 31 medium components were selected for the experiments which included 36 runs in total including 4 central points. The results (Supplementary Tables S3 and S4) displayed broad range of the β-glucosidase activity. The maximum enzyme activity observed was 3397.2 IU and the minimum activity observed was 1086.1 IU.
The results showed that esculin, K2HPO4, Na2HPO4, MgSO4 and mannitol were the most significant nutrient components that influenced β-glucosidase activity. The order of significance as displayed in the Pareto chart showed the effect of different variables (Fig. 5). Among the 31 variables studied in the model, the highest effect was exhibited by esculin with the t value effect of 86.36, whereas the least was shown by PEG with a t value effect less than the t value limit (3.18).
Fig. 5.

Pareto chart illustrating the order of significance of different 31 variables showing β-glucosidase production by strain SG9
The statistical analysis of Plackett–Burman design is shown in Table 2. The determination coefficient showed that a value (R 2 = 0.9872) indicating 98.72% of the discrepancy in the response was because of the independent variables used and only 1.28% of the total variability could not be described by independent variables. Moreover, the high value of adjusted determination coefficient (Adj R 2 = 0.8885) showed that the model is of high significance. The model F value of 10.00 implies that the model is significant. There is only a 1.83% chance that an F value this large could occur due to noise. Values of “Probability > F” less than 0.0500 indicated that the model terms were significant. The value of significance p was 0.0183 for the present model. In the experiment, the different substrates (mannitol, yeast extract, ammonium sulfate, K2HPO4, Na2HPO4, esculin, FeSO4 and MgSO4) which exhibited p values <0.05 were considered the most significant factors affecting the β-glucosidase production. Based on these results, esculin, K2HPO4 and MgSO4 were selected for further Box–Behnken statistical design.
Table 2.
Statistical analysis of Plackett–Burman design showing coefficient values, f value and p values for each variable affecting enzyme activity
| Variables | Coefficients | Sum of squares | df | Mean square |
p value Prob > F |
f value | Remarks |
|---|---|---|---|---|---|---|---|
| Model | 2296.69 | 23,033,689 | 31 | 743,022.23 | 0.018 | 10.002 | Significant |
| Dextrose | −68.31 | 149,349.6 | 1 | 149,349.63 | 0.229 | 2.01 | |
| Lactose | −56.77 | 103,134.5 | 1 | 103,134.45 | 0.303 | 1.38 | |
| Fructose | −7.37 | 1741.90 | 1 | 1741.90 | 0.885 | 0.02 | |
| Sucrose | 14.58 | 6805.55 | 1 | 6805.55 | 0.777 | 0.09 | |
| Mannitol | −140.36 | 630,467.2 | 1 | 630,467.20 | 0.043 | 8.48 | |
| Mannose | 25.78 | 21,268.84 | 1 | 21,268.83 | 0.620 | 0.28 | |
| Temperature | 93.66 | 280,733.6 | 1 | 280,733.59 | 0.123 | 3.77 | |
| Yeast extract | −145.13 | 674,092.1 | 1 | 674,092.11 | 0.039 | 9.07 | |
| Peptone | 50.08 | 80,280.9 | 1 | 80,280.90 | 0.357 | 1.08 | |
| Urea | −25.78 | 21,270.33 | 1 | 21,270.32 | 0.620 | 0.28 | |
| (NH4)2SO4 | −145.83 | 680,558.1 | 1 | 680,558.11 | 0.038 | 9.16 | |
| NaNO3 | 90.97 | 264,825.4 | 1 | 264,825.41 | 0.132 | 3.563 | |
| KNO3 | 34.02 | 37,052.31 | 1 | 37,052.31 | 0.518 | 0.49 | |
| Beef extract | −70.57 | 159,377.2 | 1 | 159,377.18 | 0.216 | 2.14 | |
| (NH4)2NO3 | 21.96 | 15,435.53 | 1 | 15,435.53 | 0.672 | 0.21 | |
| K2HPO4 | −157.55 | 794,327.2 | 1 | 794,327.22 | 0.030 | 10.69 | |
| KH2PO4 | 88.10 | 248,411.4 | 1 | 248,411.44 | 0.141 | 3.34 | |
| Na2HPO4 | −164.32 | 864,065.4 | 1 | 864,065.36 | 0.027 | 11.63 | |
| NaH2PO4 | 20.31 | 13,204.12 | 1 | 13,204.12 | 0.694 | 0.17 | |
| Esculin | 694.44 | 15,432,077 | 1 | 15,432,077.01 | 0.00,013 | 207.74 | |
| CaCl2 | −17.79 | 10,132.95 | 1 | 10,132.95 | 0.730 | 0.13 | |
| MnSO4 | 43.48 | 60,521.08 | 1 | 60,521.08 | 0.417 | 0.81 | |
| FeSO4 | 162.15 | 841,392 | 1 | 841,391.99 | 0.035 | 11.32 | |
| MgSO4 | −150.08 | 720,838.9 | 1 | 720,838.87 | 0.028 | 9.70 | |
| ZnSO4 | 73.61 | 173,393.4 | 1 | 173,393.44 | 0.201 | 2.33 | |
| CuSO4 | 111.11 | 395,059.7 | 1 | 395,059.72 | 0.082 | 5.31 | |
| KCl | 18.66 | 11,145.42 | 1 | 11,145.41 | 0.718 | 0.15 | |
| EDTA | 2.43 | 188.9789 | 1 | 188.97 | 0.962 | 0.002 | |
| SDS | −98.78 | 312,274.3 | 1 | 312,274.29 | 0.109 | 4.20 | |
| PEG | −1.21 | 47.22,813 | 1 | 47.23 | 0.981 | 0.0006 | |
| pH | −30.72 | 30,217.02 | 1 | 30,217.02 | 0.558 | 0.41 | |
| Residual | 297,135.2 | 4 | 74,283.78 | ||||
| Lack of Fit | 294,240.7 | 1 | 294,240.67 | 0.0004 | 304.961 | Significant | |
| Pure Error | 2894.47 | 3 | 964.82 | ||||
| Cor Total | 23,330,824 | 35 |
Experiments are performed at 95% LOS (level of significance). R squared 0.9872; adjusted R squared 0.8885. F value 10.0; significance F (p value) 0.0183
df degree of freedom
The “Lack of Fit F-value” of 304.97 implies that the Lack of Fit was significant. There is only a 0.04% chance that a “Lack of Fit F-value” this large could occur due to noise. A negative “Pred R-Squared” (−115.241148) implies that the overall mean may be a better predictor of your response than the current model. “Adeq Precision” measures the signal to noise ratio. A ratio greater than 4 is desirable and, therefore, the ratio value of 8.994 obtained indicates an adequate signal. As a result, the present model can be used to navigate the design space.
The first-order polynomial was obtained that showed the enzyme production as a function of independent variables:
R (β-glucosidase activity) = 2328.66 − 68.32 (X 1) − 56.77 (X 2) − 7.38 (X 3) + 14.58 (X 4) − 140.36 (X 5) + 25.78 (X 6) + 93.66 (X 7) − 145.14 (X 8) + 50.09 (X 9) − 25.78 (X 10) − 145.83 (X 11) + 90.97 (X 12) + 34.03 (X 13) − 70.57 (X 14) + 21.96 (X 15) − 157.55 (X 16) + 88.11(X 17) − 164.32 (X 18) + 20.31 (X 19) + 694.44 (X 20) − 17.79 (X 21) + 43.49 (X 22) + 162.15 (X 23) − 150.09 (X 24) + 73.61 (X 25) + 111.11 (X 26) + 18.66 (X 27) + 2.43 (X 28) − 98.79 (X 29) − 1.21 (X 30) − 30.73 (X 31).
Box–Behnken design for β-glucosidase production
Box–Behnken response surface design was performed using three factors which were examined based on the results obtained from Plackett–Burman design, viz., esculin, KH2PO4 and MgSO4 to maximize the enzyme activity. All the independent variables chosen were tested at three different levels (−1, 0, 1) (Supplementary Table S5). Overall, 17 experimental runs were performed with 5 central points (runs 4, 7, 9, 16 and 17). The parameters utilized in the test were taken at high and low on the basis of the Plackett–Burman design results. The minimum enzyme activity was 2545.83 IU observed in 5th run under the conditions of 0.1 g/L esculin, 2 g/L KH2PO4 and 0.1 g/L MgSO4. The maximum activity was observed in 11th run showing an enzyme activity of 3397.22 IU with the composition of 1.9 g/L esculin, 0.5 g/L K2HPO4 and 0.3 g/L MgSO4. The experimental value results and that predicted by the model have also been compared (Table 3). The comparison demonstrated minor differences between the experimental and the predicted results.
Table 3.
Results for Box–Behnken experimental design with their corresponding β-glucosidase activity (IU)
| STD | Esculin (A) | KH2PO4 (B) | MgSO4 (C) | β-glucosidase activity (IU) | Predicted value | Residual |
|---|---|---|---|---|---|---|
| 1 | −1 | −1 | 0 | 2615.27 | 2629.85 | −14.58 |
| 2 | 1 | −1 | 0 | 3397.22 | 3392.01 | 5.21 |
| 3 | −1 | 1 | 0 | 2602.77 | 2607.98 | −5.21 |
| 4 | 1 | 1 | 0 | 3244.44 | 3229.85 | 14.58 |
| 5 | −1 | 0 | −1 | 2545.83 | 2518.57 | 27.25 |
| 6 | 1 | 0 | −1 | 3265.27 | 3257.80 | 7.46 |
| 7 | −1 | 0 | 1 | 2573.61 | 2581.07 | −7.46 |
| 8 | 1 | 0 | 1 | 3198.61 | 3225.87 | −27.25 |
| 9 | 0 | −1 | −1 | 3138.88 | 3151.55 | −12.67 |
| 10 | 0 | 1 | −1 | 2715.27 | 2737.31 | −22.04 |
| 11 | 0 | −1 | 1 | 2866.66 | 2844.61 | 22.04 |
| 12 | 0 | 1 | 1 | 3087.5 | 3074.82 | 12.67 |
| 13 | 0 | 0 | 0 | 3190.55 | 3081.21 | 109.33 |
| 14 | 0 | 0 | 0 | 3008.61 | 3081.21 | −72.61 |
| 15 | 0 | 0 | 0 | 3093.05 | 3081.21 | 11.83 |
| 16 | 0 | 0 | 0 | 3034.72 | 3081.21 | −46.49 |
| 17 | 0 | 0 | 0 | 3079.16 | 3081.21 | −2.05 |
Experiments are performed at 95% LOS (level of significance). R squared 0.955; adjusted R squared 0.875
There is a 97.39% chance that a “Lack of Fit F-value” this large could occur due to noise. Non-significant lack of fit is good since we want the model to fit. The R 2 value of the model is 0.9551 which illustrates a correlation between the predicted and the experimental values by 95.51%. The “Pred R-Squared” of 0.8766 is in reasonable agreement with the “Adj R-Squared” of 0.8755. “Adeq Precision” measures the signal to noise ratio. A ratio greater than 4 is desirable and, therefore, the ratio of 11.454 given by the present model indicates an adequate signal. Hence, this model can be utilized to navigate the design space.
The Model F value of 13.50 implies that the model is significant. There is only a 0.12% chance that a “Model F-Value” this large could occur due to noise. Values of “Prob > F” less than 0.0500 indicate that the model terms are significant. In this case, A (<0.0001) and BC (0.0142) are significant model terms. Values greater than 0.1000 indicate that the model terms are not significant. The “Lack of Fit F-value” of 0.07 implies that the Lack of Fit is not significant relative to the pure error. There is a 97.39% chance that a “Lack of Fit F-value” this large could occur due to noise. Non-significant lack of fit is good for the model to fit. The non-significant lack of fit and significant F value proves that the quadratic model was highly significant. The analysis of variance (ANOVA) is provided in Table 4 which shows the p value less than 0.1 (0.001) at 95% confidence level illustrating the significance of the model. Moreover, the degree of freedom is 9 which is equivalent to the independent observation number. The p values can be taken as factor for verifying significance of each coefficient that explained each parameter’s interaction strength and also the mutual interaction pattern between variables.
Table 4.
ANOVA of the response surface model for the β-glucosidase activity
| Variables | Coefficients | Sum of squares | df | Mean square | F value | p value Prob > F | Remarks |
|---|---|---|---|---|---|---|---|
| Model | 3109.21 | 1200889.90 | 9 | 133432.21 | 13.49 | 0.001 | Significant |
| A-Esculin | 346.01 | 957770.21 | 1 | 957770.21 | 96.89 | <0.0001 | |
| B-KH2PO4 | −46.01 | 16932.60 | 1 | 16932.60 | 1.71 | 0.23 | |
| C-MgSO4 | 7.6413 | 467.12 | 1 | 467.12 | 0.05 | 0.83 | |
| AB | −35.07 | 4919.61 | 1 | 4919.61 | 0.49 | 0.503 | |
| AC | −23.61 | 2229.68 | 1 | 2229.68 | 0.221 | 0.64 | |
| BC | 161.11 | 103828.95 | 1 | 103828.95 | 10.50 | 0.01 | |
| A2 | −100.27 | 42333.12 | 1 | 42333.12 | 4.28 | 0.07 | |
| B2 | −44.02 | 8160.09 | 1 | 8160.09 | 0.82 | 0.39 | |
| C2 | −113.11 | 53876.29 | 1 | 53876.29 | 5.45 | 0.05 | |
| Residual | 69195.08 | 7 | 9885.01 | ||||
| Lack of Fit | 3370.62 | 3 | 1123.54 | 0.06 | 0.97 | Not significant | |
| Pure Error | 65824.46 | 4 | 16456.11 | ||||
| Cor Total | 1270084.99 | 0.99 |
F Fishers’s function, df degrees of freedom, p value: corresponding level of significance
The analysis for sequential model fitting is given in Table 5. The linear and interactive models (2FI) showed lesser values of R 2, predicted R 2, and adjusted R 2 than that of quadratic and cubic model. The interactive models (2FI) showed higher p values as compared with the quadratic model. The adjusted R 2 (0.875) and predicted R 2 (0.872) were found to be maximum in the quadratic model. Therefore, quadratic model including the interactive, linear and quadratic effects was utilized for explaining variables effects used in the process on the β-glucosidase activity. Table 5 further demonstrates the lack of fit test, model summary statistics and sequential model sum of squares.
Table 5.
Sequential model fitting for the β-glucosidase activity
| Source | Sum of squares | df | Mean square | F value | p value Prob > F | Remarks |
|---|---|---|---|---|---|---|
| Sequential model sum of squares (Type I) | ||||||
| Mean | 151786946 | 1 | 151786946 | |||
| Linear | 975169.93 | 3 | 325056.64 | 14.32 | 0.0002 | Suggested |
| 2FI | 110978.25 | 3 | 36992.75 | 2.01 | 0.17 | |
| Quadratic | 114741.71 | 3 | 38247.23 | 3.86 | 0.06 | Suggested |
| Cubic | 3370.62 | 3 | 1123.54 | 0.07 | 0.97 | Aliased |
| Residual | 65824.46 | 4 | 16456.11 | |||
| Total | 153057031 | 17 | 9003354.76 | |||
| Lack of fit tests | ||||||
| Linear | 229090.59 | 9 | 25454.51 | 1.54 | 0.35 | Suggested |
| 2FI | 118112.34 | 6 | 19685.38 | 1.19 | 0.45 | |
| Quadratic | 3370.62 | 3 | 1123.54 | 0.06 | 0.97 | Suggested |
| Cubic | 0 | 0 | Aliased | |||
| Pure error | 65824.46 | 4 | 16456.11 | |||
| Source | Std. Dev. | R 2 | Adjusted R 2 | Predicted R 2 | PRESS | Remarks |
|---|---|---|---|---|---|---|
| Model summary statistics | ||||||
| Linear | 150.61 | 0.76 | 0.714 | 0.62 | 483102.40 | Suggested |
| 2FI | 135.62 | 0.86 | 0.768 | 0.692 | 387022.11 | |
| Quadratic | 99.42 | 0.95 | 0.875 | 0.872 | 156780.65 | Suggested |
| Cubic | 128.28 | 0.93 | 0.792 | + | Aliased | |
The determination of maximum enzyme production with optimal levels of esculin (A), K2HPO4 (B) and MgSO4 (C) and to evaluate the relationship between dependent and independent variables, a second-order polynomial model was inferred. Thus, the experimental data were tested with multiple regression analysis to get second-order polynomial equation that uses independent variables for defining the predicted response:
where R is the predicted response, A is the esculin; B is KH2PO4 and C is MgSO4.
Model adequacy
Adequacy of the BBD model was verified to perceive the closeness of the actual values to the derived model values (Maran et al. 2013). Supplementary Fig. S3 interprets the diagnostic plots for the model adequacy from the results of the residual and experimental data. The goodness fit for the model was analyzed using the graph of internally studentized residual (Supplementary Fig. S3A) showing all the data values lying within the limits. The model predicted value was reasonably close to the experimental values so that the value of the experimental and predicted values lies in and very near to the straight line (Supplementary Fig. S3B). Hence, the results indicated a successful prediction of the correlation among the process variables on response by the derived model. The graph for normal % probability of residuals for the response was also found to be normally distributed, since the values lie close to the straight line showing no variance deviation (Supplementary Fig. S3C). The graph in Supplementary Fig. S3D illustrates the absence of unexpected errors in the model on the basis of the fact of lesser lower than 1 values of all the leverages. The graph representing the beta values illustrated no unnecessary influence on any regression coefficients by any observations (Supplementary Fig. S3E). The externally studentized residual showed an acceptable range (Supplementary Fig. S3F), indicating the absence of influential observations in experimental data. Therefore, the above results indicated that the model can be utilized for the optimum conditions prediction for β-glucosidase production. On the basis of optimal values, a desirability ramp was developed using numerical optimization techniques (Supplementary Fig. S4)
Effect of esculin, K2HPO4 and MgSO4 concentrations on β glucosidase enzyme production
3-D Response surface and contour plots were drawn for the responses observed in the BB design. The plots were drawn on the basis of model polynomial functions to evaluate the response surface changes. The plots explained the effects on the response of two factors at a time while maintaining the third factor at level zero. The interaction effects of esculin and K2HPO4 on concentration of enzyme yield with MgSO4 at constant level are shown in Fig. 6a, b. Esculin showed to have a significant effect on enzyme yield since the highest β-glucosidase activity as predicted by the model was 3397.2 IU with 1.9 g/L esculin and 0.5 g/L K2HPO4. Increasing the concentration of either of the factors would result in repression of enzyme activity.
Fig. 6.
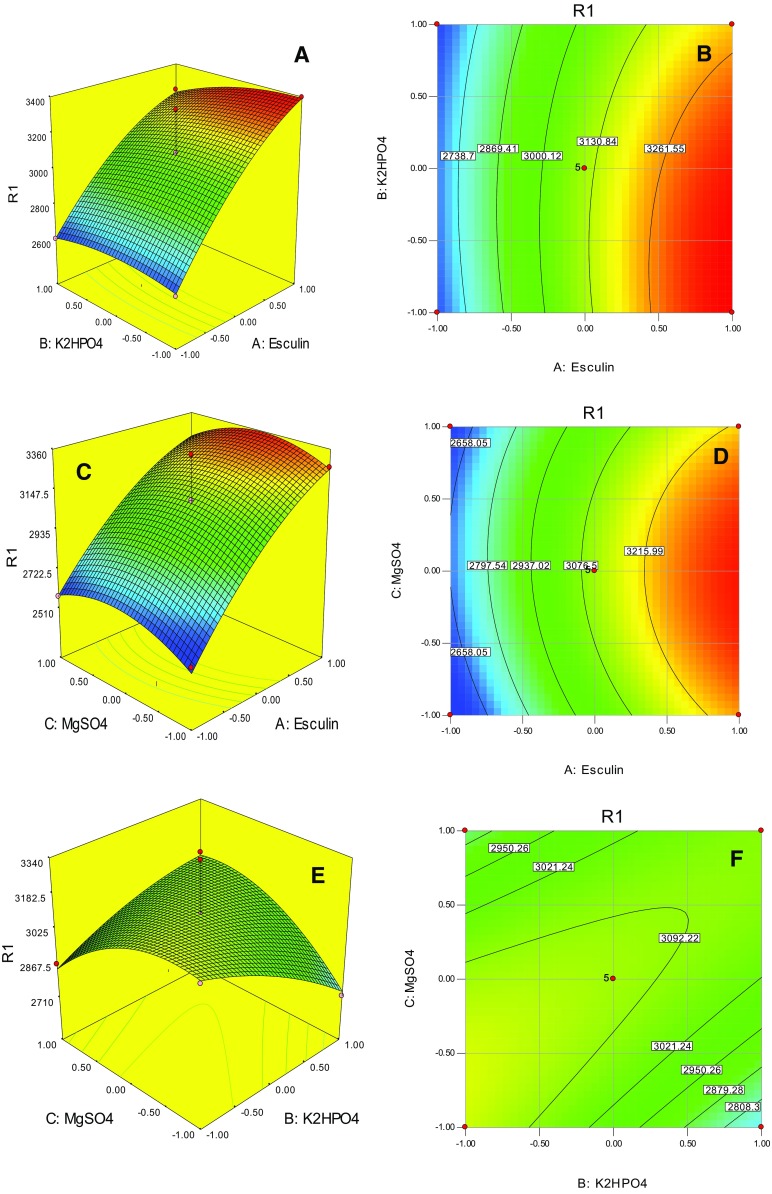
3D Response surface and contour plots showing interactions between KH2PO4, Esculin and MgSO4 for β-glucosidase production. R1 is response-1
Figure 6c, d exemplifies the effect of esculin and MgSO4 interaction on the enzyme yield maintaining K2HPO4 at a constant level. The highest yield as predicted by the model is 3360 IU with a middle level at a concentration of 1 g/L esculin and 0.3 g/L MgSO4. The enzyme activity decreases if the concentration is increased beyond this point for both the factors. The response result showed the mutual-dependent influence on the enzyme activity. At a concentration of 3.5 g/L K2HPO4 and 0.5 g/L MgSO4, the maximum enzyme activity of 3182.5 IU was observed (Fig. 6e, f). The esculin was maintained at constant level in this case. Esculin is a coumarin glucoside and this substrate stimulates the gene promoters to favor the induction of the microbial β-glucosidase system, while potassium phosphate acts as a buffering agent in the medium for the uptake of the nutrients. The addition of divalent metal ions like magnesium is important in the fermentation medium, since it plays a major role in cell metabolism favoring optimal enzyme secretion.
Model verification
The verification of the model was performed both experimentally and then compared with predicted value by taking the optimal concentrations of factors resulting from the optimization experiments. The enzyme activity found experimentally was 3340 IU, whereas 3301 IU was the predicted value, thereby indicating a high degree of accuracy (98.2%) of the model. Therefore, the conditions for the optimum enzyme growth were esculin (1.9 g/L), K2HPO4 (0.5 g/L) and MgSO4 (0.3 g/L).
Conclusion
An attempt was made in the present study to optimize nutritional and environmental parameters to maximize β-glucosidase enzyme production from a newly isolated strain of Bacillus stratosphericus strain SG9. The optimization experiments indicated esculin, KH2PO4 and MgSO4 to be the best contributors favoring maximum enzyme production. Based on the Box–Behnken statistical optimization, the maximum enzyme production increased by fivefold (from 660 to 3340 IU). The 16S rRNA gene sequence and the biochemical analysis for the identification of the new strain have been delineated in the present study.
Electronic supplementary material
Below is the link to the electronic supplementary material.
Acknowledgements
The authors gratefully acknowledge the financial support extended by Council of Scientific and Industrial Research, India, in the form of a senior research fellowship to Ms. Soma Gupta.
Compliance with ethical standards
Conflict of interest
There are no known conflicts of interest associated with this publication and there has been no significant financial support for this work that could have influenced its outcome.
Footnotes
Electronic supplementary material
The online version of this article (doi:10.1007/s13205-017-0866-7) contains supplementary material, which is available to authorized users.
Contributor Information
C. Ganesh Kumar, Email: cgkumar@iict.res.in
Ahmed Kamal, Email: ahmedkamal@iict.res.in.
References
- Akhavan Sepahy A, Jabalameli L. Effect of culture conditions on the production of an extracellular protease by Bacillus sp. isolated from soil sample of Lavizan jungle park. Enzyme. 2011 doi: 10.4061/2011/219628. [DOI] [PMC free article] [PubMed] [Google Scholar]
- Ali S, Awan UF, Javed W. Dipotassium hydrogen phosphate improves lipase production at a neutral pH of phosphate buffer by Rhizopous oligosporous. Biologia. 2012;58:65–71. [Google Scholar]
- An DS, Im WT, Yang HC, Yang DC, Lee ST. Dyella koreensis sp. nov., a β-glucosidase producing bacterium. Int J Syst Evolut Microbiol. 2005;55:1625–1628. doi: 10.1099/ijs.0.63695-0. [DOI] [PubMed] [Google Scholar]
- Atalla MM, Farag MM, Eman RH, Abd-El-Lataif MS, Nehad EA. Optimum conditions for uricase enzyme production by Gliomastix gueg. Malays J Microbiol. 2009;5:45–50. [Google Scholar]
- Bai H, Wang H, Sun J, Irfan M, Han M, Huang Y, Yang XHQ. Production, purification and characterization of novel beta glucosidase from newly isolated Penicillium simplicissimum H-11 in submerged fermentation. EXCLI J. 2013;12:528–540. [PMC free article] [PubMed] [Google Scholar]
- Bhatia Y, Mishra S, Bisaria VS. Microbial β-glucosidases: cloning, properties, and applications. Crit Rev Biotechnol. 2002;22:375–407. doi: 10.1080/07388550290789568. [DOI] [PubMed] [Google Scholar]
- Box GEP, Behnken DW. Some new three level designs for the study of quantitative variables. Technometrics. 1960;2:455–475. doi: 10.1080/00401706.1960.10489912. [DOI] [Google Scholar]
- Chellapandi P, Himanshu MJ. Production of endoglucanase by the native strains of Streptomyces isolates in submerged fermentation. Braz J Microbiol. 2008;39:122–127. doi: 10.1590/S1517-83822008000100026. [DOI] [PMC free article] [PubMed] [Google Scholar]
- Dhake AB, Patil MB. Production of β-glucosidase by Penicillium purpurogenum. Braz J Microbiol. 2005;36:170–176. doi: 10.1590/S1517-83822005000200013. [DOI] [Google Scholar]
- El-Naggar NA, Haroun SA, Owis EA, Sherief AA. Optimization of β-glucosidase production by Aspergillus terreus strain EMOO 6-4 using response surface methodology under solid-state fermentation. Prep Biochem Biotechnol. 2015;45:568–587. doi: 10.1080/10826068.2014.940968. [DOI] [PubMed] [Google Scholar]
- Ghose TK, Bisaria VS. Measurement of hemicellulase activities. Part I. Xylanases. Pure Appl Chem. 1987;59:1739–1752. [Google Scholar]
- Heck JX, Hertz PF, Ayub MAZ. Cellulase and xylanase productions by isolated Amazon Bacillus strains using soybean industrial residue based solid-state cultivation. Braz J Microbiol. 2002;33:213–218. doi: 10.1590/S1517-83822002000300005. [DOI] [Google Scholar]
- Holt JG, Krieg NR, Peter HAS, Bergey DH. Bergey’s manual of determinative bacteriology. 9. Baltimore: Williams & Wilkins; 1994. [Google Scholar]
- Hu YB, Luan HB, Haoa DB, Xiao HC, Yang SA, Yang L. Purification and characterization of a novel ginsenoside-hydrolyzing β-glucosidase from the China white jade snail (Achatina fulica) Enzyme Microb Technol. 2007;40:1358–1366. doi: 10.1016/j.enzmictec.2006.10.011. [DOI] [Google Scholar]
- Jonas R, Farah LF. Production and application of microbial cellulose. Polym Degradat Stab. 1998;59:101–106. doi: 10.1016/S0141-3910(97)00197-3. [DOI] [Google Scholar]
- Ketudat Cairns JR, Mahong B, Baiya S, Jeon JS. β-Glucosidases: multitasking, moonlighting or simply misunderstood? Plant Sci. 2015;241:246–259. doi: 10.1016/j.plantsci.2015.10.014. [DOI] [PubMed] [Google Scholar]
- Kotchoni OS, Shonukan OO, Gachomo WE. Bacillus pumilus BPCRI6 a promising candidate for cellulase production under conditions of catabolite repression. J Biotechnol. 2003;2:140–146. [Google Scholar]
- Lai Q, Liu Y, Shao Z. Bacillus xiamenensis sp. nov., isolated from intestinal tract contents of a flathead mullet (Mugil cephalus) Antonie Van Leeuwenhoek. 2014;105:99–107. doi: 10.1007/s10482-013-0057-4. [DOI] [PubMed] [Google Scholar]
- Lin SF, Chiou CM, Tsai YC. Effect of Triton X-100 on alkaline lipase production by Pseudomonas pseudoalcaligenes F-111. Biotechnol Lett. 1995;17:959–962. doi: 10.1007/BF00127434. [DOI] [Google Scholar]
- Magalhaes PO, Ferraz A, Milagres AFM. Enzymatic properties of two β-glucosidases from Ceriporiopsis subvermispora produced in biopulping conditions. J Appl Microbiol. 2006;101:480–486. doi: 10.1111/j.1365-2672.2006.02946.x. [DOI] [PubMed] [Google Scholar]
- Maran JP, Manikandan S, Thirugnanasambandham K, Nivetha CV, Dinesh R. Box-Behnken design based statistical modeling for ultrasound-assisted extraction of corn silk polysaccharide. Carbohydr Polym. 2013;92:604–611. doi: 10.1016/j.carbpol.2012.09.020. [DOI] [PubMed] [Google Scholar]
- Okamota K, Nakano H, Yatake H, Kiso T, Kitahata S. Purification and some properties of β-glucosidase from Fusobacterium johnsonae. Biosci Biotechnol Biochem. 2000;64:333–340. doi: 10.1271/bbb.64.333. [DOI] [PubMed] [Google Scholar]
- Otieno DO, Shah NP. Endogenous β-glucosidase and β-galactosidase activities from selected probiotic micro-organisms and their role in isoflavone biotransformation in soymilk. J Appl Microbiol. 2007;103:910–912. doi: 10.1111/j.1365-2672.2007.03438.x. [DOI] [PubMed] [Google Scholar]
- Panesar PS, Chavan YV, Bera MB, Chand O, Kumar H. Evaluation of Acetobacter strain for the production of microbial cellulose. Asian J Chem. 2009;21:99–102. [Google Scholar]
- Parry NJ, Beever DE, Owen E, Vandenberghe I, Van Beeumen J, Bhat MK. Biochemical characterization and mechanism of action of a thermostable beta-glucosidase purified from Thermoascus aurantiacus. Biochem J. 2001;353:117–127. doi: 10.1042/bj3530117. [DOI] [PMC free article] [PubMed] [Google Scholar]
- Plackett RL, Burman JP. The design of optimum multifactorial experiments. Biometrika. 1946;33:305–325. doi: 10.1093/biomet/33.4.305. [DOI] [Google Scholar]
- Ramana KV, Tomar A, Singh L. Effect of various carbon and nitrogen sources on cellulose synthesis by Acetobacter xylinum. World J Microbiol Biotechnol. 2000;16:245–248. doi: 10.1023/A:1008958014270. [DOI] [Google Scholar]
- Raut GR, Chakraborty S, Chopade BA, Kokare CR. Isolation and characterization of organic solvent stable protease from alkaliphilic marine Saccharopolyspora species. Indian J Geo-Mar Sci. 2013;42:131–138. [Google Scholar]
- Rodriguez H, Alea F, Kyslíkova E. Regulation of cellulolytic activity in Cellulomonas sp. IIBC. Biores Technol. 1996;55:79–82. doi: 10.1016/0960-8524(95)00149-2. [DOI] [Google Scholar]
- Saitou N, Nei M. The neighbor-joining method: a new method for reconstructing phylogenetic trees. Mol Biol Evol. 1987;4:406–425. doi: 10.1093/oxfordjournals.molbev.a040454. [DOI] [PubMed] [Google Scholar]
- Samiullah TR, Bakhsh A, Rao AQ, Naz M, Saleem M. Isolation, purification and characterization of extracellular β-glucosidase from Bacillus sp. Adv Environ Biol. 2009;3:269–277. [Google Scholar]
- Sasirekha B, Bedashree T, Champa KL. Optimization and partial purification of extracellular phytase from Pseudomonas aeruginosa p6. Eur J Exp Biol. 2012;2:95–104. [Google Scholar]
- Shanmugaprakash M, Kirthika J, Ragupathy J, Nilanee K, Manickam A. Statistical based media optimization and production of naringinase using Aspergillus brasiliensis 1344. Int J Biol Macromol. 2014;64:443–452. doi: 10.1016/j.ijbiomac.2013.12.033. [DOI] [PubMed] [Google Scholar]
- Sharon C, Furugoh S, Yamakido T, Ogawa H, Kato Y. Purification and characterization of a lipase from Pseudomonas aeruginosa KKA-5 and its role in castor oil hydrolysis. J Ind Microbiol Biotechnol. 1998;20:304–307. doi: 10.1038/sj.jim.2900528. [DOI] [Google Scholar]
- Shivaji S, Chaturvedi P, Suresh K, Reddy GSN, Dutt CBS, Wainwright M, Narlikar JV, Bhargava PM. Bacillus aerius sp. nov., Bacillus aerophilus sp. nov., Bacillus stratosphericus sp. nov. and Bacillus altitudinis sp. nov., isolated from cryogenic tubes used for collecting air samples from high altitudes. Int J Syst Evol Microbiol. 2006;56:1465–1473. doi: 10.1099/ijs.0.64029-0. [DOI] [PubMed] [Google Scholar]
- Singh VK, Kumar A. Production and purification of an intracellular cellulase from Bacillus brevis VS-1. Biochem Mol Biol Int. 1998;45:443–452. doi: 10.1080/15216549800202832. [DOI] [PubMed] [Google Scholar]
- Spano G, Rinaldi A, Ugliano M, Beneduce L, Massa S. A β- glucosidase producing gene isolated from wine Lactobacillus plantarum is regulated by abiotic stresses. J Appl Microbiol. 2005;98:855–861. doi: 10.1111/j.1365-2672.2004.02521.x. [DOI] [PubMed] [Google Scholar]
- Sreeja SJ, Jeba Malar PW, Joseph FRS, Tiburcius S, Immanuel G, Palavesam A. Optimization of cellulase production by Bacillus altitudinis APS MSU and Bacillus licheniformis APS2 MSU, gut isolates of fish Etroplus suratensis. Int J Adv Res Technol. 2013;2:401–406. [Google Scholar]
- Tamura K, Stecher G, Peterson D, Filipski A, Kumar S. MEGA6: molecular evolutionary genetics analysis version 6.0. Mol Biol Evol. 2013;30:2725–2729. doi: 10.1093/molbev/mst197. [DOI] [PMC free article] [PubMed] [Google Scholar]
- Tiwari S, Shukla N, Mishra P, Gaur R. Enhanced production and characterization of a solvent stable amylase from solvent tolerant Bacillus tequilensis RG-01: thermostable and surfactant resistant. Sci World J. 2014;2014:972763. doi: 10.1155/2014/972763. [DOI] [PMC free article] [PubMed] [Google Scholar]
- Uma Maheshwar Rao JL, Satyanarayana T. Enhanced secretion and low temperature stabilization of a hyperthermostable and Ca2+-independent α-amylase of Geobacillus thermoleovorans by surfactants. Lett Appl Microbiol. 2003;36:191–196. doi: 10.1046/j.1472-765X.2003.01283.x. [DOI] [PubMed] [Google Scholar]
- Veena V, Poornima P, Parvatham R, Sivapriyadharsini Kalaiselvi K. Isolation and characterization of β-glucosidase producing bacteria from different sources. Afr J Biotechnol. 2011;10:14907–14912. doi: 10.5897/AJB09.314. [DOI] [Google Scholar]
- Verdoucq L, Czjzeck M, Moriniere J, Bevan DR, Esen A. Mutational and structural analysis of aglycone specificity in maize and sorghum β-glucosidases. J Biol Chem. 2003;278:25055–25062. doi: 10.1074/jbc.M301978200. [DOI] [PubMed] [Google Scholar]
- Wayne LG, Brenner DJ, Colwell RR, Grimont PAD, Kandler O, Krichevsky MI, Moore LH, Moore WEC, Murray RGE, Stackebrandt E, Starr MP, Truper HG. International Committee on Systematic Bacteriology. Report of the adhoc committee on reconciliation of approaches to bacterial systematics. Int J Syst Bacteriol. 1987;37:463–464. doi: 10.1099/00207713-37-4-463. [DOI] [Google Scholar]
- Wood TM, Wilson CA, Stewart CS. Preparation of the cellulase from the cellulolytic anaerobic rumen bacterium Ruminococcus albus and its release from the bacterial cell wall. Biochem J. 1982;205:129–137. doi: 10.1042/bj2050129. [DOI] [PMC free article] [PubMed] [Google Scholar]
- Wright RM, Yablonsky MD, Shalita ZP, Goyal AK, Eveleigh DE. Cloning, characterization, and nucleotide sequence of a gene encoding Microbispora bispora BglB, a thermostable beta-glucosidase expressed in Escherichia coli. Appl Environ Microbiol. 1992;58:3455–3465. doi: 10.1128/aem.58.11.3455-3465.1992. [DOI] [PMC free article] [PubMed] [Google Scholar]
- Yodsuwan N, Owatworakit A, Ngaokla A, Tawichai N, Soykeabkaew N (2012) Effect of carbon and nitrogen sources on bacterial cellulose production for bionanocomposite materials. 1st Mae Fah Luang University International Conference, At Mae Fah Luang University, Chiang Rai, Thailand
- Yun SI, Jeong CS, Chung DK, Choi HS. Purification and some properties of a β-glucosidase from Trichoderma harzanium Type C-4. Biosci Biotechnol Biochem. 2001;65:2028–2032. doi: 10.1271/bbb.65.2028. [DOI] [PubMed] [Google Scholar]
Associated Data
This section collects any data citations, data availability statements, or supplementary materials included in this article.