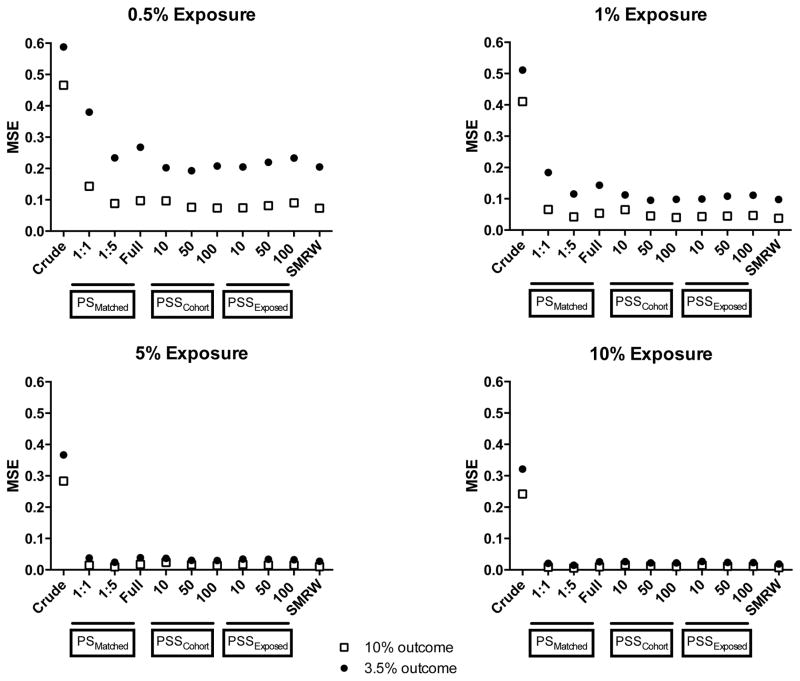
Figure 4.
Mean squared errors for different analytic approaches over 1,000 simulations
Abbreviations: MSE- Mean squared error, PS- Propensity scores, PSSExposed- Propensity score stratification, strata created by ranking only the exposed group, PSSCohort- Propensity score stratification, strata created by ranking the entire cohort, SMRW- Standardized mortality ratio weighting

