Abstract
The aim of the study
Was to assess current prevalence of hepatitis C virus (HCV) genotypes in Poland, including their geographic distribution and changes in a given period of time.
Material and methods
Data were collected with questionnaires from 29 Polish centers and included data of patients diagnosed with HCV infection between 1 January 2013 and 31 March 2016.
Results
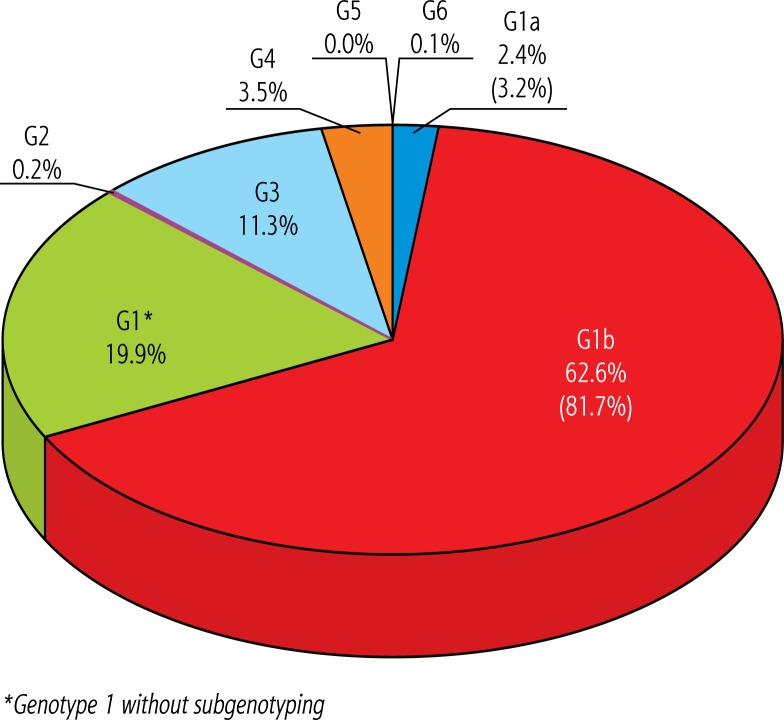
In total, data of 9800 patients were reported. The highest prevalence was estimated for genotype 1b (81.7%), followed by 3 (11.3%), 4 (3.5%), 1a (3.2%) and 2 (0.2%). Genotype 5 or 6 was reported in 6 patients only (0.1%). The highest prevalence of genotype 1 was observed in central (łódzkie, mazowieckie, świętokrzyskie), eastern (lubelskie) and southern (małopolskie, śląskie) Poland. The highest rate for genotype 3 was observed in south-western (dolnośląskie, lubuskie) and eastern (podlaskie, warmińsko-mazurskie and podkarpackie) Poland. Compared to historical data, we observed an increasing tendency of G1 prevalence from 72.0% in 2003 to 87.5% in 2016, which was accompanied by a decrease of G3 (17.9% vs. 9.1%) and G4 (9.0% vs. 3.1%).
Conclusions
Almost 85% of patients with HCV in Poland are infected with genotype 1 (almost exclusively subgenotype 1b), and its prevalence shows an increasing tendency, accompanied by a decrease of genotypes 3 and 4.
Keywords: liver, hepatitis C, epidemiology, infection
Introduction
Chronic hepatitis C is the leading cause of cirrhosis, hepatocellular carcinoma (HCC), and liver transplantation. Therefore a reduction of hepatitis C virus (HCV) prevalence should be a crucial activity for public health. According to a recent estimation, about 200 000 individuals are infected with the HCV in Poland [1]. As demonstrated recently, a significant reduction of the HCV burden in Poland is possible due to improved diagnosis and increased treatment efficacy [2].
The new generation of direct acting antivirals (DAA) available from 2014 combined with each other provide sustained virologic response (SVR) rates above 90% irrespectively of fibrosis, treatment history or host factors that significantly affected the efficacy of the previous regimens. Moreover, the safety profile in the majority of patient populations is excellent, and the treatment duration usually does not exceed 12 weeks [3–5]. The new Polish reimbursement policy for HCV treatment, which is based on clinical practice guidelines of the Polish HCV Expert Group, provides an opportunity for successful reduction of HCV prevalence [6]. The major factor which still affects efficacy of the treatment is HCV genotype (G). Therefore current knowledge on genotype distribution is crucial for further development of the therapeutic strategy and reimbursement policy. According to data from 14 651 patients treated in Poland between 2003 and 2012, the majority were infected with genotype 1 (79%), followed by G3 (14%) and G4 (5%) [7]. Unfortunately this analysis did not include subgenotyping in patients infected with G1 and did not reflect the most recent epidemiological situation.
The aim of this study was to assess current occurrence of HCV genotypes in Poland, which can be helpful in development of treatment strategies necessary to control the HCV infection burden.
Material and methods
Data were collected with an Excel (Microsoft) based questionnaire filled out by 29 Polish centers from 15 voivodships involved in diagnosis and treatment of HCV-infected patients. All voivodships, except opolskie, were included in the database. The questionnaire contained information on number of patients diagnosed with each genotype (1a, 1b, 2, 3, 4, 5, 6) in particular years between 1 January 2013 and 31 March 2016. Submitted data were combined and genotypes’ prevalence, geographic distribution and annual changes were analyzed.
Results
Data from a total of 9800 surveyed patients were entered into the database. As shown in Table 1, the most frequent was genotype 1, identified in 84.9% of patients, followed by G3 (11.3%), G4 (3.5%) and G2 (0.2%). Genotypes 5 and 6 were reported in 6 patients only (0.1%). Subgenotype 1b was reported in 62.6% of patients, which means 73.7% of patients infected with G1 (Fig. 1). Since there were no subgenotyping data available for 1947 patients, we carried out estimations based on data from the subgenotyped population. The proportion of G1b among 6374 subgenotyped patients (G1a + G1b) was 96%, which allowed us to calculate the possible number of 1869 G1b patients among those without available subgenotyping. According to this calculation, prevalence of G1b can be estimated as 81.7% and G1a as 3.2%. Data from voivodeships with the subgenotyping rate > 95% demonstrate that G1b prevalence can vary in particular regions, from 62.9% in lubuskie to 89.5% in świętokrzyskie.
Table 1.
Distribution of HCV genotypes in particular voivodeships among patients diagnosed between 1 January 2013 and 31 March 2016 in 29 centers; no data available for opolskie voivodeship. Estimations of G1a and G1b prevalence in all G1 patients based on the proportion of subgenotypes among those subgenotyped (G1a/G1b: 4/96) are shown in brackets
| n | Genotypes | |||||||||
|---|---|---|---|---|---|---|---|---|---|---|
| 1 All | 1a | 1b | 1 Other* | 2 | 3 | 4 | 5 | 6 | ||
| 8321 | 239 | 6135 | 1947 | 21 | 1113 | 339 | 1 | 5 | ||
| Poland | 9800 | 84.9% | 2.4% (3.2%) | 62.6% (81.7%) | 19.9% | 0.2% | 11.3% | 3.5% | 0% | 0.1% |
| Voivodeships | ||||||||||
| podlaskie | 184 | 70.1% | 3.3% | 66.8% | 0% | 0.5% | 17.4% | 11.4% | 0% | 0.5% |
| lubuskie | 536 | 72.2% | 6.2% | 62.9% | 3.2% | 0.4% | 20.5% | 6.9% | 0% | 0% |
| podkarpackie | 137 | 72.3% | 2.2% | 69.3% | 0.7% | 0% | 17.5% | 10.2% | 0% | 0% |
| dolnośląskie | 1000 | 74.7% | 1.7% | 28.0% | 45.0% | 0.2% | 20.9% | 4.2% | 0% | 0% |
| warmińsko-mazurskie | 202 | 76.2% | 0.5% | 51.0% | 24.8% | 0.5% | 16.8% | 5.9% | 0.5% | 0% |
| kujawsko-pomorskie | 523 | 79.2% | 0.4% | 14.9% | 63.9% | 0% | 11.7% | 8.8% | 0% | 0.4% |
| pomorskie | 531 | 80.0% | 0.0% | 20.3% | 59.7% | 0.6% | 15.3% | 4.0% | 0% | 0.2% |
| mazowieckie | 1428 | 86.7% | 2.7% | 79.1% | 4.8% | 0.2% | 9.9% | 3.2% | 0% | 0% |
| wielkopolskie | 426 | 87.8% | 10.1% | 70.2% | 7.5% | 0% | 8.7% | 3.5% | 0% | 0% |
| śląskie | 2189 | 88.8% | 1.0% | 81.7% | 6.1% | 0.2% | 9.5% | 1.6% | 0% | 0% |
| zachodniopomorskie | 57 | 89.5% | 1.8% | 78.9% | 8.8% | 0% | 5.3% | 5.3% | 0% | 0% |
| świętokrzyskie | 380 | 89.7% | 0.3% | 89.5% | 0% | 0% | 7.1% | 3.2% | 0% | 0% |
| małopolskie | 918 | 90.3% | 2.0% | 81.7% | 6.6% | 0.2% | 7.5% | 2.0% | 0% | 0% |
| łódzkie | 895 | 92.2% | 5.8% | 47.9% | 38.4% | 0.1% | 6.4% | 1.2% | 0% | 0.1% |
| lubelskie | 394 | 92.6% | 0.5% | 58.4% | 33.8% | 0.3% | 5.1% | 2.0% | 0% | 0% |
Genotype 1 without subgenotyping
Fig. 1.
Distribution of HCV genotypes in 9800 Polish patients enrolled for treatment of chronic hepatitis C between 1 January 2013 and 31 March 2016 in 29 centers. Estimations of G1a and G1b prevalence in all G1 patients based on the proportion of subgenotypes among those subgenotyped (G1a/G1b: 4/96) are shown in brackets
Geographic analysis of major genotypes’ prevalence indicates significant regional differences (Table 1). The highest prevalence of G1 was observed in central (łódzkie, mazowieckie, świętokrzyskie), eastern (lubelskie) and southern (małopolskie, śląskie) Poland, whereas the highest rate of G3 was observed in south-western (dolnośląskie, lubuskie) and eastern (podlaskie, warmińsko-mazurskie, podkarpackie) Poland.
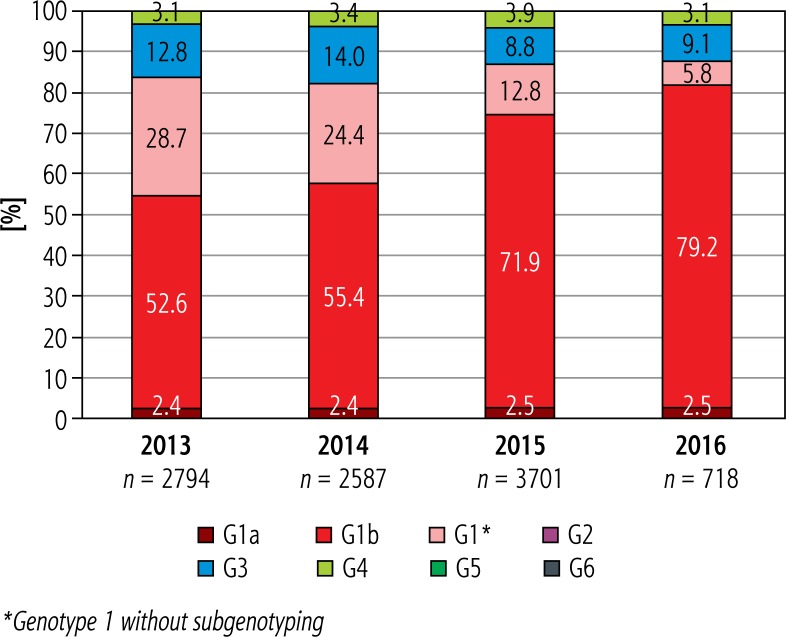
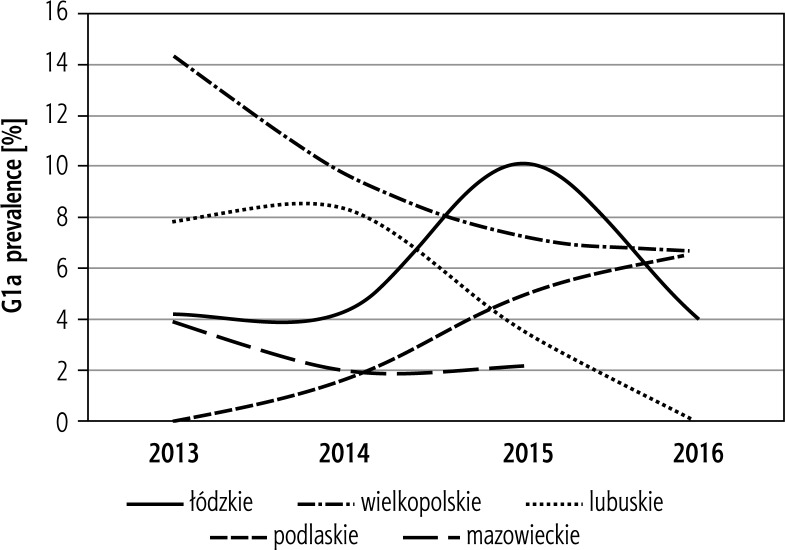
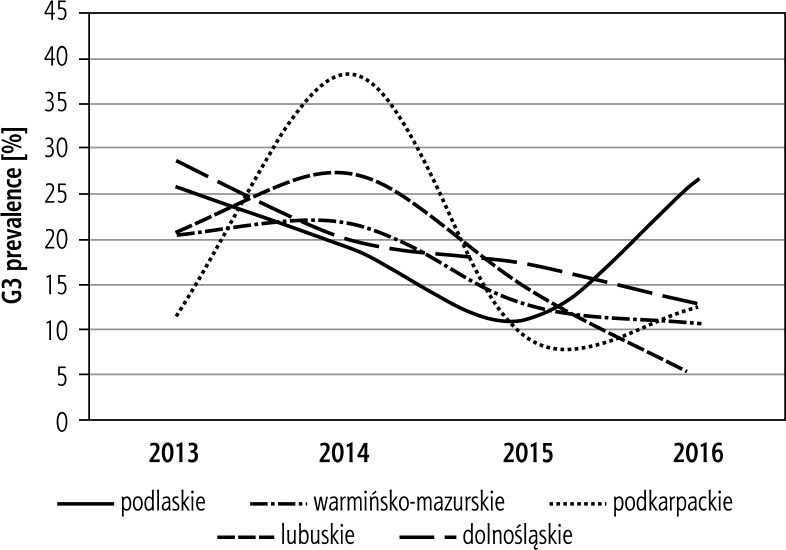
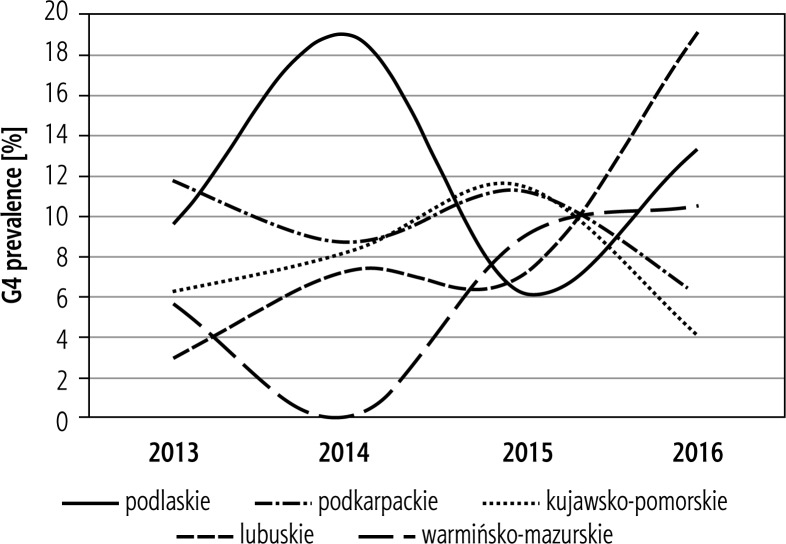
As shown in Figure 2, between 2013 and 2016 there is an increasing tendency of G1 prevalence from 84.1% to 87.8%. Irrespective of the increasing proportion of subgenotyped G1 infections (from 55% in 2013 to 81.7% in 2016), there is a stable, low prevalence of G1a (2.5%). However, data from voivodeships with the highest prevalence of G1a indicate some regional differences. An increasing tendency is observed in podlaskie, a stable or fluctuating tendency in mazowieckie and wielkopolskie, and a decreasing tendency in lubuskie and wielkopolskie (Fig. 3). The annual prevalence of G3 shows a decrease from 12.8% in 2013 to 9.1% in 2016 (Fig. 2), which is supported by data from voivodeships with the highest G3 rate (Fig. 4). In contrast, the prevalence of G4 is stable (Fig. 2), but an increasing tendency in lubuskie and warmińsko-mazurskie requires further monitoring (Fig. 5).
Fig. 2.
Annual changes in distribution of HCV genotypes between 2013 and 2016 in Poland
Fig. 3.
Changes in prevalence of HCV genotype 1a between 2013 and 2016 in selected voivodeships with the highest prevalence of this subgenotype
Fig. 4.
Changes in prevalence of HCV genotype 3 between 2013 and 2016 in selected voivodeships with the highest prevalence of this subgenotype
Fig. 5.
Changes in prevalence of HCV genotype 4 between 2013 and 2016 in selected voivodeships with the highest prevalence of this subgenotype
Discussion
The current study demonstrated predominance of G1b infection among the studied population of patients diagnosed between 2013 and 2016. The prevalence of G1b is estimated at 81.7% followed by G3 (11.3%), G4 (3.5%) and G1a (3.2%). Other genotypes (G2, G5 and G6) were demonstrated in individual cases only. The genotype distribution in Poland seems to be similar to other Central-European countries. According to recent data, 80-85% of HCV infections in the Czech Republic are related to G1b, followed by HCV G3 (10-15%) [8]. In Slovakia G1b was identified as the most common, followed by genotype 3a and other genotypes (including 1a) [8]. In Hungary before 1993, among patients infected via blood and blood products, genotype 1b almost exclusively dominated, but due to the predominance of drug users genotype 1a recently became the most prevalent, and the remaining genotypes are G3 and G1b [8]. Also in Germany the most prevalent are G1 and G3 [9].
We were able to demonstrate an increase of G1b prevalence during the period 2013-2016, which was a consequence of both the increase of overall G1 prevalence and more frequent subgenotyping for G1. Compared to historical data there is an increasing tendency of G1 prevalence from 72.0% in 2003 to 87.5% in 2016, which was accompanied by a decrease of G3 (17.9% vs. 9.1%) and G4 (9.0% vs. 3.1%) [9]. The highest prevalence of G1 in central/southern Poland and G3 in north-eastern/south-western did not change significantly. The most significant increase of G1 prevalence compared to previous data was observed in warmińsko-mazurskie (62.0% vs. 76.2%), mazowieckie (76.6% vs. 86.7%), lubelskie (82.8% vs. 92.6%), zachodniopomorskie (80.5% vs. 89.5%) and świętokrzyskie (81.5% vs. 89.7%). In other voivodeships the proportion of G1 patients among the HCV-infected population was at the previous level. A decrease of the proportion of G3 was seen particularly in voivodeships with previously demonstrated high prevalence of this genotype, which included warmińsko-mazurskie (28.1% vs. 16.8%), zachodniopomorskie (16.2% vs. 5.3%), świętokrzyskie (14.8% vs. 7.1%) and podlaskie (23.0% vs. 17.4%). Interestingly, the difference between voivodships with the highest versus lowest prevalence of G1 decreased from 27.2% in the period 2003-2012 to 22.5% in 2013-2016, and for G3 from 20.2% to 15.8% respectively. This indicates possible obsolescence of regional differences in the future.
The distribution of genotype 3 occurrence may be connected with migrations of the twenty century, but could also be an effect of single focal outbreaks resulting from intravenous drug use and/or nosocomial, iatrogenic infections spreading selected HCV variants. Clarification could be possible using sequencing techniques in a large number of patients, but will be difficult in the near future due to the expected successful reduction of HCV prevalence in Poland.
The low prevalence of G1a and G4 seems to be stable, but in some regions it is higher than average for the country and demonstrates annual fluctuations. This probably can be explained by local small outbreaks related to drug use, but it should be investigated and clarified at the regional level.
Conclusions
In this study we were able to demonstrate predominance of genotype 1 (84.9%), which is almost exclusively subgenotype 1b, followed by genotypes 3 (11.3%) and 4 (3.5%). During the last 16 years, prevalence of genotype 1 increased from 72% in 2003 to 87.5% in 2016, and it was accompanied by a decrease of genotype 3 and 4 prevalence. Some geographic differences in genotype distribution between particular regions still exist, but they are smaller than previously.
Disclosure
Authors report no conflict of interest.
References
- 1.Flisiak R, Halota W, Horban A, et al. Prevalence and risk factors of HCV infection in Poland. Eur J Gastroenterol Hepatol. 2011;23:1213–1217. doi: 10.1097/MEG.0b013e32834d173c. [DOI] [PubMed] [Google Scholar]
- 2.Flisiak R, Halota W, Tomasiewicz K, et al. Forecasting the disease burden of chronic hepatitis C virus in Poland. Eur J Gastroenterol Hepatol. 2015;27:70–76. doi: 10.1097/MEG.0000000000000237. [DOI] [PubMed] [Google Scholar]
- 3.Pogorzelska J, Flisiak R. Real-world experience with ombitasvir/paritaprevir boosted with ritonavir and possibly combined with dasabuvir and ribavirin in HCV infection. Clin Exp Hepatol. 2016;2:34–37. doi: 10.5114/ceh.2016.60247. [DOI] [PMC free article] [PubMed] [Google Scholar]
- 4.Jaroszewicz J, Flisiak R, Dusheiko G. A pill for HCV – myth or foreseeable future? Liver Int. 2014;34:6–11. doi: 10.1111/liv.12294. [DOI] [PubMed] [Google Scholar]
- 5.Jaroszewicz J, Flisiak-Jackiewicz M, Lebensztejn D, et al. Current drugs in early development for treating hepatitis C virus-related hepatic fibrosis. Expert Opin Investig Drugs. 2015;24:1229–1239. doi: 10.1517/13543784.2015.1057568. [DOI] [PubMed] [Google Scholar]
- 6.Halota W, Flisiak R, Boroń-Kaczmarska A, et al. Recommendations for the treatment of hepatitis C issued by the Polish Group of HCV Experts – 2016. Clin Exp Hepatol. 2016;2:27–33. doi: 10.5114/ceh.2016.59099. [DOI] [PMC free article] [PubMed] [Google Scholar]
- 7.Panasiuk A, Flisiak R, Mozer-Lisewska I, et al. Distribution of HCV genotypes in Poland. Przegl Epidemiol. 2013;67:11–16. [PubMed] [Google Scholar]
- 8.Urbánek P, Kristian P, Makara M, et al. Epidemiology of HCV infection in the Central European region. Clin Exp Hepatol. 2016;1:2–6. doi: 10.5114/ceh.2016.58849. [DOI] [PMC free article] [PubMed] [Google Scholar]
- 9.Cornberg M, Razavi H, Albert A, et al. A systematic review of hepatitis C virus epidemiology in Europe, Canada and Israel. Liver Int. 2011;31(Suppl 2):30–60. doi: 10.1111/j.1478-3231.2011.02539.x. [DOI] [PubMed] [Google Scholar]


