Abstract
Local lung function is difficult to evaluate, because most lung function estimates are either global in nature, e.g. pulmonary function tests, or require equipment that cannot be used at a patient’s bedside, such as computed tomography. Yet, local function measurements would be highly desirable for many reasons. In a recent publication (Rubin et al. 2012), we were able to track displacements of the lung surface during breathing. We have now extended these results to measuring lung strains during respiration as a means of assessing local lung ventilation. We studied two human volunteers and 14 mice with either normal lung function or experimentally induced pulmonary fibrosis. The differences in strains between the control, normal mice and those with pulmonary fibrosis were significant (P < 0.0001), while the strains measured in the human volunteers closely matched linear strains predicted from the literature. Ultrasonography may be able to assess local lung ventilation in a clinical setting.
Keywords: ultrasound strain measurement, lung ventilation, lung ventilator monitoring, pulmonary fibrosis, lung ultrasound, chronic obstructive pulmonary disease (COPD), acute respiratory distress syndrome (ARDS)
Introduction
Many lung diseases are patchy or non-uniform in their distributions. Yet, these non-uniformly distributed lung diseases, such as idiopathic pulmonary fibrosis (IPF) or acute lung injury/acute respiratory distress syndrome (ARDS), are still often evaluated using methods that only provide generalized assessments of lung function (Victorino et al. 2004; Raghu et al. 2011; Thille et al. 2013). For example, IPF evaluation involves pulmonary function studies which are global estimates of lung function that cannot assess the true distribution of the disease (Raghu et al. 2011; Raghu et al. 2012; King et al. 2014; Oldham and Noth 2014).
Local assessments can be performed; the most common of which is the standard chest radiograph. However, because of the limitations of chest radiographs, regional evaluations of diseases with non-uniform lung involvement generally focus on computed tomography (CT) with CT generally considered the gold standard for local lung architecture (Lynch et al. 2005). Yet, CT is not perfect. CT is not a portable technique, so it cannot be used to assess lung function or mechanics in remote locations such as in intensive care units (ICU), and it is not optimal for screening/monitoring due the radiation risk. Further, CT does not provide much functional information without extensive computational efforts (Galban et al. 2012).
Magnetic resonance imaging (MRI) is another option with the potential to measure local lung ventilation/function and new developments in parallel imaging, shared echo techniques, and rotating phase encoding are making the method more viable (Puderbach et al. 2007). However the technique has significant problems with signal to noise due to the low proton densities in the lungs, susceptibility artifacts, the inherent qualitative nature of the imaging itself, and the inability to do lung assessments at clinical care sites such as in ICUs (Puderbach et al. 2007).
The best present option for a monitoring technique for local pulmonary function/disease is electrical impedance tomography (EIT). EIT reconstructs local estimates of pulmonary impedance, which correlate to the degree of local aeration of lung. However, EIT has several limitations: 1) it is restricted to one transverse plane through the chest, 2) it would be a difficult monitoring mode since the chest needs to be wrapped in detectors for a measurement, 3) presently the impedance estimates do not seem to correlate with CT lung density, and 4) the results are qualitative, so only relative changes can be evaluated (Victorino et al. 2004).
There is now a great deal of interest in ultrasound imaging for evaluating lung disease. Many papers showing the utility of ultrasonography in diagnosing and assessing various pulmonary and intrathoracic diseases have been published (Dietrich et al. 2003). Besides standard applications such as localization of pleural effusions, physicians are now using ultrasound to identify and characterize such conditions as pulmonary edema, pulmonary fibrosis, and pneumonias (Mathis et al. 1992; Lichtenstein et al. 2004; Agricola et al. 2005; Tardella et al. 2012). These evaluations have almost all been based on characterization of artifacts that likely occur between the pleura and lung surface. These typically manifest as linear artifacts that project from the lung surface into what would be gas-filled lung. The assessment of the underlying conditions based on the number and quality of these artifacts is qualitative or semi-quantitative at best, and none of them assess any component of lung physiology or mechanics (Soldati et al. 2011).
There is now evidence that local lung strain can be estimated by ultrasound. Measuring lung strain could provide a method of monitoring local lung ventilation changes that produce these strains. In a recent publication, we demonstrated that we could track the motion of the lung surface using ultrasound two-dimensional speckle tracking (Rubin et al. 2012). The purpose of this tracking was to estimate tissue displacements for guiding radiation therapy treatments of tumors, and as such we also tracked the motion of normal liver, a liver with an hepatocellular carcinoma, and prostate motion that we artificially induced by moving the transducer. In this publication, we use the displacement estimates on the lung surface to calculate the local strains produced by the expansion and contraction of the lung during breathing in human volunteers and in a murine model of acute lung injury and pulmonary fibrosis. As one would expect during inspiration, the strain increases and during expiration the strain decreases. This measurement could lead to an entirely new application of ultrasound to pulmonary disease
Materials and Methods
Mouse scans
To assess ultrasound strain measurement’s ability to evaluate pulmonary function, we targeted a mouse model of pulmonary fibrosis for analysis.
Fourteen C57BL/6 mice were included in the experiment. The mice were weight and age-matched (18–22 grams at 6–8 weeks of age). In order to produce pulmonary fibrosis, six mice were intratracheally administered bleomycin (1.2 u/kg in 50 μL of sterile phosphate buffered saline) as previously described (Courey et al. 2011). Eight control mice were injected for the same duration with 50 μL of phosphate-buffered saline alone. The scans were performed 21 days after the injections to insure sufficient time for pulmonary fibrosis to develop in the bleomycin injected mice. All protocols used in this study were approved by the University of Michigan Unit for Laboratory Animal Medicine.
The mice were scanned in the prone position. The hair was removed from bilateral chest walls. The animals were anesthetized with xylazine (5–10 mg/kg injected intraperitoneally) and ketamine (80–120 mg/kg injected intraperitoneally). We imaged the lungs with a commercially available ultrasound scanner (Vevo 2100, FujiFilm VisualSonics, Toronto, Canada) using 55 MHz linear array. The transducer was held in position against each mouse’s chest using a restraining device provided by the manufacturer. B-mode cine loops of respiratory motion were captured in transverse and sagittal orientation, although only the sagittal motions were evaluated in this study. Data was stored in either Digital Imaging and Communications in Medicine (DICOM) format or radiofrequency (RF) format. RF data were subsequently converted into B-mode gray scale loops for tracking. The loops were on the order of 0.5 – 1 second long and were sampled at around 300 – 400 frames per second depending on parameters such as image depth, image width, and beam density.
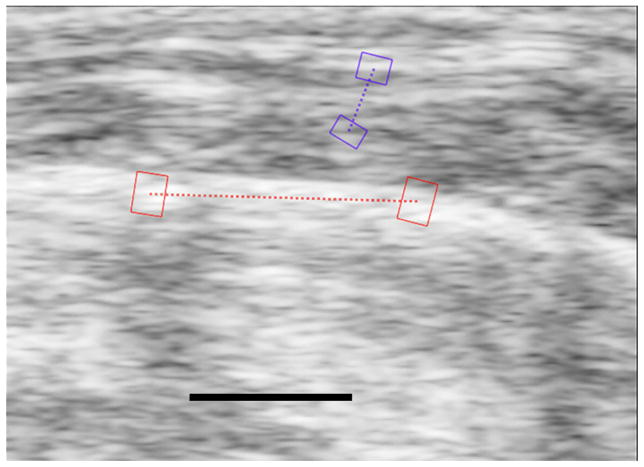
The imaging loops were then transferred to a work station where commercially available speckle tracking software (EchoInsight, Epsilon Imaging, Ann Arbor, MI) was used for analysis. The loops were evaluated interactively where a region of interest (ROI) pair (i.e. two connected ROIs) was placed along the moving lung surface which was easy to identify based on its motion on the real-time loops (Fig. 1). ROI motion was tracked in 2D (laterally and axially). Tissue displacements were estimated based on the regional 2D cross- correlation of the gray scale signal between frames. The lung surface strain was primarily determined by lateral motion due to acquisition geometry, which is orthogonal to the standard axial strains measured in most one-dimensional applications (Ophir et al. 1991).
Figure 1.
Figure 1a. Sagittal image of the right lung of a control mouse showing how a strain estimate is made. The highly echogenic lung surface is visible here with two red regions of interest (ROIs) connected by a dotted red line running along the lung surface. The lung surface strains are measured between these two ROIs. The area of the lung parenchyma lies below the dotted red line on the image, and it is filled with noise. The black line at the bottom of the image represents 1 mm and is located in what would be the lung parenchyma if the sound were able to penetrate into the lung. The two purple ROIs are in the superficial soft-tissues and are used for reference for the breaths.
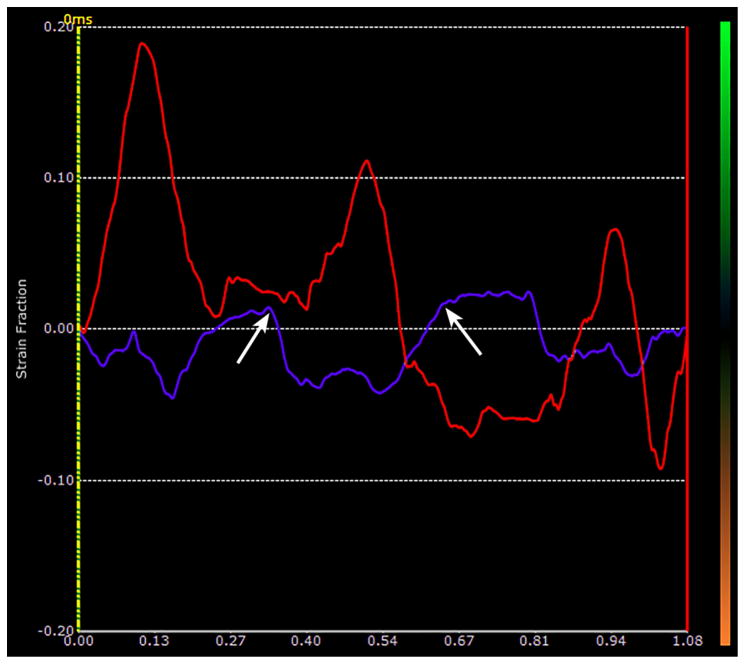
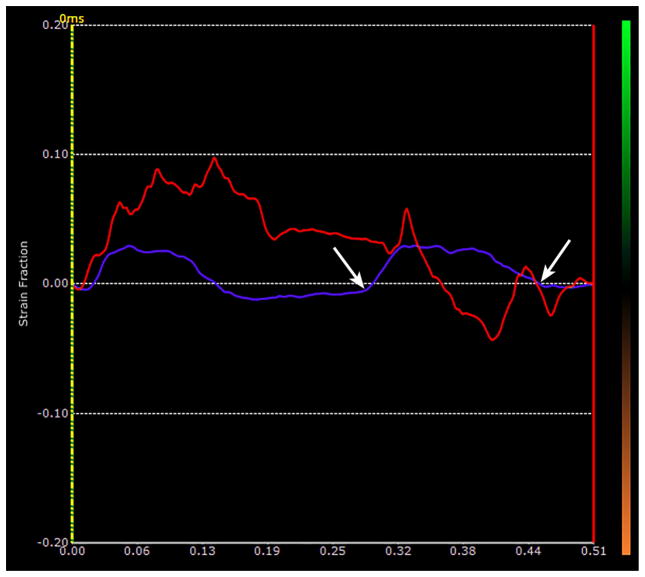
Figure 1b. Plot of the time-dependent strain made at the lung surface ROI in Fig 1a over a period of 1.08 sec. The red curve shows the instantaneous strain estimates of the lung surface segment shown in Fig 1a. There were 3 breaths taken during this period. The purple curve corresponds to the simultaneous strains in the superficial soft-tissues. The two arrows mark the extent of one breath as represented in the soft-tissues, and are used to mark the limits of the breath along the lung surface. Notice that there is definite drifting in the lung surface trace with a marked downward trend from the first breath to the last.
Fig. 1c. This figure shows the effect of removing the strain drift demonstrated in Fig. 1b for a given breath. The selected breath is defined by the same limits shown in the soft-tissue in Fig. 1b (white arrows). Using the strain-drift removal function in EchoInsight, the limits of the breath are now confined between the vertical yellow line on the left and the vertical red line on the right. The points of intersection of the two traces, i.e. the red trace for the lung surface and the purple trace for the soft tissue, with these vertical lines are displaced down to the baseline (white arrows). The beginning and end of this breath are now along the baseline (zero strain line) thus removing the drift. The strain for that breath is now the maximum value between the vertical lines (yellow arrow) minus the minimum value (which is zero in this case) corresponds to about 12.5%. A correction of this type is made for each breath to remove the drifting effects on the measurement. Also note that in this case, the soft tissue is out of phase with the lung surface (i.e. the lung surface is positive when the soft tissue is negative.) This varies depending on the location and orientation of the ROIs in the soft tissue. However, by looking at the real time loops and the motion of the soft tissue, it was easy to tell when the breaths were being taken.
Strain was defined as the Lagrangian strain estimated from two user defined regions of interest selected on the lung surface. Strain = (Lf – Li)/Li, where Lf is the time varying distance between the centers of the ROI pair, and Li is the initial distance between the centers of the ROI pair. The continually changing strain values over time represent the breathing cycle of expansion and contraction of the underlying lung (Figs 1 & 2). This definition is very similar to what is used for estimating deformations in cardiac echosonography (Gorcsan and Tanaka 2011). The instantaneous Lagrangian strain was plotted as a function of time. (Figs. 1b & 2b).
Figure 2.
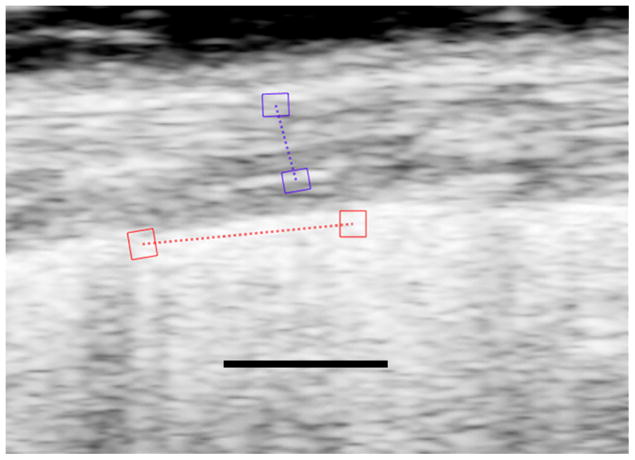
Fig 2a. Image of the lung of bleomycin treated mouse with pulmonary fibrosis. As in Fig. 1, the red ROIs lie on the lung surface and the purple ROIs lie in the hypoechoic superficial soft tissues. The strains are measured along the dotted lines between the respective ROIs. The black line represents 1 mm and is located in what would be lung parenchyma if the sound were able to penetrate into the lung.
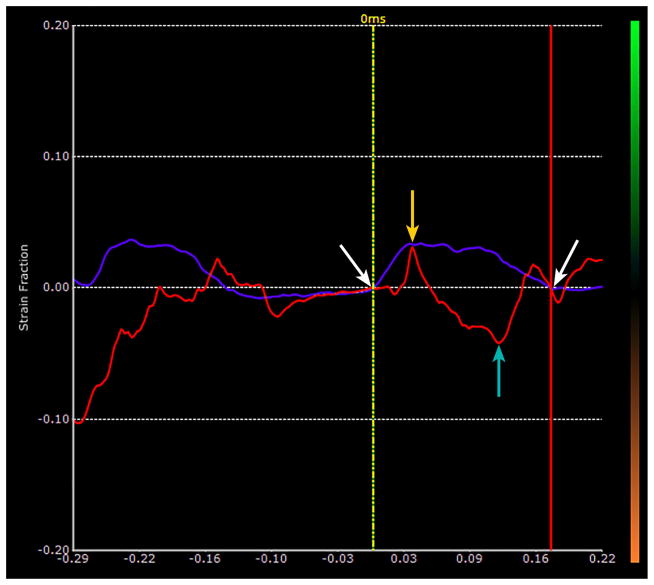
Fig 2b. Plot of time dependent strain of the lung surface in the bleomycin treated mouse shown in Fig. 2a. The red plot represents the strain along the lung surface and the purple represents the strain in the superficial soft tissue. The white arrows represent the limits of the second breath in this sequence. Notice that the lung surface strain has largely drifted off the base line, and the breaths are very hard to identify from the lung surface strain plot.
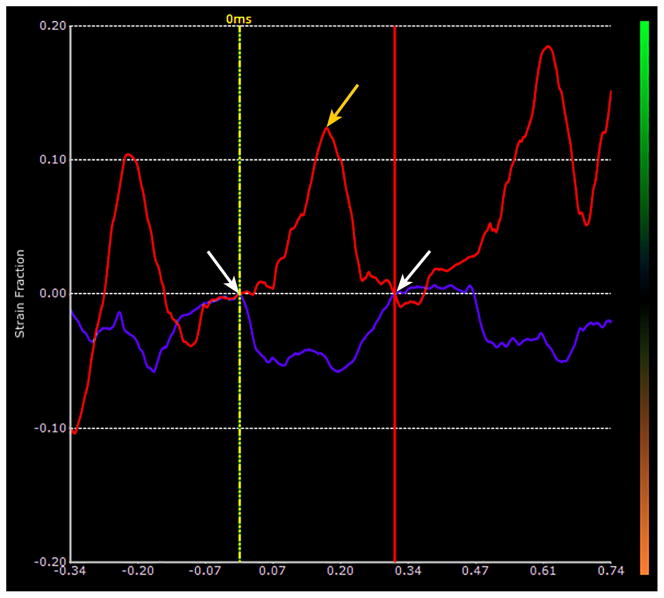
Fig. 2c. Same plot as that shown in Fig 2b that has been strain drift corrected for the second breath. The two vertical lines are drawn to intersect the beginning and end of the second breath as defined by the soft tissue strain. The limits are the same as shown in Fig 2b and are marked with white arrows. Points of intersection with the vertical lines are translated down to the baseline, i.e. zero strain, as marked by the white arrows. The strain in the breath is now defined as the difference between the peak strain, orange arrow, minus the minimum strain, turquoise arrow which corresponds to about 7.0%.
Human scans
The human scans were performed for purposes of demonstration (Fig. 3), and the imaging was performed under a University of Michigan Institutional Review Board- approved prospective study. Two normal volunteers gave written informed consent to have their lungs scanned. For the purposes of demonstration, the human lung data was captured and tracked in rf (although this detail does not appear to be necessary based on the mouse analyses described above) Lung surface motion RF signals were captured at 105 frames per second using a clinical ultrasound scanner (Epsilon Imaging, Ann Arbor, MI). A 6.0 MHz linear array was used to acquire the images. The recorded lung surface motion was tracked using software specially designed for tracking heart motion in cardiac echo examinations (EchoInsight, Epsilon Imaging, Ann Arbor, MI). We tracked the rf signals using a previously described complex (real and imaginary numbers) cross-correlation algorithm (Lubinski et al. 1999). The RF sampling rate was 20 MHz at a frame rate of 105 Hz. The scans were performed intercostally making the image orientations dependent on the angles of the intercostal spaces relative to the cephalocaudal directions. We then rotated the probe orthogonally relative to this position so that we were scanning across the ribs. The selected ROIs for the lung surface was 2 × 5 mm.
Figure 3.
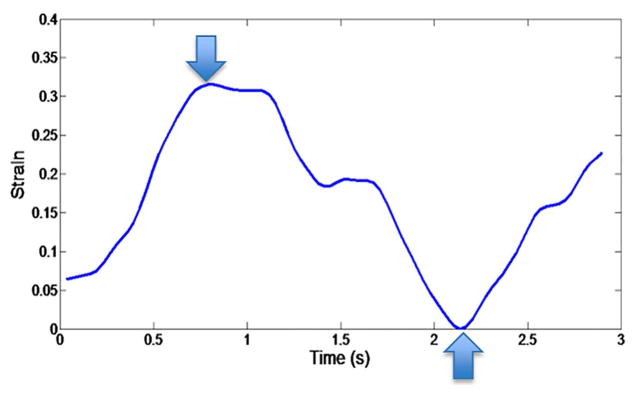
Strain trace from the right lung of human volunteer. The trace encompasses one breath, and the maximum-to-minimum strain difference is approximately 33.6%. The downward arrow indicates the maximum strain and the upward arrow indicates the minimum strain. Again, the difference between the two measurements represents the strain for the given breath.
Signals were temporally high-passed filtered to potentially reduce the large static signals caused by specular reflections from the lung surface. It was observed that the specular reflections and stationary artifacts were stronger in human data compared to mouse data, perhaps due to the reduced acoustic scattering associated with the lower imaging frequency allowing for higher amplitude specular reflections. Given that the human data was rf captured, a 3-point Hanning high-pass finite impulse response (FIR) filter with coefficients (−0.25, 0.5, and −0.25) was used.
Analysis of mouse data
We performed statistical analyses on the mouse scans. There were 8 control mice and 6 mice with lung fibrosis induced by intratracheal instillation of bleomycin. We acquired at least 8 longitudinal loops of the measured lungs during respiration for each mouse, and there could be from one to five breaths in each loop.
For this analysis, we combined the strain estimates from the left and right lungs to produce one strain estimate for each mouse. Along with the lung tracking, we tracked the strain in the soft-tissue overlying the lung to define when breaths were being taken (defined as purple ROI pairs in Fig. 1 & 2). This was necessary, since in the mice with severe pulmonary fibrosis, the breaths were erratic. The onsets and terminations of each breath were difficult to define. Because of the erratic breathing, and the fact that we were not ventilating these mice, we needed a reference trace to define the boundaries of each breath. We used the time dependent strain estimates from the motion in the overlying soft tissues to accomplish this (Fig. 1 & 2).
During the analysis process, we used the strain drift function in EchoInsight to “pull each breath” down to baseline (Figs 1c & 2c), forcing the strain at the start and end of each breath to be equal. This compensated for any local drifting from the baseline of the strain trace which could influence the strain measurement. Each breath was defined by the strain changes in the overlying soft-tissues. Once the trace for each breath was strain drift corrected, we took the difference between the maximum strain value and the minimum strain value as the strain for that breath as illustrated in Figs. 1c & 2c. We did this maneuver for every breath for both lungs. We then combined the longitudinal strain values measured in each animal and calculated an overall mean for all of the longitudinal measurements for each mouse in each group, i.e. controls and bleomycin. Thus each mouse provided only one mean strain estimate. After the experiment was completed, the mice were sacrificed, and lung fibrosis was assessed by quantification of hydroxyproline as previously described (Sisson et al. 2010).
Each mouse was considered an independent measurement for both strain and hydroxyproline measurements. The mean values for each group of strains and hydroxyproline assay were compared using a two-tailed t-test (Microsoft Excel, Redmond, WA). p<0.05 is considered significant.
Results
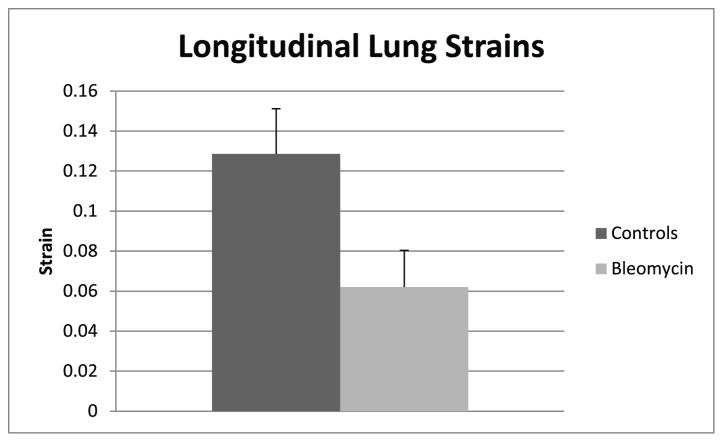
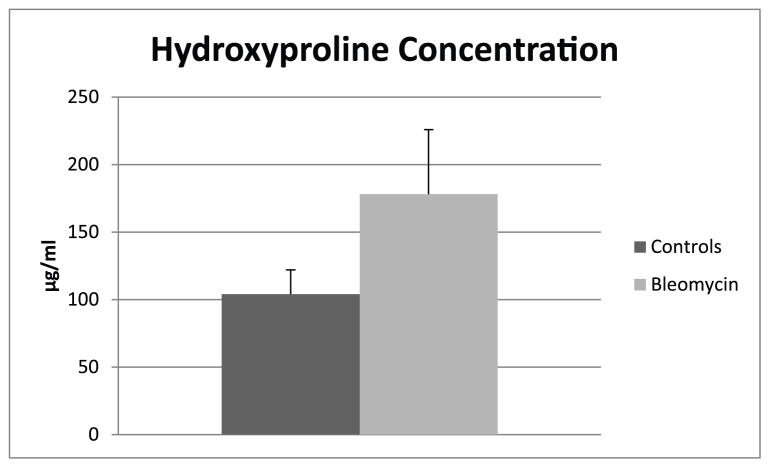
The means and standard deviations of the strains and the means and standard deviations for the hydroxyproline assays for the two groups are shown in Fig 4 and Fig 5. The difference between strains in the controls and the bleomycin treated lungs was significant (p < .0001). (Fig. 4). The difference between the hydroxyproline concentrations between controls and the bleomycin treated mice was also significant (p<0.02) (Fig. 5).
Figure 4.
Mean longitudinal lung strains and standard deviations in control mice and mice with pulmonary fibrosis. The strain difference between the control mice and mice with pulmonary fibrosis was significant (p < .0001).
Figure 5.
Means and standard deviations of hydroxyproline concentrations (ug/ml) in control mice and mice with pulmonary fibrosis. The hydroxyproline concentration difference between the control mice and mice with pulmonary fibrosis was significant (p < .02).
An example of a strain estimate from a human volunteer is shown in Fig 3. The human measurements are similar to linear strain values obtain using MRI in a previous study (Napadow et al. 2001).
Discussion
Ultrasound scanning of the lung has been receiving increased interest recently. Besides well-known applications such as pleural effusion assessments, lung scanning has been used to assess pulmonary edema, pneumonias, and there are some ultrasound findings related to pulmonary fibrosis (Mathis et al. 1992; Lichtenstein et al. 2004; Agricola et al. 2005; Tardella et al. 2012). All of the criteria used in these assessments are likely multiple reflection artifacts. They can be generated between any number of different surfaces such as the lung and pleura or within fluid-filled fissures in the lungs. The appearance of the artifacts, which have been referred to as A-lines, B-lines, and comets, (Picano et al. 2006; Lichtenstein 2009) is typically a ray of relatively high intensity projecting along a beam path. Similar things are often seen elsewhere in the body projecting behind gas-filled objects (Hindi et al. 2013).
Being artifacts, these objects are quite unstable, and their number and intensities can vary with the positions of the ultrasound scanhead relative to the target tissue. This variability and the fact that artifacts are the critical finding, makes quantifying these objects very difficult (Soldati et al. 2011). Therefore, scans of the lungs, whose findings are based on artifacts, are inherently qualitative or semi-quantitative. The non-quantitative nature of these scans still does not belie the fact that lung ultrasound scans have still found a useful niche in the imaging armamentarium.
Yet, it would be valuable to be able to make quantitative measurements of lung function using ultrasound. We have shown that quantitative measurements of lung displacements can be made by tracking the motion of the lung surface (Rubin et al. 2012). In this paper, we have preliminarily taken the next step by showing it is possible to represent local respiration using lung strain measurements in a human volunteer, and we have shown that changes in lung strain can be identified in a relevant murine model of lung fibrosis.
The ability to non-invasively make such measurements in real-time would have many potential applications. including the evaluation and management of patients with ARDS and lung fibrosis, diseases in which all current applications used to measure local lung structure and function are either very difficult and hence impractical to perform, (CT and MRI), qualitative (MRI and EIT), or subject to substantial variation (pulmonary function studies) (Hruby and Butler 1975; Keogh and Crystal 1980; Puderbach et al. 2007; Galban et al. 2012). Ultrasound strain estimates of local lung ventilation could overcome these difficulties and allow for the non-invasive real-time assessment of lung mechanics.
There are several limitations in this study; the largest being the small subject numbers. This was a pilot study, and numbers are small. Yet the strain differences between normal and fibrotic mouse lungs were large enough for them to be significant, and the strains correlate with the degree of lung injury-induced fibrosis based on the hydroxyproline assay. We are already embarking on larger studies to confirm these results. Second, we were measuring and evaluating global changes in ventilation where the ultimate application of strain models will be applied and evaluated for local pulmonary ventilation, since methods for evaluating global lung ventilation exist and are in clinical use. Unfortunately, this is very difficult to do in mice largely because of their small size. Bleomycin is injected directly into the trachea through a small tracheotomy. Injections into specific bronchi would be technically very challenging since that would require opening the chest cavity. Thus, another non-mouse animal model of pulmonary injury would be required for assessing strain’s ability to assess local ventilation. We are in the process of investigating such an animal model. However, for a preliminary study such as this, we believe that the global comparisons provided here suggest that further investigation is justified.
Third, as discussed above, strain drift is a major issue in tracking the lung surface. This should not be a surprise, since the lung surface is a very noisy boundary. Because of this, anything that can cause tracking to not match true motion is a potential culprit for causing strain drift. These include noisy data, image artifacts (e.g., stationary echoes, such as shadowing ribs, combined with motion from the lung surface) and out of plane motion, which definitely occurs given that the lung surface is expanding and contracting like the surface of a balloon. We, at least, partially compensated for this as described in the methods, but further work characterizing lung surface motion will be necessary to make the method more robust.
Finally, we only analyzed longitudinal strains in the mice. The radius of curvature of the lungs in the transverse orientation was small relative to the longitudinal direction. This led to ROIs that extended along cords that crossed behind the lung surface. These would represent incorrect surface strain estimates. In order to overcome this, we will have to develop quantitative strain estimates that measure small increments along curved surfaces.
Yet, as mentioned above, the lung surface area is stretching and contracting, so the true strain is really an area strain. Such strains would lead to decorrelation whenever one-dimensional (1D) tracking is employed since any speckle component moving perpendicular to the tracking direction cannot be tracked. This problem can be corrected with a two-dimensional (2D) transducer where the area strain or direction of the maximum 1D deformation can be determined. However, the strain estimates in the longitudinal direction seemed to suffice for this preliminary work.
Conclusion
In conclusion, we have shown that ultrasound strain imaging can potentially represent local changes in lung ventilation in real-time. There is evidence that the method can detect differences in normal and fibrotic lungs in a mouse model. We have also been able to make the measurement in human subjects. Further, study is needed to determine if ultrasound strain estimates can become a viable measure of local lung ventilation.
Acknowledgments
This work was supported in part by the following grants: NIH/NHLBI HL105489 (J.C.H.), HL078871 (T.H.S.), Michigan Center for Integrative Research in Critical Care (J.M.R.), University of Michigan Translational Research and Commercialization for Life Sciences Program (U-M MTRAC) (J.M.R.)
Footnotes
Publisher's Disclaimer: This is a PDF file of an unedited manuscript that has been accepted for publication. As a service to our customers we are providing this early version of the manuscript. The manuscript will undergo copyediting, typesetting, and review of the resulting proof before it is published in its final citable form. Please note that during the production process errors may be discovered which could affect the content, and all legal disclaimers that apply to the journal pertain.
Contributor Information
Jonathan M. Rubin, University of Michigan
Jeffrey C. Horowitz, University of Michigan
Thomas H Sisson, University of Michigan
Kang Kim, University of Pittsburgh
Luis A. Ortiz, University of Pittsburgh
James D. Hamilton, Epsilon Imaging Inc
References
- Agricola E, Bove T, Oppizzi M, Marino G, Zangrillo A, Margonato A, Picano E. “Ultrasound comet-tail images”: a marker of pulmonary edema: a comparative study with wedge pressure and extravascular lung water. Chest. 2005;127:1690–1695. doi: 10.1378/chest.127.5.1690. [DOI] [PubMed] [Google Scholar]
- Courey AJ, Horowitz JC, Kim KK, Koh TJ, Novak ML, Subbotina N, Warnock M, Xue B, Cunningham AK, Lin Y, Goldklang MP, Simon RH, Lawrence DA, Sisson TH. The vitronectin-binding function of PAI-1 exacerbates lung fibrosis in mice. Blood. 2011;118:2313–2321. doi: 10.1182/blood-2010-12-324574. [DOI] [PMC free article] [PubMed] [Google Scholar]
- Dietrich CF, Hirche TO, Schreiber DG, Wagner TOF. Ultrasonography of pleura and lung. Ultrashall in der Medizin. 2003;24:303–311. doi: 10.1055/s-2003-42912. [DOI] [PubMed] [Google Scholar]
- Galban CJ, Meilan KH, Boes JL, Chughtai KA, Meyer CR, Johnson TD, Galban S, Rehemtulla A, Kazerooni EA, Martinez FJ, Ross BD. CT-based biomarker provides unique signature for diagnosis of COPD phenotypes and disease progression. Nature Med. 2012 Nov;18(11):1711–1715. doi: 10.1038/nm.2971. [DOI] [PMC free article] [PubMed] [Google Scholar]
- Gorcsan J, 3rd, Tanaka H. Echocardiographic assessment of myocardial strain. J Am Coll Cardiol. 2011;58:1401–1413. doi: 10.1016/j.jacc.2011.06.038. [DOI] [PubMed] [Google Scholar]
- Hindi A, Peterson C, Barr RG. Artifacts in diagnostic ultrasound. Reports in Medical Imaging. 2013;6:29–48. [Google Scholar]
- Hruby J, Butler J. Variability of routine pulmonary function tests. Thorax. 1975;30:548–553. doi: 10.1136/thx.30.5.548. [DOI] [PMC free article] [PubMed] [Google Scholar]
- Keogh BA, Crystal RG. Clinical significance of pulmonary function tests. Pulmonary function testing in interstitial pulmonary disease. What does it tell us? Chest. 1980;78:856–865. doi: 10.1378/chest.78.6.856. [DOI] [PubMed] [Google Scholar]
- King TE, Jr, Albera C, Bradford WZ, Costabel U, du Bois RM, Leff JA, Nathan SD, Sahn SA, Valeyre D, Noble PW. All-cause mortality rate in patients with idiopathic pulmonary fibrosis. Implications for the design and execution of clinical trials. Am J Respir Crit Care Med. 2014;189:825–831. doi: 10.1164/rccm.201311-1951OC. [DOI] [PubMed] [Google Scholar]
- Lichtenstein DA. Ultrasound examination of the lungs in the intensive care unit. Pediatr Crit Care Med. 2009;10:693–698. doi: 10.1097/PCC.0b013e3181b7f637. [DOI] [PubMed] [Google Scholar]
- Lichtenstein DA, Lascols N, Meziere G, Gepner A. Ultrasound diagnosis of alveolar consolidation in the critically ill. Intensive Care Med. 2004;30:276–281. doi: 10.1007/s00134-003-2075-6. [DOI] [PubMed] [Google Scholar]
- Lubinski MA, Emelianov SV, O’Donnell M. Speckle tracking methods for ultrasounic elasticity imaging using short time correlation. IEEE Transactions on Ultrasonics, Ferroelectrics, and Frequency Control. 1999;46:82–96. doi: 10.1109/58.741427. [DOI] [PubMed] [Google Scholar]
- Lynch DA, Godwin JD, Safrin S, Starko KM, Hormel P, Brown KK, Raghu G, King TE, Jr, Bradford WZ, Schwartz DA, Richard Webb W Idiopathic Pulmonary Fibrosis Study G. High-resolution computed tomography in idiopathic pulmonary fibrosis: diagnosis and prognosis. Am J Respir Crit Care Med. 2005;172:488–493. doi: 10.1164/rccm.200412-1756OC. [DOI] [PubMed] [Google Scholar]
- Mathis G, Metzler J, Fussenegger D, Feurstein M, Sutterlutti G. Ultrasound findings in pneumonia. Ultraschall Klin Prax. 1992;7:45–49. [Google Scholar]
- Napadow VJ, Mai V, Bankier A, Gilbert RJ, Edelman R, Chen Q. Determination of regional pulmonary parenchymal strain during normal respiration using spin inversion tagged magnetization MRI. J Magn Reson Imaging. 2001;13:467–474. doi: 10.1002/jmri.1068. [DOI] [PubMed] [Google Scholar]
- Oldham JM, Noth I. Idiopathic pulmonary fibrosis: early detection and referral. Respiratory medicine. 2014;108:819–829. doi: 10.1016/j.rmed.2014.03.008. [DOI] [PMC free article] [PubMed] [Google Scholar]
- Ophir J, Cespedes EI, Ponnekanti H, Yazdi Y, Li X. Elastography: a quantitative method for imaging the elasticity of biological tissues. Ultrasonic Imaging. 1991;13:111–134. doi: 10.1177/016173469101300201. [DOI] [PubMed] [Google Scholar]
- Picano E, Frassi F, Agricola E, Gligorova S, Gargani L, Mottola G. Ultrasound lung comets: a clinically useful sign of extravascular lung water. J Am Soc Echocardiogr. 2006;19:356–363. doi: 10.1016/j.echo.2005.05.019. [DOI] [PubMed] [Google Scholar]
- Puderbach M, Hintze C, Ley S, Eichinger M, Kauczor HU, Biederer J. MR imaging of the chest: a practical approach at 1.5T. Eur J Radiol. 2007;64:345–355. doi: 10.1016/j.ejrad.2007.08.009. [DOI] [PubMed] [Google Scholar]
- Raghu G, Collard HR, Anstrom KJ, Flaherty KR, Fleming TR, King TE, Jr, Martinez FJ, Brown KK. Idiopathic pulmonary fibrosis: clinically meaningful primary endpoints in phase 3 clinical trials. Am J Respir Crit Care Med. 2012;185:1044–1048. doi: 10.1164/rccm.201201-0006PP. [DOI] [PMC free article] [PubMed] [Google Scholar]
- Raghu G, Collard HR, Egan JJ, Martinez FJ, Behr J, Brown KK, Colby TV, Cordier JF, Flaherty KR, Lasky JA, Lynch DA, Ryu JH, Swigris JJ, Wells AU, Ancochea J, Bouros D, Carvalho C, Costabel U, Ebina M, Hansell DM, Johkoh T, Kim DS, King TE, Jr, Kondoh Y, Myers J, Muller NL, Nicholson AG, Richeldi L, Selman M, Dudden RF, Griss BS, Protzko SL, Schunemann HJ Fibrosis AEJACoIP. An official ATS/ERS/JRS/ALAT statement: idiopathic pulmonary fibrosis: evidence-based guidelines for diagnosis and management. Am J Respir Crit Care Med. 2011;183:788–824. doi: 10.1164/rccm.2009-040GL. [DOI] [PMC free article] [PubMed] [Google Scholar]
- Rubin JM, Feng M, Hadley SW, Fowlkes JB, Hamilton JD. Potential use of ultrasound speckle tracking for motion management during radiotherapy: preliminary report. J Ultrasound Med. 2012;31:469–481. doi: 10.7863/jum.2012.31.3.469. [DOI] [PubMed] [Google Scholar]
- Sisson TH, Mendez M, Choi K, Subbotina N, Courey A, Cunningham A, Dave A, Engelhardt JF, Liu X, White ES, Thannickal VJ, Moore BB, Christensen PJ, Simon RH. Targeted injury of type II alveolar epithelial cells induces pulmonary fibrosis. Am J Respir Crit Care Med. 2010;181:254–263. doi: 10.1164/rccm.200810-1615OC. [DOI] [PMC free article] [PubMed] [Google Scholar]
- Soldati G, Copetti R, Sher S. Can lung comets be counted as “objects”? JACC Cardiovascular imaging. 2011;4:438–439. doi: 10.1016/j.jcmg.2010.09.025. [DOI] [PubMed] [Google Scholar]
- Tardella M, Gutierrez M, Salaffi F, Carotti M, Ariani A, Bertolazzi C, Filippucci E, Grassi W. Ultrasound in the assessment of pulmonary fibrosis in connective tissue disorders: correlation with high-resolution computed tomography. The Journal of rheumatology. 2012;39:1641–1647. doi: 10.3899/jrheum.120104. [DOI] [PubMed] [Google Scholar]
- Thille AW, Esteban A, Fernandez-Segoviano P, Rodriguez JM, Aramburu JA, Penuelas O, Cortes-Puch I, Cardinal-Fernandez P, Lorente JA, Frutos-Vivar F. Comparison of the Berlin definition for acute respiratory distress syndrome with autopsy. Am J Respir Crit Care Med. 2013;187:761–767. doi: 10.1164/rccm.201211-1981OC. [DOI] [PubMed] [Google Scholar]
- Victorino JA, Borges JB, Okamoto VN, Matos GF, Tucci MR, Caramez MP, Tanaka H, Sipmann FS, Santos DC, Barbas CS, Carvalho CR, Amato MB. Imbalances in regional lung ventilation: a validation study on electrical impedance tomography. Am J Respir Crit Care Med. 2004;169:791–800. doi: 10.1164/rccm.200301-133OC. [DOI] [PubMed] [Google Scholar]


