Abstract
Objective
Megalencephalic leukoencephalopathy with cysts (MLC) is a genetic infantile‐onset disease characterized by macrocephaly and white matter edema due to loss of MLC1 function. Recessive mutations in either MLC1 or GLIALCAM cause the disease. MLC1 is involved in astrocytic volume regulation; GlialCAM ensures the correct membrane localization of MLC1. Their exact role in brain ion‐water homeostasis is only partly defined. We characterized Glialcam‐null mice for further studies.
Methods
We investigated the consequences of loss of GlialCAM in Glialcam‐null mice and compared GlialCAM developmental expression in mice and men.
Results
Glialcam‐null mice had early‐onset megalencephaly and increased brain water content. From 3 weeks, astrocytes were abnormal with swollen processes abutting blood vessels. Concomitantly, progressive white matter vacuolization developed due to intramyelinic edema. Glialcam‐null astrocytes showed abolished expression of MLC1, reduced expression of the chloride channel ClC‐2 and increased expression and redistribution of the water channel aquaporin4. Expression of other MLC1‐interacting proteins and the volume regulated anion channel LRRC8A was unchanged. In mice, GlialCAM expression increased until 3 weeks and then stabilized. In humans, GlialCAM expression was highest in the first 3 years to then decrease and stabilize from approximately 5 years.
Interpretation
Glialcam‐null mice replicate the early stages of the human disease with early‐onset intramyelinic edema. The earliest change is astrocytic swelling, further substantiating that a defect in astrocytic volume regulation is the primary cellular defect in MLC. GlialCAM expression affects expression of MLC1, ClC‐2 and aquaporin4, indicating that abnormal interplay between these proteins is a disease mechanism in megalencephalic leukoencephalopathy with cysts.
Introduction
Megalencephalic leukoencephalopathy with subcortical cysts (MLC; MIM 604004) is an autosomal recessive disorder with onset in infancy.1, 2 Patients present soon after birth with increasing macrocephaly that stabilizes after the first year.1 Magnetic resonance imaging (MRI) shows signal abnormality and swelling of the cerebral white matter.1 Subcortical cysts develop in the anterior temporal and variably in the frontal and parietal regions. Diffusion‐weighted imaging indicates highly increased size of white matter water spaces.3 After several years, patients with MLC develop slowly progressive cerebellar ataxia and spasticity.1, 4 Slow and mild cognitive decline ensues over the years. Almost all patients have occasional epileptic seizures and status epilepticus may occur. Follow‐up MRI studies show that over time the cerebral white matter becomes less swollen and eventually atrophic. Brain biopsies reveal countless small fluid‐filled vacuoles within myelin sheaths; vacuoles are also found in astrocytic endfeet abutting capillaries.5, 6, 7, 8, 9, 10
MLC is caused by mutations in the MLC1 or GLIALCAM gene.11, 12 GlialCAM is a protein chaperone ensuring the correct membrane localization of MLC1.13 Recessive mutations in both genes cause loss of MLC1 function and an indistinguishable clinical phenotype.12, 14 Dominant, heterozygous GLIALCAM mutations initially lead to the same disease, but improvement occurs afterward and the white matter abnormalities largely disappear.12, 14
In the human and mouse brain, MLC1 is exclusively expressed in cells of astroglial lineage. MLC1 expression is enriched in astrocytic processes contacting capillaries and meninges and in cerebellar Bergmann glia.15, 16, 17, 18 GlialCAM shows a similar expression pattern, and is also expressed in oligodendrocytes.17, 19 Immunogold electron microscopy shows that GlialCAM and MLC1 co‐localize in astrocyte–astrocyte junctions at astrocytic endfeet.13 Both MLC1 and GlialCAM are associated with caveolae, which are important in compartmentalization of components involved in signal transduction, transport functions, endocytosis, and transcytosis.20, 21, 22, 23
Depletion of MLC1 in astrocytes reduces volume‐regulated anion channel currents (VRAC) and slows regulatory volume decrease after cell swelling.18, 24 Similarly, reduced GlialCAM expression results in defective VRAC activation and augmented vacuolization, phenocopying the consequences of MLC1 mutations.25 These findings strongly support a role for MLC1 and GlialCAM in maintaining brain ion–water homeostasis.
Brain tissue of MLC patients is extremely scarce for MLC1 mutations and unavailable for GLIALCAM mutations. Therefore, MLC mouse models are invaluable for studying the cellular pathophysiology of this disease. Mouse models of MLC have been generated that are deficient in either MLC1 or GlialCAM.18, 19, 26 We have previously developed and phenotyped Mlc1‐null mice, which are a valid model of the human disease.18 Here, we phenotype a Glialcam‐null mouse model19 and show that this model also recapitulates important characteristics of MLC. Additionally, we investigate GlialCAM temporal expression in mice and humans.
Materials and Methods
Mutant mouse generation
The Glialcam mutants were generously provided by Favre‐Kontula et al.19 Briefly, the genomic sequence of Glialcam was replaced by a cassette containing the coding sequence of β‐galactosidase (lac‐Z) and Lox flanked neomycin gene driven by a mammalian promoter (Fig. 1A).19 Homozygous Glialcam‐LacZ mice are referred to as “Glialcam‐null mice”. Mlc1‐null mice were employed for comparison in selected experiments.18
Figure 1.
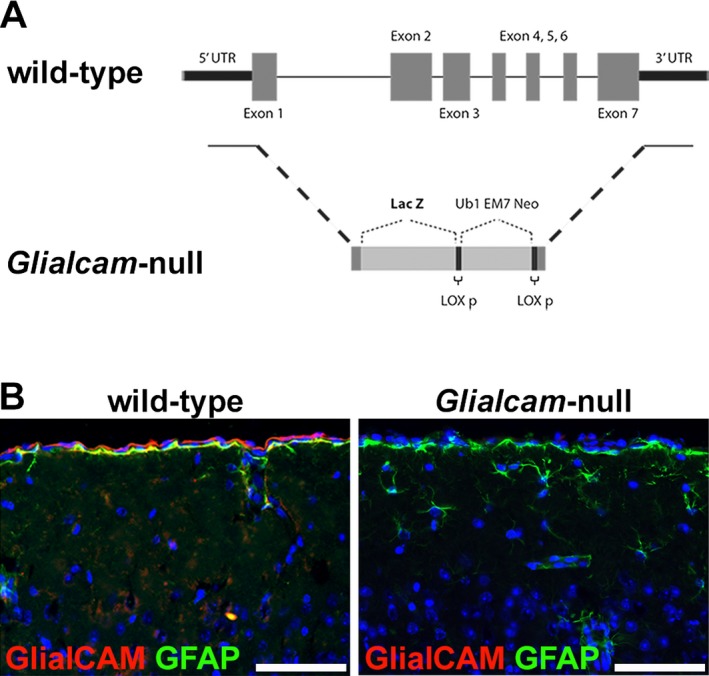
Generation of the Glialcam‐null mice. (A) Molecular construct of the Glialcam‐null mouse. (B) Immunofluorescence staining for GlialCAM (red) and glial fibrillary acidic protein (GFAP) (green) of the cerebral cortex of 8‐month‐old mice shows that Glialcam‐null mice express no GlialCAM, whereas wild‐type animals express the protein normally. In all pictures, nuclei are stained with 4′ #bib6‐diamidino‐2‐phenylindole (DAPI) (blue). Bars = 50 μm.
Genotyping for routine maintenance was performed by PCR (Table S1). Table S2 reports the number and ages of the animals employed for each experiment. All experiments were approved by the Animals Ethical Committee of VU University in Amsterdam, in accordance with Dutch law.
Brain wet and dry weight
Brain water content was measured according to the wet/dry mass method.27 Mice were sacrificed via cervical dislocation. Brains were homogenized in premassed 1.5 mL vials. Vials were massed and wet brain weight was calculated from the difference. Samples were dried in a vacuum centrifuge for 24 h at 40°C and subsequently remassed to deliver dry weight.
Bright field and fluorescence immunohistochemistry
Immunohistochemistry was performed as described.18 Briefly, brains were perfusion‐fixed with 4% paraformaldehyde. One hemisphere was embedded in paraffin and one hemisphere frozen at −80°C. Paraffin‐embedded tissue was stained with hematoxylin and eosin (H&E) or incubated with primary antibodies after heat‐induced antigen retrieval in 0.01mol/L citrate buffer (pH6). Immunopositivity was detected with 3′ #bib3′‐diaminobenzidine (DAB Substrate Kit, Vector Laboratories) as chromogen. Frozen tissue sections were permeabilized with 0.1% saponin, blocked in 5% normal donkey serum and incubated with primary antibodies. After staining with secondary antibodies (Alexa 488‐ and 568‐tagged, 1:400), sections were counterstained with 4′,6′‐diamidino‐2‐phenylindole (DAPI, Molecular Probes, 10 ng/mL). Details on primary antibodies are provided in Table S3. In each experiment, negative controls were included by omitting the primary antibody. Sections were photographed using a Leica DM6000B microscope (Leica Microsystems BV, Rijswijk, The Netherlands).
Immuno‐electron microscopy
Immuno‐electron microscopy (immuno‐EM) was performed as described.18 Brains were immersion‐fixed in 4% paraformaldehyde, cryoprotected, frozen at −80°C, and cryosectioned into 40 μm‐thick sections for free float immunolabeling. After quenching endogenous peroxidase, sections were treated with 1 freeze–thaw cycle and incubated with primary antibodies (Table S3). Immunoreactivity was detected by biotinylated goat antibody labeling, avidin–biotin horseradish peroxidase complex formation (VECTASTAIN ABC kit; Vector Laboratories, Burlingame, CA), and DAB precipitation. Sections were postfixed in 1% osmium tetroxide #bib1.5% potassium ferricyanide, dehydrated, and embedded in epoxy resin. Cerebellar white matter DAB‐positive regions were cut into 80 nm sections for transmission EM analysis in a JEOL1010 electron microscope (JEOL, Tokyo, Japan). Digital images were taken with a side‐mounted CCD camera (Morada; Olympus Soft Imaging Solutions, Münster, Germany) and assessed with iTEM analysis software (Olympus Soft Imaging Solutions).
Vacuole and astrocyte quantitative morphology
Image series from brain sections stained with H&E or against the glial fibrillary acidic protein (GFAP) was obtained with a × 40 objective. Quantification of vacuoles and astrocytes morphology was performed blind to the genotype using ImageJ. The percentage of cross‐sectioned area occupied by vacuoles was quantified in the cerebellar and callosal white matter. The thickness of perivascular astrocytic cell processes at the maximal width was measured.
Human control brain tissue
Frozen brain tissue was collected at autopsy from 15 individuals aged 1 day to 30 years. The subjects had no neurological disease or confounding neuropathology (Table S4).
RNA isolation, quantitative PCR, sodium dodecyl sulfate–polyacrylamide gel electrophoresis and Western blotting
Total RNA was extracted from mouse whole brain and human white matter with TRIzol (Invitrogen, Carlsbad, CA). Reverse transcription to complementary DNA (cDNA) was performed with SuperScript III reverse transcriptase (Life Technologies). Quantitative PCR (qPCR) was performed with a LightCycler 480 (Roche). Transcript‐specific primers (Table S1) were designed using PearlPrimer v1.1.19.28 Some primers were newly designed with NCBI's PrimerBLAST. None of the primersets amplified genomic DNA. The PCR was performed on a 10 μL volume containing SYBR Green PCR Mix (Roche) #bib1 pmol primers and 1/10 volume of the cDNA reaction sample. Relative abundance of transcript expression was calculated using the cycle threshold value and normalized to the internal controls (Gapdh and GAPDH in mouse and human samples, respectively). Each reaction was performed in duplicate.
Lysates of mouse whole brain and human white matter were used for Western blotting as described.17 Samples were diluted in 100 nmol/L potassium acetate #bib3 mmol/L magnesium acetate, 20 mmol/L Tris (pH7.4) and 100 μg of total protein was run on a 12% polyacrylamide gel. In‐gel protein loading and sample transfer was checked with 2 #bib2 #bib2‐Trichloroethanol as described.29 Membranes were blocked with 5% nonfat‐dry‐milk and incubated with the primary antibody (Table S3). After incubating with secondary antibody (Anti IgG Rabbit HRP labelled #bib1:10000, Dako), the signal was detected with an enhanced chemiluminescent substrate (SuperSignal West Femto Substrate, Fisher Scientific, Landsmeer, The Netherlands) and imaged with Image Studio on the LI‐COR Odyssey Fc Imager.
Statistical analyses
Brain dry and wet weights were compared with two‐way ANOVA followed by Sidak's multiple comparison test. Extension of white matter vacuoles was compared with the unpaired Student t‐test and Mann–Whitney U test. Astrocyte process thickness was compared with the Mann–Whitney U test. Data were processed with Prism v4.0 (GraphPad, San Diego, CA). Probability values < 0.05 were considered significant.
Results
Validation of the Glialcam‐null mouse model
The molecular construction of the Glialcam‐null mouse (Fig. 1A)19 was validated by immunohistochemistry. Staining brain sections of 7‐month‐old mice confirmed that Glialcam‐null mice expressed no GlialCAM, whereas wild‐type animals showed normal GlialCAM expression (Fig 1B).
Glialcam‐null mice have megalencephaly with increased brain water content
Glialcam‐null mice were vital and fertile and had a normal lifespan. Spontaneous motor activity, evaluated by visual inspection, was not evidently different between mutant and control mice. Glialcam‐null mutants developed megalencephaly, macroscopically evident from 3 months of age (Fig. 2A). Their brain wet weight was higher than controls from 3 weeks on and this difference increased up to 12 months (Fig. 2B). No differences were found in brain dry weight, indicating that the disparity in brain weight between mutant and wild‐type mice is due to different water content.
Figure 2.
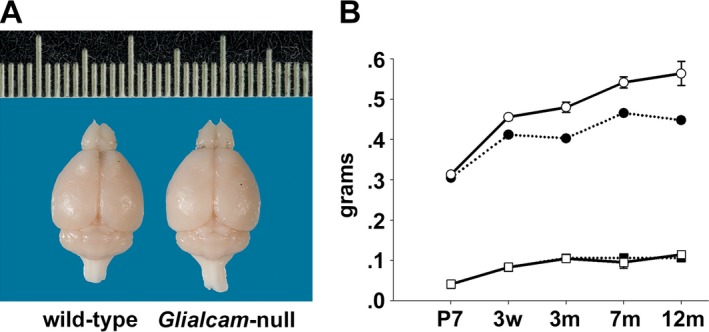
Megalencephaly with increased brain water content in Glialcam‐null mice. (A) Glialcam‐null mice have larger brains than wild‐type littermates, as shown for these 8‐month‐old animals. (B) Measurements of brain wet and dry weight at postnatal day 7 (P7) #bib3 weeks (w), and at 3, 7, and 12 months (m; n = 3 per genotype per age) show significantly increased brain wet weight (circles) in Glialcam‐null mice (solid line) compared to controls (dotted line) from 3 weeks (P = 0.98 at P7, P = 0.05 at 3 weeks, P = 0.0004 at 3 months). This difference continues to grow (P = 0.0004 at 7 months, P < 0.0001 at 12 months). No differences are present in brain dry weight (squares) between Glialcam‐null and wild‐type mice. Error bars indicate the standard error of the mean.
Glialcam‐null mice develop early white matter vacuolization and intramyelinic edema
Histopathology revealed large vacuoles throughout the white matter of Glialcam‐null mice, that were absent in wild‐type animals. In the gray matter, no vacuoles or neuronal loss was observed. White matter vacuolization was already prominent at 3 weeks in the cerebellum, where it further increased at older ages (Fig. 3A). White matter vacuoles were also noted in the corpus callosum, but these were fewer and smaller than in the cerebellum (Fig. 3B). Quantification confirmed these results (Fig. 3C and D). Overall, white matter vacuolization paralleled the degree of edema as indicated by wet weight.
Figure 3.
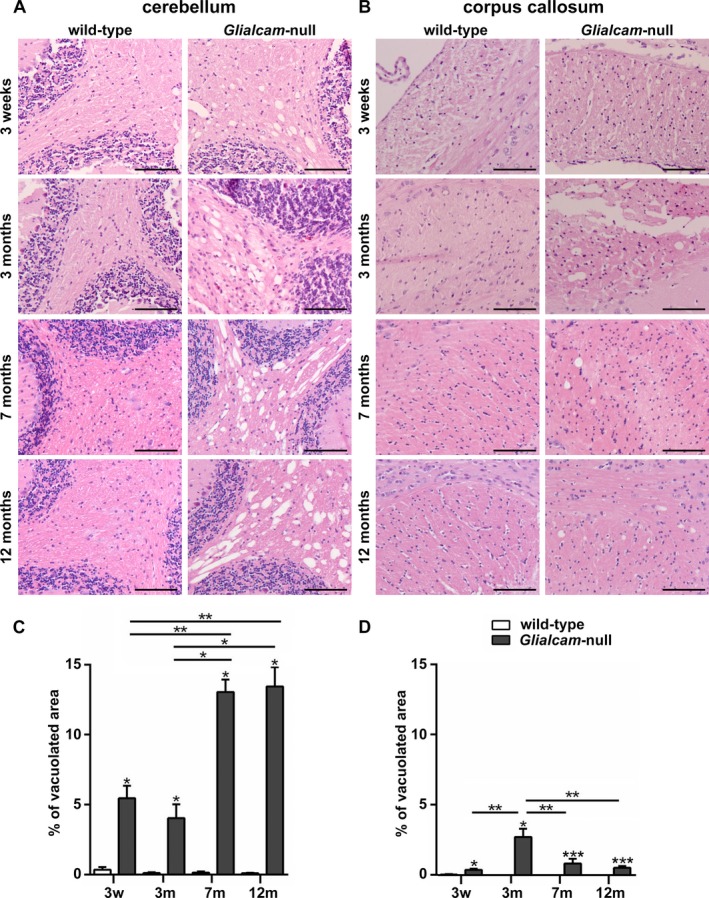
White matter vacuolization in Glialcam‐null mice. (A, B) Hematoxylin & eosin (H&E) stain of 3‐week, and 3‐, 7‐ and 12‐month‐old animals shows vacuolization of the deep and subcortical cerebellar and to a lesser degree of the callosal white matter of Glialcam‐null mice. No vacuoles are seen in wild‐type animals. Bars: 100 μm. (C,D) Quantification confirms significantly more prominent white matter vacuolization in the cerebellum (C,) and corpus callosum (D) of Glialcam‐null than of control animals at all ages. *P < 0.05, **P < 0.01 and ***P < 0.0001. Graph bars represent the standard error of the mean.
Immunohistochemistry showed comparable myelin immunoreactivity at all ages and in all white matter areas of Glialcam‐null compared to wild‐type mice (Fig. 4A), indicative of normal myelination and myelin maintenance. At high magnification, vacuoles were crossed by tissue strands immunopositive for the myelin protein proteolipid protein (PLP, Fig. 4B), indicating their intramyelinic location. By EM, vacuoles appeared as optically empty spaces lined by a membrane (Fig. 4C), a configuration compatible with vacuoles between the lamellae of the myelin sheaths.
Figure 4.
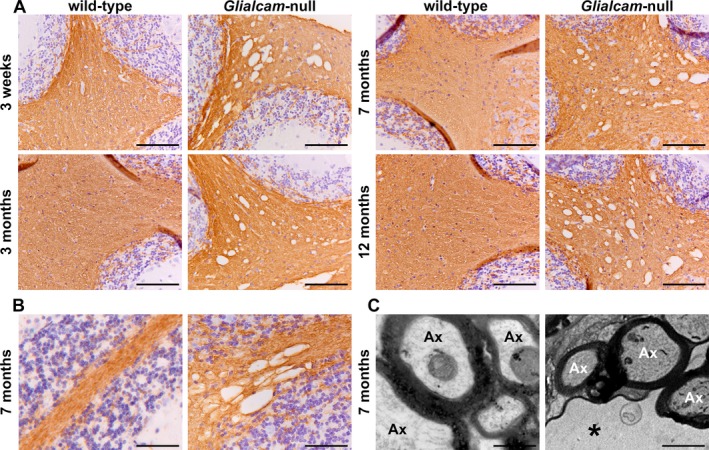
Normal myelination and intramyelinic edema in the white matter of Glialcam‐null mice. (A) Stain for the myelin‐specific protein proteolipid protein (PLP) of the cerebellum shows no differences in PLP staining intensity between Glialcam‐null and wild‐type white matter at all ages analyzed, indicating that the mutant mice have no lack or loss of myelin. (B) Stain for PLP shows that the fine tissue strands crossing the vacuoles are PLP‐positive. (C) Ultrastructural analysis of the cerebellar white matter of 8‐month‐old Glialcam‐null mice shows large vacuoles surrounded by the outermost myelin lamellae of neighboring axons. The intramyelinic splitting occurs at the intraperiod line. Bars = 50 μm (A), 100 μm (B), 500 nm (C).
Glialcam‐null mice show changes in perivascular astrocytic morphology
Glialcam‐null perivascular astrocytes had thicker cell processes abutting blood vessels than wild‐type astrocytes at all ages analyzed (Fig. 5A). EM showed that perivascular mutant astrocytes had swollen endfeet (Fig. 5B). Quantification confirmed these results (Fig. 5C). In Glialcam‐null mice, perivascular astrocyte process thickness paralleled brain wet weight at all ages.
Figure 5.
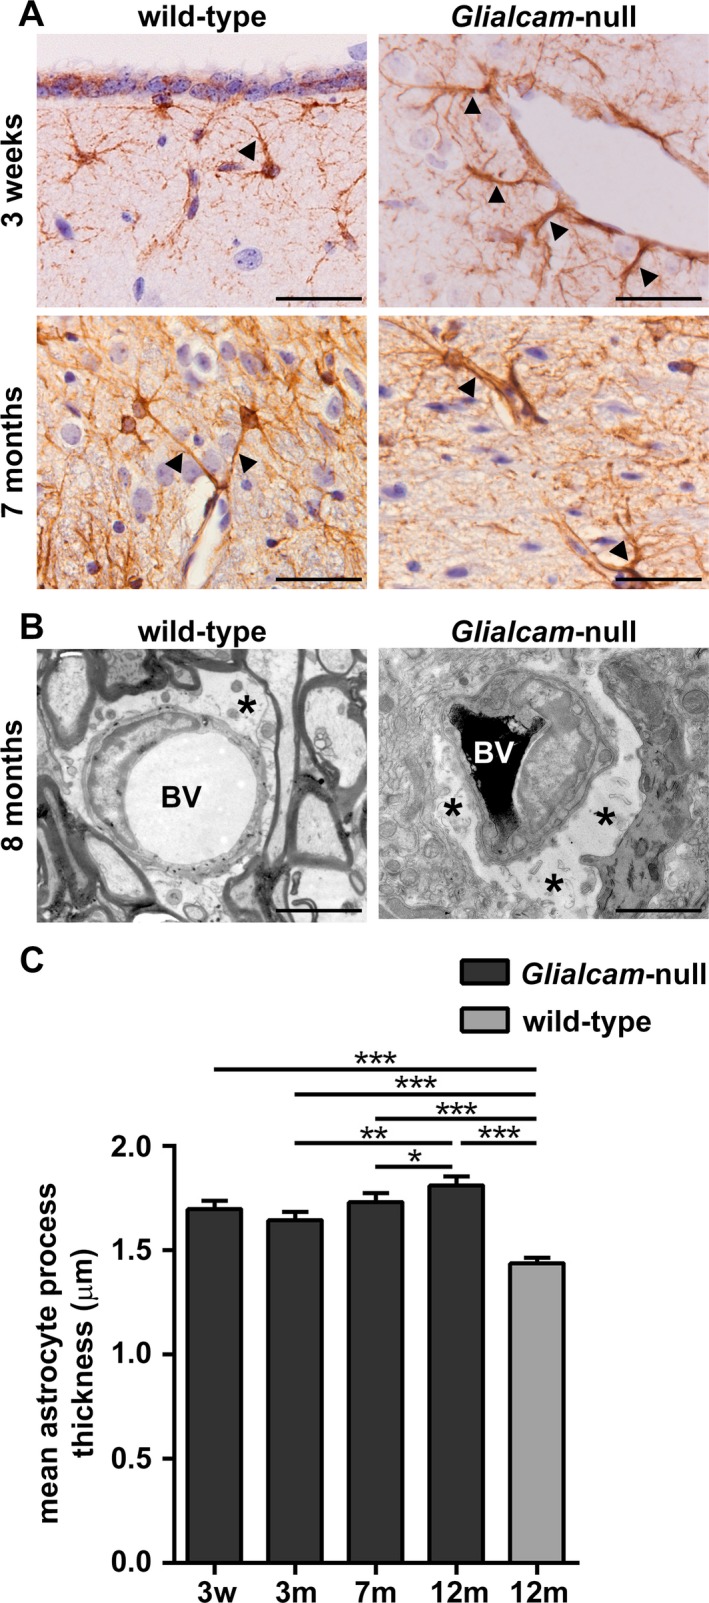
Glialcam‐null perivascular astrocytes are swollen and have thicker cell processes. (A) Glial fibrillary acidic protein (GFAP) stain shows abnormal perivascular astrocytes with thick processes abutting blood vessels (arrowheads) in the brains of Glialcam‐null mice from P21 onward as compared to wild‐type mice. (B) EM characterization of astrocytic morphology in the cerebellar white matter of 8‐month‐old Glialcam‐null mice shows that astrocytes have enlarged endfeet around the blood vessels compared to wild‐type animals. Asterisks indicate perivascular astrocytic endfeet. BV = blood vessel. Bars: 100 μm (A), 1 μm (B). (C) Glialcam‐null perivascular astrocytes have significantly thicker cell processes abutting the blood vessels than wild‐type cells. Perivascular astrocytic process thickness slightly increases between 3 and 7 and between 7 and 12 months in Glialcam‐null mice (n ≥ 100 processes per age, Mann–Whitney U test, *P < 0.05, **P < 0.001, ***P < 0.0001). Graph bars represent the standard error of the mean.
Glialcam‐null astrocytes do not express MLC1 and show reduced expression of ClC‐2
We surveyed MLC1, GlialCAM and ClC‐2 expression in wild‐type and Glialcam‐null astrocytes of 7‐month‐old mice by immunohistochemistry. Wild‐type astrocytes showed enriched expression of MLC1, GlialCAM and ClC‐2 at endfeet abutting capillaries and contacting the meninges, and in cerebellar Bergmann glia (Fig. 6A). In Glialcam‐null mice, ClC‐2 expression in perivascular astrocytic endfeet was reduced compared to controls and abolished in Bergmann glia. No MLC1 expression was found in Glialcam‐null mutants.
Figure 6.
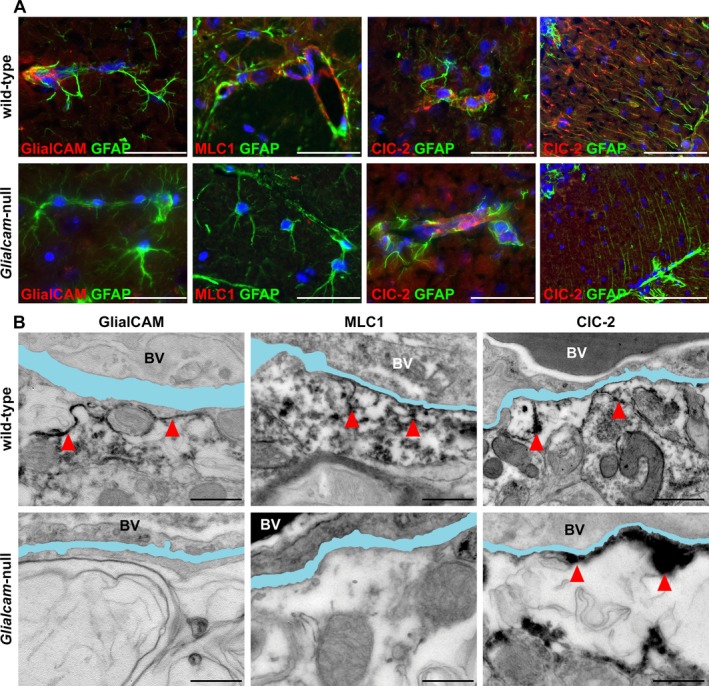
Expression of MLC1, GlialCAM and ClC‐2 in wild‐type and Glialcam‐null mice. (A) Double stain for GlialCAM (red) and glial fibrillary acidic protein (GFAP, green) shows completely absent GlialCAM perivascular expression in astrocytic endfeet abutting a capillary in the fimbria of Glialcam‐null mice. Double stain for MLC1 (red) and GFAP (green) shows no MLC1 expression in astrocytic endfeet abutting capillaries in the superior colliculus in Glialcam‐null mice. Double stain for ClC‐2 (red) and GFAP (green) shows reduced ClC‐2 expression in perivascular astrocytic endfeet in the corpus callosum and abolished ClC‐2 immunoreactivity in the Bergmann glia of the cerebellar cortex in Glialcam‐null mice. In all pictures, the nuclei are stained blue with DAPI. Bars = 100 μm. (B) GlialCAM immunoreactivity lines the perivascular basal lamina and astrocytic endfeet in wild‐type mice, but is completely absent in Glialcam‐null animals. MLC1 immunoreactivity abuts the vascular basal lamina and the astrocytic endfeet processes in wild‐type; no immunoreactivity is seen in Glialcam‐null mice. ClC‐2 immunoreactivity is found at the vascular basal lamina and astrocytic endfeet processes in wild‐type mice and also in Glialcam‐null mice. In all images, the basal lamina is colored in light blue; when duplicated, only the outermost is colored. Bars = 500 nm (B). BV = blood vessel.
CLC‐2 subcellular localization was investigated by immuno‐EM (Fig. 6B). Wild‐type astrocytes expressed MLC1, GlialCAM and ClC‐2 at the endfeet with enrichment along the cell membrane abutting the vascular basal lamina and at astrocyte–astrocyte contacts. No GlialCAM or MLC1 expression was found in Glialcam‐null mice. However, ClC‐2 had retained its normal localization around blood vessels of Glialcam‐null mice.
Glialcam‐null astrocytes show normal expression of other MLC1‐interacting proteins, caveolin‐1, and the VRAC component LRRC8A
Expression of proteins allegedly associated or interacting with MLC113, 30, 31, 32, 33, 34 was evaluated by immunohistochemistry in 7‐month‐old mice. Compared to wild‐type animals, expression of the water channel aquaporin4 was redistributed along the cell bodies and processes of Glialcam‐null astrocytes (Fig. 7A). The potassium channel Kir4.1 was unchanged in Glialcam‐null compared to wild‐type animals (Fig. 7B). Additionally, no changes were seen between Glialcam‐null and wild‐type mice in the expression of the dystrophin‐glycoprotein complex proteins α‐ and β‐dystroglycan (Fig. 7C and D), the β1 subunit of the Na,K‐ATPase pump (Fig. 7E), the calcium‐permeable channel TRPV4 (Fig. 7F), and the endothelial cell tight junction protein zonula occludens‐1 (ZO‐1, Fig. 7G).
Figure 7.
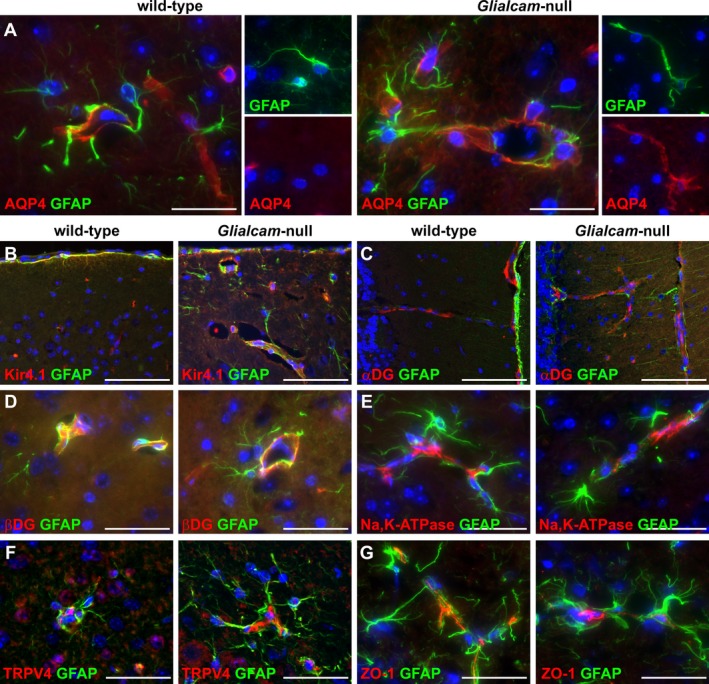
Expression of the MLC1‐associated or ‐interacting proteins in Glialcam‐null mice as detected by fluorescence immunohistochemistry. (A) Double stain for aquaporin4 (AQP4, red) and glial fibrillary acidic protein (GFAP, green) shows AQP4 redistribution along the cell body and processes of Glialcam‐null astrocytes. (B) Double stain for Kir4.1 (red) and GFAP (green) shows no changes around blood vessels of Glialcam‐null compared to wild‐type mice. (C,D) Double stain for α‐dystroglycan (α‐DG) or β‐dystroglycan (β‐DG, red) and GFAP (green) shows no differences in the expression of both proteins in the molecular layer of the cerebellar cortex (C) and corpus callosum (D) between mutant and wild‐type mice. (E,F) Double stain for Na,K‐ATPase subunit β1 or TRPV4 (red) and GFAP (green) shows comparable expression in Glialcam‐null and wild‐type animals around large‐ and small‐caliber blood vessels in the superior colliculus (E) and cerebellar white matter (F). (G) Double stain for ZO‐1 (red) and GFAP (green) shows comparable endothelial cell ZO‐1 expression in capillaries in the corpus callosum of Glialcam‐null and wild‐type mice. In all pictures, the nuclei are stained blue with DAPI. Bars = 200 μm (A), 100 μm (B‐G).
To investigate changes in subcellular localization of these proteins, cerebellar tissue sections of 8‐month‐old animals were analyzed by immuno‐EM. No differences were seen in their perivascular expression between mutant and wild‐type mice (Fig. 8A–C and E–G). Redistribution of aquaporin4 along the cell bodies and processes of Glialcam‐null astrocytes was confirmed (Fig. 8D).
Figure 8.
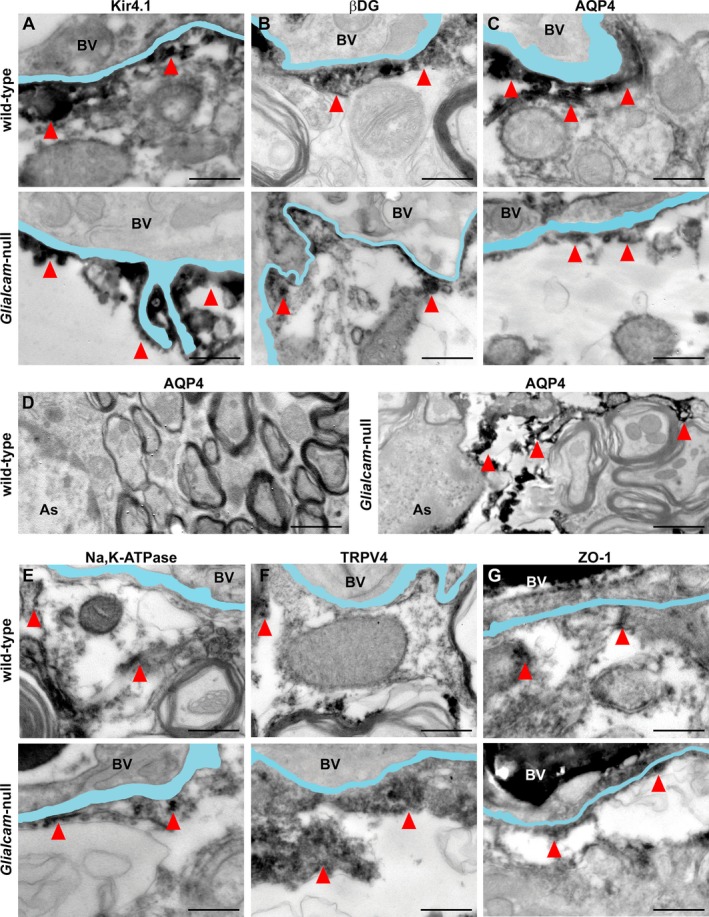
Distribution of MLC1‐associated or ‐interacting proteins in Glialcam‐null mice as detected by immuno‐EM. (A) Kir4.1 immunoreactivity abuts the vascular basal lamina in wild‐type and Glialcam‐null mice. (B) β‐dystroglycan (β‐DG) immunoreactivity is visible along the basal lamina of wild‐type and Glialcam‐null mice. (C) Wild‐type and Glialcam‐null mice show AQP4 immunoreactivity along the vascular basal lamina. (D) AQP4 expression is redistributed along the astrocytic cell processes of Glialcam‐null animals. (E) Wild‐type and Glialcam‐null mice show Na,K‐ATPase immunoreactivity along the vascular basal lamina. (F) TRPV4 immunoreactivity abuts the vascular basal lamina in wild‐type and Glialcam‐null mice. (G) Wild‐type and Glialcam‐null mice show ZO‐1 immunoreactivity along the vascular basal lamina. In all images, the basal lamina is colored in light blue; when duplicated, only the outermost is colored. Bars = 500 nm (A–C, E–G), 1 μm (D). BV = blood vessel.
We extended the immunohistochemical and immuno‐EM analysis to expression of the caveolar lipid raft protein caveolin‐1 and the recently identified VRAC channel component LRRC8A in wild‐type, Glialcam‐null and Mlc1‐null mice.18, 35, 36 We found no differences between mutant and control animals (Fig. 9A and B).
Figure 9.
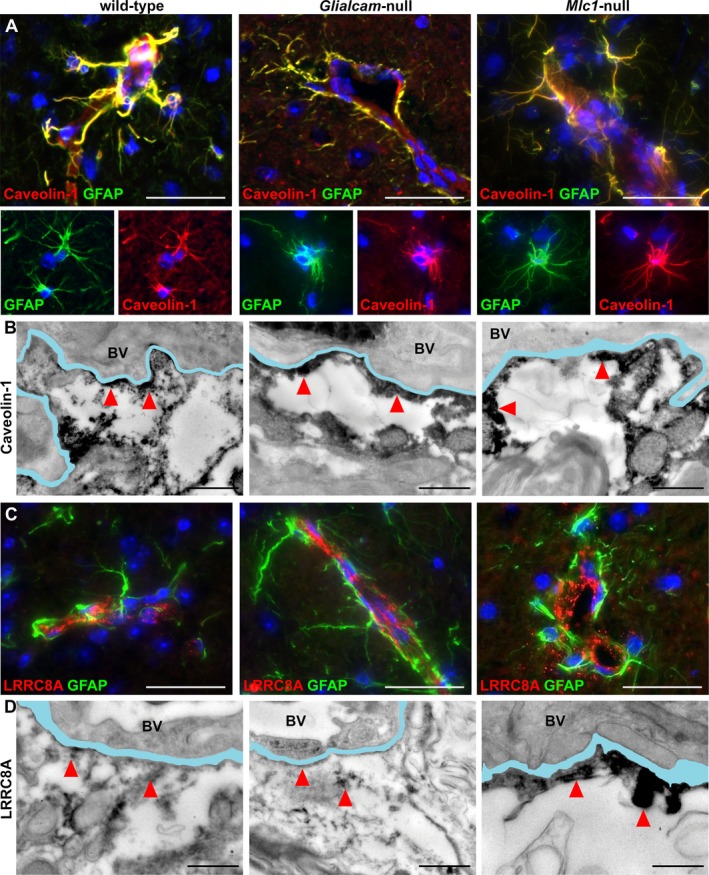
Expression and distribution of caveolin‐1 and the VRAC component LRRCA8 in wild‐type, Glialcam‐null and Mlc1‐null mice. (A) Double stain for caveolin‐1 (red) and glial fibrillary acidic protein (GFAP, green) shows no differences in caveolin‐1 expression in astrocytes and endfeet around vessels in the fimbria between wild‐type, Glialcam‐null and Mlc1‐null mice. (B) Wild‐type, Glialcam‐null and Mlc1‐null mice show caveolin‐1 immunoreactivity along the vascular basal lamina by immuno‐EM. (C) Double stain for LRRC8A (red) and GFAP (green) shows similar LRRC8A expression around blood vessels in the dorsal brainstem of Glialcam‐null, Mlc1‐null and wild‐type animals. (D) By immuno‐EM, LRRC8A immunoreactivity is visible along the basal lamina of wild‐type, Glialcam‐null and Mlc1‐null mice. In all fluorescence immunohistochemistry pictures, the nuclei are stained blue with DAPI. Bars = 100 μm (A,C). In all immuno‐EM images, the basal lamina is colored in light blue; when duplicated, only the outermost is colored. Bars = 500 nm (B,D). BV = blood vessel.
Developmental GlialCAM expression in mice and humans
To assess developmental GlialCAM expression, we analyzed wild‐type mice aged P0 to 12 months. Levels of GlialCAM protein and Glialcam mRNA increased up to 3 weeks, with no significant change thereafter (Fig. 10A and C).
Figure 10.
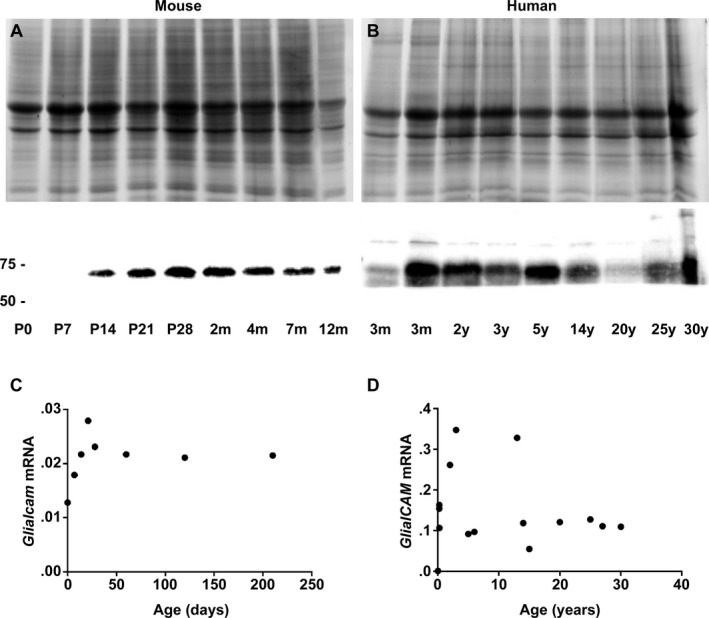
GlialCAM expression in the mouse and human brain throughout life. (A,C) Western blotting (A) and qPCR (C) in P0 to 12‐month‐old wild‐type mice show that GlialCAM protein (lower panel, approximately 60 kDa) and GlialCAM mRNA levels show the most pronounced increase up to P21 and then little further change. (B) Western blotting of frontal white matter lysates of normal human subjects shows that GlialCAM protein levels (lower panel, approximately 60 kDa) are highest during the first 5 years of life, decrease and stabilize thereafter. In‐gel trichloroethanol (TCE, A and B, upper panels) confirms equal protein load. (D) Real‐time qPCR analysis shows that relative GlialCAM mRNA levels are also highest in early infancy and then decrease to stabilize at around 5 years of life. Notably, the 13‐year‐old subject with highest GlialCAM mRNA levels had multiple injuries and succumbed after an unknown agonal time; no neuropathology was reported by the provider (National Institute of Child Health and Human Development Brain and Tissue Bank for Developmental Disorders at the University of Maryland, Baltimore, Maryland), but we cannot exclude presence of trauma‐related brain edema and compensatory GlialCAM overexpression.
To investigate GlialCAM developmental expression in humans, we surveyed mRNA and protein levels in frontal white matter of control subjects aged 1 day to 30 years. GlialCAM mRNA and GlialCAM protein levels increased in the first 3 years, then decreased to stabilize from approximately 5 years on (Fig. 10B and D).
Discussion
Most previous studies on MLC1 function are based on patient leukocytes, artificial cell systems and scarcely available patient brain tissue obtained from biopsies and one autopsy.5, 6, 8, 9, 10, 15, 21, 30, 31, 32, 33, 34, 37 To allow research on MLC1 dysfunction in the intact brain, we previously developed an Mlc1‐null mouse that models the human disease.18 Here, we phenotyped another MLC model, the Glialcam‐null mouse.
GlialCAM is a protein chaperone ensuring correct localization of MLC1 on the membrane of astrocytes.13 Recessive mutations in MLC1 and GLIALCAM lead to loss of MLC1 function causing indistinguishable clinical phenotype and brain MRI abnormalities in patients.12, 14 In agreement with this, Glialcam‐null and Mlc1‐null mice show largely overlapping neuropathology. Both display increased brain wet weight and white matter edema, although with a different timeline. In Glialcam‐null mice, brain wet weight keeps increasing throughout life, whereas in Mlc1‐null mice it reaches a plateau at 7 months and slightly decreases afterward.18 In both mutants, cerebellar white matter is the most severely affected white matter area (Fig. 11A), although the vacuolization appears earlier, is more severe and progresses more rapidly in Glialcam‐null than in Mlc1‐null mice. In both mutants, the degree of cerebellar white matter vacuolization grossly parallels the generalized edema as indicated by their brain wet weight.
Figure 11.
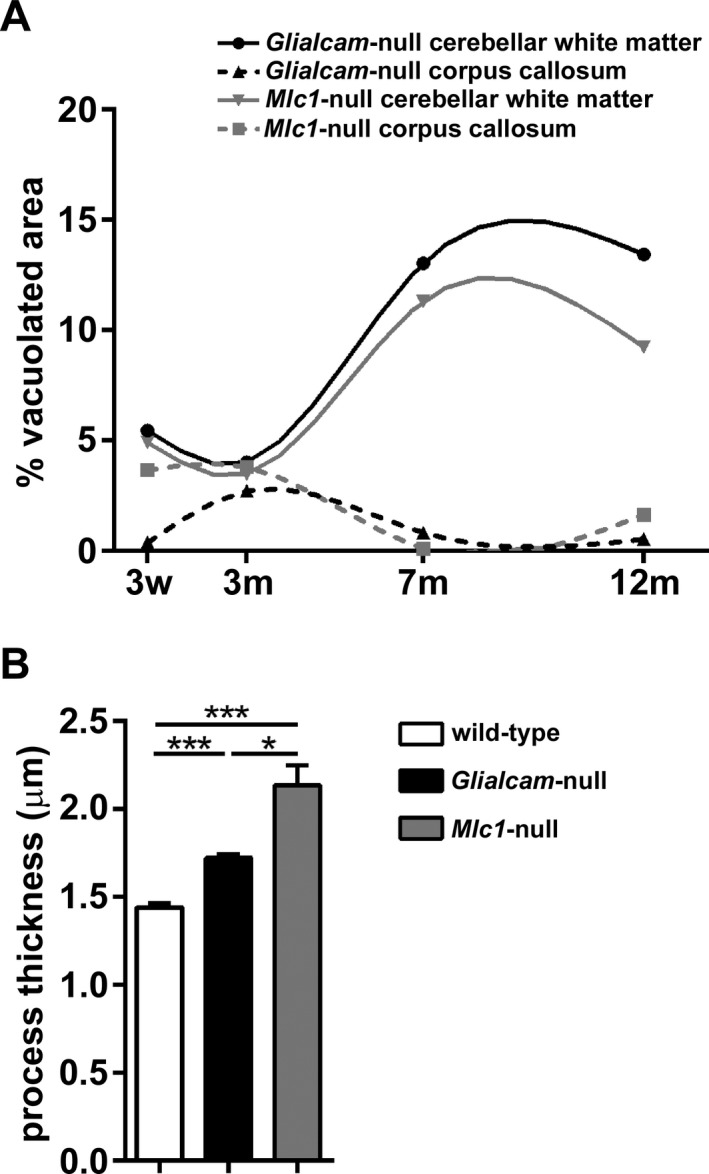
Comparing white matter vacuolization and astrocyte process thickness in Gliacam‐null and Mlc1‐null mice. (A) Compared to Mlc1‐null mice, Glialcam‐null animals have significantly more prominent vacuoles in the cerebellar white matter, but less vacuoles in the corpus callosum (N = 4 per genotype per age). (B) Astrocyte process thickness is increased in both MLC mutant mice, but is slightly higher in Mlc1‐null18 than in Glialcam‐null animals (N > 250 per genotype). *P < 0.05, ***P < 0.0001. Bars represent the standard error of the mean.
In MLC patients, white matter edema develops and is most pronounced in the first 2 years of life, when the bulk of myelination occurs and MLC1 expression is highest.18 After that, white matter edema and MLC1 expression decrease. We now show that GlialCAM expression in the human brain is also highest in the first 3 years of life, then decreases and stabilizes from 5 years onward. Mice myelinate within the first month of life, during which MLC1 and GlialCAM expression increases steeply.18 Both Glialcam‐null and Mlc1‐null mice develop megalencephaly by 3 weeks and white matter vacuolization occurs concomitantly or just afterward. In contrast to MLC patients, however, MLC1 and GlialCAM expression in mice remains high and white matter edema persists in Glialcam‐null and Mlc1‐null mutants until late in life. So, both in MLC patients and mutant mice, development and severity of white matter edema and vacuolization initially parallel myelination, and at all ages follow MLC1 and GlialCAM expression.
In MLC patients, white matter edema is most severe in the cerebral hemispheres, followed by the cerebellum; other regions, including the corpus callosum, are relatively spared.1 Mice have virtually no cerebral hemispheric white matter; in both MLC mouse models, the cerebellar white matter is first and most severely affected, much more than the corpus callosum.18 So, compatible with the anatomic differences, the distribution of the neuropathology is conserved interspecies. The regional differences in white matter vulnerability to loss of MLC1 function could be explained by regional heterogeneity of astrocytes. Astrocytes express different types of ion channels and gap junctional coupling within different brain regions, accounting for different electrophysiological properties.38 MLC1 expression in mice is highest in the cerebellum,39 but regional expression of GlialCAM is unexplored.
As in MLC patients, the ultrastructural substrate of white matter vacuolization both in Mlc1‐null and in Glialcam‐null mice is intramyelinic edema. This coincides with swelling of astrocyte endfeet, cell processes (Fig. 11B) and bodies. In Mlc1‐null mice, astrocytic swelling precedes myelin vacuolization.18 In Glialcam‐null mice, we additionally showed that the degree of white matter vacuolization parallels the increased thickness of perivascular astrocyte processes. These findings suggest a sequence of events, where astrocytic swelling occurs first and leads to intramyelinic water retention, in line with the function of MLC1 in astrocyte volume regulation. In patient lymphoblasts and Mlc1‐null mouse astrocytes, loss of MLC1 function decreases VRAC activity and slows regulatory volume decrease after cell swelling.18, 24 Similar results were obtained after GlialCAM ablation in wild‐type rat astrocytes.25 The swelling of astrocyte perivascular processes and intramyelinic edema are both compatible with a defect in these astrocyte functions. Besides MLC, intramyelinic edema occurs in other human genetic leukoencephalopathies.40 Intriguingly, swelling of white matter astrocytes has been described in some of these disorders, including maple syrup urine disease, hyperglycinemia and amino acidurias,41, 42, 43, 44 suggesting that astrocyte swelling might be a common precursor to intramyelinic edema.
Our results confirm the association of MLC1 with GlialCAM and ClC‐2. In Mlc1‐null mice, we previously found reduced expression of these proteins in perivascular astrocytic endfeet and abolished expression in the Bergmann glia.18 Here, we describe a similar reduction for ClC‐2 in Glialcam‐null mice. These results indicate that expression of these proteins is interdependent in vivo. It has been suggested that GlialCAM binds to itself, MLC1 and ClC‐2 to direct correct protein localization at cell–cell contacts.26, 45 However, from an overall clinical standpoint, this hypothesis conflicts with the observation that recessive mutations in MLC1 and GLIALCAM on one hand and in CLCN2 on the other cause two distinct phenotypes in humans with different MRI abnormalities.7, 17 The finding, however, of an abolished expression in Bergmann glia from different MLC mouse and zebrafish models could be compatible with a selective vulnerability of this specific astrocyte type to loss of MLC1 function.18, 26, 46 The recent report of GlialCAM mislocalization in the Bergmann glia of an MLC patient supports this possibility also in humans.46 Bergmann glia are a highly diversified cell type that also subserve an important role in extracellular ion homeostasis.47, 48
Previous in vitro studies suggested a structural and/or functional interaction of MLC1 with several proteins involved in ion‐water homeostasis, including ion and water channels, transporters and accessory proteins, in caveolae. Such interactions could be affected in MLC.49 In an MLC patient and in Mlc1‐null mice, expression of the potassium channel Kir4.1 was slightly increased and redistributed along the cell processes of subpial astrocytes, suggesting compensatory overexpression.18, 32 For unknown reasons, such changes do not occur in Glialcam‐null animals. By contrast, expression of the water channel aquaporin4 is not restricted to perivascular endfeet, as is normal, but redistributed along the cell bodies and processes of Glialcam‐null astrocytes, whereas no changes were detected in Mlc1‐null mice.18 A similar redistribution of aquaporin4 has been described in a rat model of hydrocephalus, also interpreted as a compensatory phenomenon.50 Recent work suggests that MLC1 could also be involved in regulation of blood–brain barrier permeability, implying that alteration of this astrocytic function could contribute to development of edema.51 The severer white matter vacuolization in Glialcam‐null than in Mlc1‐null mice could explain the difference in aquaporin4 expression between the two MLC mouse models. As previously reported for the Mlc1‐null mouse,18 we found no changes between Glialcam‐null and wild‐type mice in the expression of the other MLC1‐associated or MLC1‐interacting proteins, including α‐ and β‐dystroglycan, the β1 subunit of Na,K‐ATPase, TRPV4, ZO‐1, and caveolin‐1. Cell properties related to in vitro experimental manipulation probably account for the discrepancy between previous in vitro and our in vivo results. Recent in vitro findings suggest specific roles for MLC1 in astrocyte proliferation and maturation and in down‐regulating astrocyte response to injury.51 Notably, however we found no evidence for delayed astrocyte maturation or astrogliosis in both Mlc1‐null18 and Glialcam‐null mice (not shown). LRRC8A has recently been identified as an essential component of the mammalian VRAC.35, 36 We found no differences in LRRC8A expression and subcellular localization between wild‐type, Glialcam‐null and Mlc1‐null mice, which does not exclude a functional interaction between the related proteins. Regarding the differences between Mlc1‐null and Glialcam‐null mice, it should be noted that, different from MLC1, GlialCAM is not restricted to astrocyte endfeet, but has a wider distribution17 and has functions independent of MLC1.45 It is likely that loss of those other functions explains the differences between the mutant mice.
In conclusion, Glialcam‐null mice replicate the early stage of the human disease MLC similar to Mlc1‐null mice. Both MLC mouse models develop intramyelinic edema following a timeline that initially parallels developmental myelination and increase in MLC1 and GlialCAM expression as occurs in MLC patients. These mutant mice are suitable for further studies on the cellular pathophysiology of MLC, forming a valuable addition to the available in vitro models. Importantly, these mouse models allow experiments aiming at rescuing MLC1 function in early disease stages, when patients have megalencephaly due to intramyelinic edema, but are otherwise still clinically normal, as MLC mice are.
Author Contribution
M.B. and M.S.v.d.K. designed the study and analyzed and interpreted the data. M.B., M.D., M.Br., N.L.P. M.P.D. and T.t.B. performed the experiments. U.B., T.E.M.A., H.D.M, R.M. and J.R.T.v.W assisted with data analysis and/or experimental design. M.B. and M.S.v.d.K. wrote the article. M.B. and M.D. contributed equally to the work. J.R.T.v.W. and M.S.v.d.K. shared senior authorship.
Conflicts of Interest
Nothing to report.
Supporting information
Table S1. Primer sequences for polymerase chain reaction
Table S2. Number of animals employed per experiment and ages analyzed
Table S3. Primary antibodies and dilutions
Table S4. Demographic data of human brain samples
Acknowledgments
Part of the human tissue used in this study was obtained from the National Institute of Child Health and Human Development Brain and Tissue Bank for Developmental Disorders at the University of Maryland, Baltimore, Maryland.
References
- 1. van der Knaap MS, Valk J, Barth PG, et al. Leukoencephalopathy with swelling in children and adolescents: MRI patterns and differential diagnosis. Neuroradiology 1995;37:679–686. [DOI] [PubMed] [Google Scholar]
- 2. Singhal BS, Gursahani RD, Udani VP, Biniwale AA. Megalencephalic leukodystrophy in an Asian Indian ethnic group. Pediatr Neurol 1996;14:291–296. [DOI] [PubMed] [Google Scholar]
- 3. van der Voorn JP, Pouwels PJ, Hart AA, et al. Childhood white matter disorders: quantitative MR imaging and spectroscopy. Radiology 2006;241:510–517. [DOI] [PubMed] [Google Scholar]
- 4. Kocaman G, Eryigit G, Abbink TE, et al. An unusually mild presentation of megalencephalic leukoencephalopathy with subcortical cysts. Clin Neurol Neurosurg 2013;115:1564–1566. [DOI] [PubMed] [Google Scholar]
- 5. van der Knaap MS, Barth PG, Vrensen GF, Valk J. Histopathology of an infantile‐onset spongiform leukoencephalopathy with a discrepantly mild clinical course. Acta Neuropathol 1996;92:206–212. [DOI] [PubMed] [Google Scholar]
- 6. Harbord MG, Harden A, Harding B, et al. Megalencephaly with dysmyelination, spasticity, ataxia, seizures and distinctive neurophysiological findings in two siblings. Neuropediatrics 1990;21:164–168. [DOI] [PubMed] [Google Scholar]
- 7. van der Knaap MS, Boor I, Estevez R. Megalencephalic leukoencephalopathy with subcortical cysts: chronic white matter oedema due to a defect in brain ion and water homoeostasis. Lancet Neurol 2012;11:973–985. [DOI] [PubMed] [Google Scholar]
- 8. Pascual‐Castroviejo I, van der Knaap MS, Pronk JC, et al. Vacuolating megalencephalic leukoencephalopathy: 24 year follow‐up of two siblings. Neurologia 2005;20:33–40. [PubMed] [Google Scholar]
- 9. Miles L, DeGrauw TJ, Dinopoulos A, et al. Megalencephalic leukoencephalopathy with subcortical cysts: a third confirmed case with literature review. Pediatr Dev Pathol 2009;12:180–186. [DOI] [PubMed] [Google Scholar]
- 10. Duarri A, Teijido O, Lopez‐Hernandez T, et al. Molecular pathogenesis of megalencephalic leukoencephalopathy with subcortical cysts: mutations in MLC1 cause folding defects. Hum Mol Genet 2008;17:3728–3739. [DOI] [PMC free article] [PubMed] [Google Scholar]
- 11. Leegwater PA, Yuan BQ, van der Steen J, et al. Mutations of MLC1 (KIAA0027), encoding a putative membrane protein, cause megalencephalic leukoencephalopathy with subcortical cysts. Am J Hum Genet 2001;68:831–838. [DOI] [PMC free article] [PubMed] [Google Scholar]
- 12. Lopez‐Hernandez T, Ridder MC, Montolio M, et al. Mutant GlialCAM causes megalencephalic leukoencephalopathy with subcortical cysts, benign familial macrocephaly, and macrocephaly with retardation and autism. Am J Hum Genet 2011;88:422–432. [DOI] [PMC free article] [PubMed] [Google Scholar]
- 13. Lopez‐Hernandez T, Sirisi S, Capdevila‐Nortes X, et al. Molecular mechanisms of MLC1 and GLIALCAM mutations in megalencephalic leukoencephalopathy with subcortical cysts. Hum Mol Genet 2011;20:3266–3277. [DOI] [PubMed] [Google Scholar]
- 14. van der Knaap MS, Lai V, Kohler W, et al. Megalencephalic leukoencephalopathy with cysts without MLC1 defect. Ann Neurol 2010;67:834–837. [DOI] [PubMed] [Google Scholar]
- 15. Boor PK, de Groot K, Waisfisz Q, et al. MLC1: a novel protein in distal astroglial processes. J Neuropathol Exp Neurol 2005;64:412–419. [DOI] [PubMed] [Google Scholar]
- 16. Petrini S, Minnone G, Coccetti M, et al. Monocytes and macrophages as biomarkers for the diagnosis of megalencephalic leukoencephalopathy with subcortical cysts. Mol Cell Neurosci 2013;56:307–321. [DOI] [PubMed] [Google Scholar]
- 17. Depienne C, Bugiani M, Dupuits C, et al. Brain white matter oedema due to ClC‐2 chloride channel deficiency: an observational analytical study. Lancet Neurol 2013;12:659–668. [DOI] [PubMed] [Google Scholar]
- 18. Dubey M, Bugiani M, Ridder MC, et al. Mice with megalencephalic leukoencephalopathy with cysts: a developmental angle. Ann Neurol 2015;77:114–131. [DOI] [PubMed] [Google Scholar]
- 19. Favre‐Kontula L, Rolland A, Bernasconi L, et al. GlialCAM, an immunoglobulin‐like cell adhesion molecule is expressed in glial cells of the central nervous system. Glia 2008;56:633–645. [DOI] [PubMed] [Google Scholar]
- 20. Ambrosini E, Serafini B, Lanciotti A, et al. Biochemical characterization of MLC1 protein in astrocytes and its association with the dystrophin‐glycoprotein complex. Mol Cell Neurosci 2008;37:480–493. [DOI] [PubMed] [Google Scholar]
- 21. Lanciotti A, Brignone MS, Camerini S, et al. MLC1 trafficking and membrane expression in astrocytes: role of caveolin‐1 and phosphorylation. Neurobiol Dis 2010;37:581–595. [DOI] [PubMed] [Google Scholar]
- 22. Moh MC, Lee LH, Zhang T, Shen S. Interaction of the immunoglobulin‐like cell adhesion molecule hepaCAM with caveolin‐1. Biochem Biophys Res Commun 2009;378:755–760. [DOI] [PubMed] [Google Scholar]
- 23. Sowa G. Caveolae, caveolins, cavins, and endothelial cell function: new insights. Front Physiol 2012;2:120. [DOI] [PMC free article] [PubMed] [Google Scholar]
- 24. Ridder MC, Boor I, Lodder JC, et al. Megalencephalic leucoencephalopathy with cysts: defect in chloride currents and cell volume regulation. Brain 2011;134(Pt 11):3342–3354. [DOI] [PubMed] [Google Scholar]
- 25. Capdevila‐Nortes X, Lopez‐Hernandez T, Apaja PM, et al. Insights into MLC pathogenesis: GlialCAM is an MLC1 chaperone required for proper activation of volume‐regulated anion currents. Hum Mol Genet 2013;22:4405–4416. [DOI] [PubMed] [Google Scholar]
- 26. Hoegg‐Beiler MB, Sirisi S, Orozco IJ, et al. Disrupting MLC1 and GlialCAM and ClC‐2 interactions in leukodystrophy entails glial chloride channel dysfunction. Nat Commun 2014;19:3475. [DOI] [PubMed] [Google Scholar]
- 27. Haj‐Yasein NN, Vindedal GF, Eilert‐Olsen M, et al. Glial‐conditional deletion of aquaporin‐4 (Aqp4) reduces blood‐brain water uptake and confers barrier function on perivascular astrocyte endfeet. Proc Natl Acad Sci USA 2011;108:17815–17820. [DOI] [PMC free article] [PubMed] [Google Scholar]
- 28. Marshall OJ. PerlPrimer: cross‐platform, graphical primer design for standard, bisulphite and real‐time PCR. Bioinformatics 2004;20:2471–2472. [DOI] [PubMed] [Google Scholar]
- 29. Ladner CL, Yang J, Turner RJ, Edwards RA. Visible fluorescent detection of proteins in polyacrylamide gels without staining. Anal Biochem 2004;326:13–20. [DOI] [PubMed] [Google Scholar]
- 30. Duarri A, Lopez de Heredia M, Capdevila‐Nortes X, et al. Knockdown of MLC1 in primary astrocytes causes cell vacuolation: a MLC disease cell model. Neurobiol Dis 2011;43:228–238. [DOI] [PMC free article] [PubMed] [Google Scholar]
- 31. Jeworutzki E, Lopez‐Hernandez T, Capdevila‐Nortes X, et al. GlialCAM, a protein defective in a leukodystrophy, serves as a ClC‐2 Cl(‐) channel auxiliary subunit. Neuron 2012;73:951–961. [DOI] [PMC free article] [PubMed] [Google Scholar]
- 32. Boor I, Nagtegaal M, Kamphorst W, et al. MLC1 is associated with the dystrophin‐glycoprotein complex at astrocytic endfeet. Acta Neuropathol 2007;114:403–410. [DOI] [PMC free article] [PubMed] [Google Scholar]
- 33. Brignone MS, Lanciotti A, Macioce P, et al. The beta1 subunit of the Na, K‐ATPase pump interacts with megalencephalic leucoencephalopathy with subcortical cysts protein 1 (MLC1) in brain astrocytes: new insights into MLC pathogenesis. Hum Mol Genet 2011;20:90–103. [DOI] [PMC free article] [PubMed] [Google Scholar]
- 34. Lanciotti A, Brignone MS, Molinari P, et al. Megalencephalic leukoencephalopathy with subcortical cysts protein 1 functionally cooperates with the TRPV4 cation channel to activate the response of astrocytes to osmotic stress: dysregulation by pathological mutations. Hum Mol Genet 2012;21:2166–2180. [DOI] [PubMed] [Google Scholar]
- 35. Qiu Z, Dubin AE, Mathur J, et al. SWELL1, a plasma membrane protein, is an essential component of volume‐regulated anion channel. Cell 2014;157:447–458. [DOI] [PMC free article] [PubMed] [Google Scholar]
- 36. Voss FK, Ullrich F, Munch J, et al. Identification of LRRC8 heteromers as an essential component of the volume‐regulated anion channel VRAC. Science 2014;344:634–638. [DOI] [PubMed] [Google Scholar]
- 37. Teijido O, Martinez A, Pusch M, et al. Localization and functional analyses of the MLC1 protein involved in megalencephalic leukoencephalopathy with subcortical cysts. Hum Mol Genet 2004;13:2581–2594. [DOI] [PubMed] [Google Scholar]
- 38. Oberheim NA, Goldman SA, Nedergaard M. Heterogeneity of astrocytic form and function. Methods Mol Biol 2012;814:23–45. [DOI] [PMC free article] [PubMed] [Google Scholar]
- 39. Teijido O, Casaroli‐Marano R, Kharkovets T, et al. Expression patterns of MLC1 protein in the central and peripheral nervous systems. Neurobiol Dis 2007;26:532–545. [DOI] [PubMed] [Google Scholar]
- 40. Van der Knaap MS, Valk J. Magnetic resonance of myelination and myelin disorders, 3rd ed Berlin, Heidelberg: Springer‐Verlag, 2005. [Google Scholar]
- 41. Menkes JH, Hurst PL, Craig JM. A new syndrome: progressive familial infantile cerebral dysfunction associated with an unusual urinary substance. Pediatrics 1954;14:462–467. [PubMed] [Google Scholar]
- 42. Martin JJ, Schlote W. Central nervous system lesions in disorders of amino‐acid metabolism. A neuropathological study. J Neurol Sci. 1972;15:49–76. [DOI] [PubMed] [Google Scholar]
- 43. Agamanolis DP, Potter JL, Herrick MK, Sternberger NH. The neuropathology of glycine encephalopathy: a report of five cases with immunohistochemical and ultrastructural observations. Neurology 1982;32:975–985. [DOI] [PubMed] [Google Scholar]
- 44. Agamanolis DP, Potter JL, Lundgren DW. Neonatal glycine encephalopathy: biochemical and neuropathologic findings. Pediatr Neurol 1993;9:140–143. [DOI] [PubMed] [Google Scholar]
- 45. Capdevila‐Nortes X, Jeworutzki E, Elorza‐Vidal X, et al. Structural determinants of interaction, trafficking and function in the ClC‐2/MLC1 subunit GlialCAM involved in leukodystrophy. J Physiol 2015;593:4165–4180. [DOI] [PMC free article] [PubMed] [Google Scholar]
- 46. Sirisi S, Folgueira M, Lopez‐Hernandez T, et al. Megalencephalic leukoencephalopathy with subcortical cysts protein 1 regulates glial surface localization of GLIALCAM from fish to humans. Hum Mol Genet 2014;23:5069–5086. [DOI] [PubMed] [Google Scholar]
- 47. Wang F, Xu Q, Wang W, et al. Bergmann glia modulate cerebellar Purkinje cell bistability via Ca2 + ‐dependent K+ uptake. Proc Natl Acad Sci USA 2012;109:7911–7916. [DOI] [PMC free article] [PubMed] [Google Scholar]
- 48. De Zeeuw CI, Hoogland TM. Reappraisal of Bergmann glial cells as modulators of cerebellar circuit function. Front Cell Neurosci 2015;9:246. [DOI] [PMC free article] [PubMed] [Google Scholar]
- 49. Brignone MS, Lanciotti A, Camerini S, et al. MLC1 protein: a likely link between leukodystrophies and brain channelopathies. Front Cell Neurosci 2015;9:66. [DOI] [PMC free article] [PubMed] [Google Scholar]
- 50. Skjolding AD, Holst AV, Broholm H, et al. Differences in distribution and regulation of astrocytic aquaporin‐4 in human and rat hydrocephalic brain. Neuropathol Appl Neurobiol 2013;39:179–191. [DOI] [PubMed] [Google Scholar]
- 51. Lanciotti A, Brignone MS, Visentin S, et al. Megalencephalic leukoencephalopathy with subcortical cysts protein‐1 regulates epidermal growth factor receptor signaling in astrocytes. Hum Mol Genet 2016;25:1543–1558. [DOI] [PubMed] [Google Scholar]
Associated Data
This section collects any data citations, data availability statements, or supplementary materials included in this article.
Supplementary Materials
Table S1. Primer sequences for polymerase chain reaction
Table S2. Number of animals employed per experiment and ages analyzed
Table S3. Primary antibodies and dilutions
Table S4. Demographic data of human brain samples


