Abstract
Exhausted T cells in cancer and chronic viral infection express distinctive patterns of genes, including sustained expression of programmed cell death protein 1 (PD-1). However, the regulation of gene expression in exhausted T cells is poorly understood. Here, we define the accessible chromatin landscape in exhausted CD8+ T cells and show that it is distinct from functional memory CD8+ T cells. Exhausted CD8+ T cells in humans and a mouse model of chronic viral infection acquire a state-specific epigenetic landscape organized into functional modules of enhancers. Genome editing shows that PD-1 expression is regulated in part by an exhaustion-specific enhancer that contains essential RAR, T-bet, and Sox3 motifs. Functional enhancer maps may offer targets for genome editing that alter gene expression preferentially in exhausted CD8+ T cells.
T cell exhaustion—an acquired state of T cell dysfunction—is a hallmark of cancer and chronic viral infection (1, 2), and clinical trials of checkpoint blockade, which aim to reverse T cell exhaustion in cancer, have proven strikingly effective (3, 4). Chimeric antigen receptor (CAR)–T cell therapy has also proven highly effective for hematologic malignancies (5), but the development of exhaustion in T cells engineered to treat solid tumors remains a substantial barrier to its broader use (6). The identification of mechanisms that regulate exhausted T cells is therefore a major goal in cancer immunotherapy.
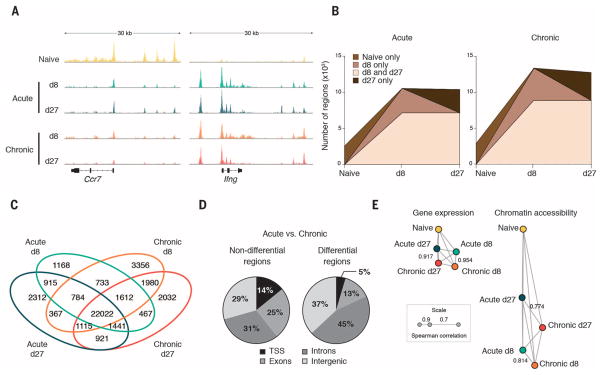
To identify regulatory regions in the genome of exhausted CD8+ T cells, we used an assay for transposase-accessible chromatin with high-throughput sequencing (ATAC-seq) (7) to demarcate areas of accessible chromatin in mouse antigen-specific CD8+ T cells differentiating in response to lymphocytic choriomeningitis virus (LCMV) infection (fig. S1A and table S1). Acute LCMV infection elicits highly functional effector CD8+ T cells, whereas chronic LCMV infection gives rise to exhausted CD8+ T cells (1–3, 8, 9). Analysis of high-quality ATAC-seq profiles (fig. S1, B to H) from naïve CD8+ T cells and those at day 8 and day 27 postinfection (p.i.) (d8 and d27, respectively) revealed that naïve CD8+ T cells underwent large-scale remodeling (Fig. 1A and fig. S2A) during differentiation [as detected by DESeq2, with a false discovery rate (FDR) < 0.05]. The majority (71%) (fig. S2A) of chromatin-accessible regions (ChARs) either emerged (e.g., those at the Ifng locus) or disappeared (e.g., Ccr7) (Fig. 1A) as naïve CD8+ T cells underwent differentiation. The gain and loss of ChARs were not balanced; a much larger fraction of regions emerged at d8 p.i. and persisted or emerged only at d27 than were either transiently detected at d8 p.i. or lost from naïve cells (Fig. 1B). Thus, differentiation from a naïve CD8+ T cell state is associated with a net increase, rather than decrease, in chromatin accessibility (fig. S2B).
Fig. 1. CD8+ Tcell exhaustion is associated with extensive changes in accessible chromatin.
(A) Representative ATAC-seq tracks at the Ccr7 and Ifng gene loci. (B) Developmental trajectory of new regions at each time point. (C) Overlap in ChARs between cell states. (D) Distribution of nondifferential (left) and differential (right) regions between acute and chronic CD8+ T cell states. TSS, transcription start site. (E) Correlation network of similarity between states measured by gene expression (left) and chromatin accessibility (right). Edge length corresponds to similarity (Spearman correlation).
Comparison of ChARs from exhausted CD8+ T cells with those found in functional effector or memory CD8+ T cells revealed marked differences in the pattern of regulatory regions. Differential regulatory regions between acute and chronic infection (Fig. 1C and fig. S2C) showed features of enhancers: They tended to be depleted of transcription start sites (TSSs) and enriched for intergenic and intronic areas (Fig. 1D), and found distal to gene promoters (fig. S2D). The magnitude of difference in the profile of regulatory regions between exhausted and functional CD8+ T cells was greater than that seen in gene expression. We found that 44.48% of all ChARs were differentially present between functional and exhausted cells at each time point, compared with only 9.75% of differentially expressed genes (both values estimated at FDR < 0.05). Consistent with this, the rank correlation between each T cell state by gene expression was much higher than at the level of regulatory regions (Fig. 1E). Thus, state change during CD8+ T cell differentiation is accompanied by a larger reorganization of accessible chromatin than is apparent by examination of gene expression.
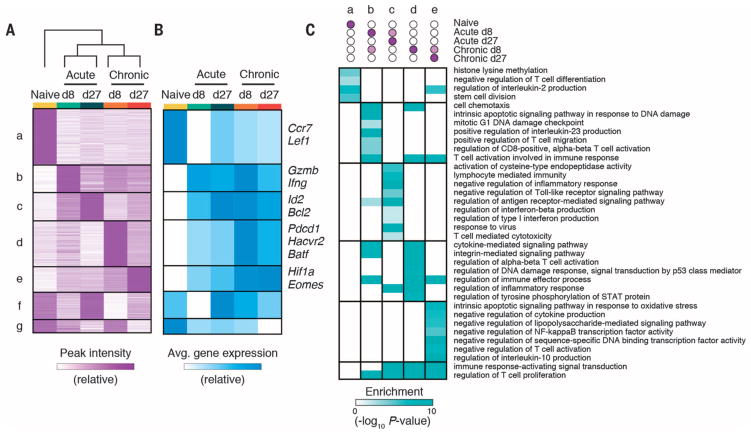
Unsupervised clustering identified “modules” of differential ChARs with similar patterns of activity across T cell states (Fig. 2A and fig. S3A). We found a highly significant positive correlation between the average peak intensity of ChARs within each module and the average gene expression of the adjacent genes (F test, P < 0.001) (Fig. 2B and fig. S3B). This suggests that, on average, the ChARs contained in each module tended to be associated with the activation, rather than repression, of corresponding genes.
Fig. 2. State-specific enhancers in CD8+ T cells form modules that map to functionally distinct classes of genes.
(A) Heat map of peak intensity for all differentially accessible regions (rows) clustered by similarity across cell states (columns). Shown are normalized numbers of cut sites (supplementary methods), scaled linearly from row minimum (white) to maximum (purple). (B) Heat map showing row-normalized average mRNA expression of neighboring genes within each module in (A) in each cell state. Informative genes from each module are shown on right. (C) Heat map showing enrichment of Gene Ontology (GO) terms (rows) in each module (columns). P-values (hypergeometric test) presented as −log10.
Genes adjacent to ChARs in each state-specific module included many with known functions in the corresponding T cell state. For example, module d, active in mouse T cells experiencing chronic LCMV infection on d8 and d27 p.i., contained ChARs adjacent to the inhibitory receptors Pdcd1 and Havcr2 (which encodes Tim3) and the transcription factor Batf, all genes that are up-regulated in exhausted CD8+ T cells (Fig. 2B) (1, 8). Moreover, the functional classes of genes in each module were distinct on the basis of pathway enrichment (Fig. 2C and table S2). Thus, ChARs that distinguish naïve, effector, memory, and exhausted CD8+ T cells are organized into state-specific modules that positively regulate functionally distinct programs of genes.
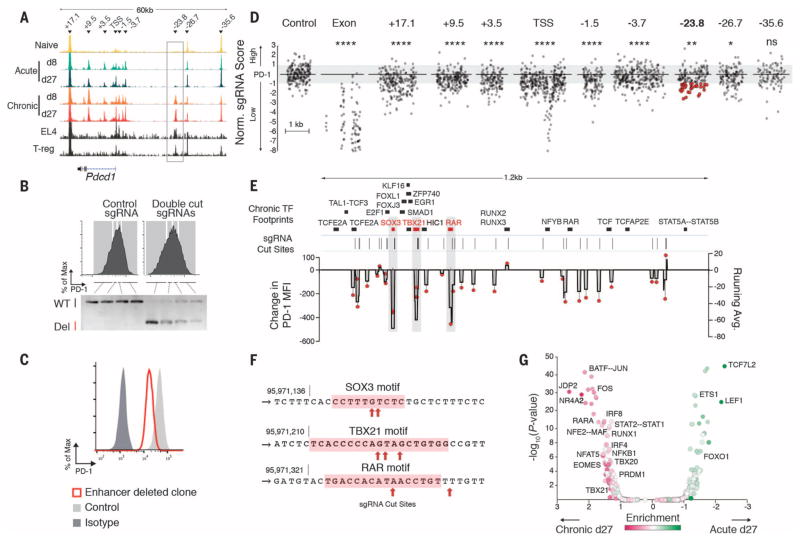
We next sought to test whether regulatory regions specific to exhausted cells could regulate genes differentially expressed in exhausted CD8+ T cells. Persistent expression of PD-1 is a cardinal feature of exhausted CD8+ T cells, but PD-1 is also transiently expressed by effector CD8+ T cells during acute LCMV infection (3, 8). We identified nine ChARs within 45 kb of the Pdcd1 gene locus (Fig. 3A) and found several that correspond to previously described regions with enhancer activity (−1.5 kb and −3.7 kb) (Fig. 3A) (10); these were present in both acute and chronic infection. We also identified an additional region (−23.8 kb) that only showed appreciable chromatin accessibility in exhausted CD8+ T cells at d8 and d27 p.i. from chronic infection (Fig. 3A).
Fig. 3. High-resolution functional mapping of an exhaustion-specific enhancer identifies minimal sequences that regulate PD-1.
(A) ATAC-seq tracks from CD8+ T cells, EL4 cell line, and regulatory CD4+ T cells (12). Arrowheads indicate individual ChARs. (B) Cell sorting gates (top) and corresponding genomic polymerase chain reaction amplification for the PD-1 enhancer region (bottom) showing proportion of wild-type (WT) or deleted (Del) alleles in EL4 cells transfected with control (left) or double-cut sgRNAs (right). Representative data shown from two replicates. (C) PD-1 expression of EL4 WT (light gray) or representative enhancer-deleted (red) single-cell clone out of 46 clones. (D) Normalized enrichment of sgRNAs (gray symbols) within PD-1–high and PD-1–low populations at locations shown (supplementary methods). Control nontargeting sgRNAs are pseudo mapped with 5-bp spacing. Red symbols correspond to the 21 sgRNAs with the largest effect within the −23.8 kb enhancer, for which isogenic cell lines were later produced. (E) Overlap of TF footprints and sgRNA activity within the −23.8 kb enhancer. TF footprints with binding probability >0.9 in chronic d27 are shown on top. Lines represent cut sites of top-scoring sgRNAs. Change in PD-1 mean fluorescence intensity (MFI) relative to control guide transfected populations for each sgRNA (red symbol, left axis); 10-bp running average of PD-1 MFI changes caused by sgRNA activity shown in black (right axis). (F) sgRNA cut sites within the SOX3, TBX21, and RAR motifs. (G) Log fold enrichment of predicted TF footprints in acute d27 versus chronic d27 CD8+ T cells (x axis) (see supplementary methods) are plotted against the corresponding P-value (hypergeometric).
We hypothesized that this ChAR might function as an enhancer of PD-1 that is required for persistent, high levels of expression in exhausted CD8+ T cells. Analysis of chromatin accessibility at this region in previously published deoxyribonuclease I–hypersensitive site–mapping (11) or ATAC-seq data (12) showed that it was not active in other types of hematopoietic cells, except the murine T cell line EL4 and regulatory CD4+ T cells, both of which can constitutively express high levels of PD-1 (10, 13) (Fig. 3A and fig. S4A). We cloned a 781–base pair (bp) fragment corresponding to this region into a reporter construct and found that it induced a 10- to 12-fold increase in reporter gene expression, confirming that it could function as an enhancer (fig. S4B).
We then tested whether the −23.8 kb enhancer was necessary for high-level PD-1 expression. We used the CRISPR-Cas9 nuclease to delete a 1.2-kb fragment at that position in EL4 cells, which have both sustained high-level PD-1 expression and open chromatin at that enhancer site (14, 15) (fig. S4, C to G). In Cas9-expressing EL4 cells transduced with a pair of single-guide RNAs (sgRNAs) flanking the enhancer, cells with the lowest PD-1 expression had the highest amount of the enhancer deletion (Fig. 3B). We confirmed this finding in single-cell clones and found that the expression of PD-1 in clones with a biallelic deletion of the target ChAR was significantly lower (P > 0.0002, Mann-Whitney U test) than expression in nondeleted clones (fig. S4, H to J). Deletion of this region resulted in decreased but not abrogated PD-1, suggesting that additional regulatory regions in EL4 cells are also involved in regulating PD-1 expression (Fig. 3C). Among all genes within 1.5 Mb of the Pdcd1 locus, only PD-1 mRNA expression was significantly decreased by deletion of the −23.8 kb ChAR (fig. S3K). This suggests that the −23.8 kb ChAR present in exhausted, but not functional, CD8+ T cells serves as an enhancer that is required to maintain high levels of PD-1 expression.
We next sought to identify the functional contribution of specific sequences within enhancer regions to the regulation of PD-1 expression. We used Cas9-mediated in situ saturation mutagenesis and designed all possible sgRNAs within the −23.8 kb enhancer and eight other regulatory sequences near the Pdcd1 locus (15, 16) (Fig. 3A). We transduced Cas9-expressing EL4 cells with a pool of 1754 enhancer-targeting sgRNAs, 117 sgRNAs targeting the Pdcd1 exons as positive controls, and 200 nontargeting sgRNAs as negative controls (fig. S5, A and B). We sorted transduced EL4s into populations on the basis of high or low PD-1 expression and quantified the abundance of individual sgRNAs (fig. S5C).
In comparison with nontargeting sgRNAs, which were equivalently distributed between PD-1–high and PD-1–low fractions, sgRNAs targeting Pdcd1 exons were highly enriched in the PD-1–low fraction as expected (Fig. 3D and fig. S5, D and E). sgRNAs targeting eight of the nine regulatory regions were also significantly enriched in the PD-1–low fraction to varying degrees (P < 0.00001 to P < 0.01, see supplementary methods), suggesting that critical sequences affecting PD-1 expression are densely represented within each of the eight regulatory regions. However, sgRNAs in the −35.6 kb ChAR had no significant effect on PD-1 expression, consistent with prior observations that this region falls outside the CCCTC-binding factor (CTCF)–mediated boundaries of the Pdcd1 locus (10).
We focused on sgRNAs inducing cleavage in the −23.8 kb enhancer (fig. S5F) and found a strong correlation between the predicted activity in a pooled setting (PD-1 high:low ratio >1 SD below mean) and their effect on PD-1 mean fluorescence intensity in individual cell lines (P = 0.0041) (fig. S5, G and H). Inspection of the predicted cleavage-site locations revealed three critical regions of the enhancer in which cleavage markedly affected PD-1 expression (Fig. 3E, gray shading).
We next asked whether these critical regions in the −23.8 kb enhancer were associated with distinct patterns of transcription factor (TF) binding in exhausted CD8+ T cells in vivo. We identified TF footprints (17) using ATAC-seq cut sites from CD8+ T cells experiencing chronic infection, which allowed us to infer TF binding within the −23.8 kb enhancer (Fig. 3E; fig. S6, A to D; fig. S7A; and tables S3 to S6). We found that cleavage sites of sgRNAs that reduced PD-1 expression in EL4 cells were significantly enriched in TF footprints found in exhausted CD8+ cells in vivo (P = 8.63 × 10⁴, hypergeometric test). The three TF footprints with greatest sensitivity to disruption corresponded to motifs for Sox3, T-bet (encoded by Tbx21), and retinoic acid receptor (RAR) in exhausted CD8+ T cells in vivo (Fig. 3F and fig. S7B). Indeed, comparison of genome-wide TF footprinting between chronic and acute infection at d27 to identify TF motifs that showed significantly differential inferred binding (Fig. 3G, fig. S7C, and tables S3 and S5) confirmed that Rara binding was significantly enriched in exhausted CD8+ T cells (FDR = 3.14 × 10⁻¹³) compared with their functional counterparts.
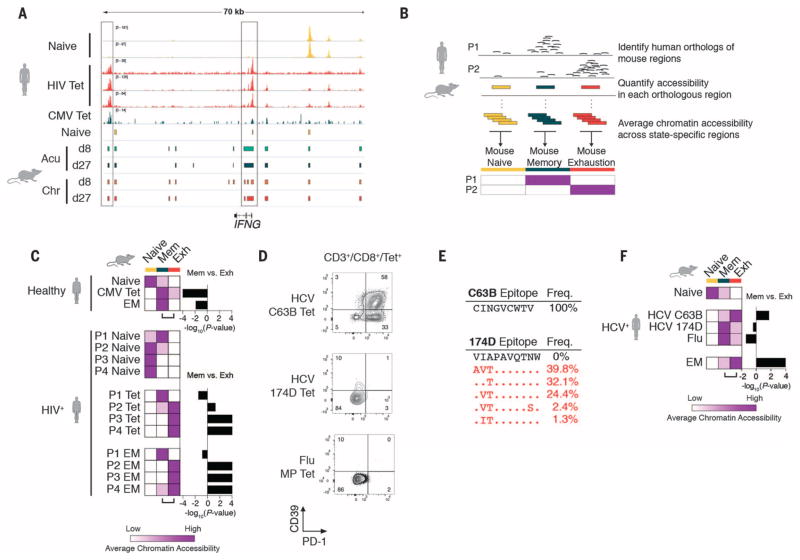
To test whether T cell exhaustion is also associated with a distinct epigenetic state in human exhausted CD8+ T cells, we analyzed global patterns of chromatin accessibility in tetramer+ CD8+ T cells from four subjects with chronic progressive HIV-1 who were not on therapy (Fig. 4, A and B; fig. S8, A and B; and table S7). We successfully mapped 80 to 85% of ChARs identified in the mouse model to their human orthologous regions (Fig. 4A, colored blocks, and fig. S8C) (18, 19) and found them to be enriched for disease-associated single-nucleotide polymorphisms (SNPs) (probabilistic identification of causal SNPs, P < 2.77 × 10⁻⁸; hyper-geometric test) (fig. S8D) (20) and, in particular, immune-related National Human Genome Research Institute genome-wide association study SNPs (P < 3.70 × 10⁻³) (fig. S8, E to G). This enrichment strongly suggested that mapped regions corresponded to functional regulatory regions within the immune system. Regions at the Pdcd1 locus were not among those mapped from the mouse model, as previously observed (10), which limited our ability to detect an ortholog to the −23.8 kb enhancer observed in the mouse model.
Fig. 4. Exhaustion-specific epigenetic profiles in the mouse are conserved in antigen-specific exhausted human T cells in HIV-1 infection.
(A) Representative ATAC-seq tracks from naïve, HIV-1 tetramer+, and CMV tetramer+ samples at the IFNG gene locus (top). Orthologous regions from five mouse cell states at the IFNG locus, based on mapping of mouse ChARs to the human genome (colored blocks, bottom). (B) Schematic diagram of mouse and human comparative analysis. (C) Heat map of average chromatin accessibility at regions orthologous to mouse naïve, memory, and exhaustion enhancers in human samples indicated. Color scale as in Fig. 2A. (D) PD-1 and CD39 expression measured by flow cytometry in HCV C63B tetramer+, HCV 174D tetramer+, and influenza (flu) matrix peptide (MP) tetramer+ populations from a single HCV-infected donor. (E) Viral sequences encoding C63B and 174D epitopes. (F) Heat map of average chromatin accessibility at regions orthologous to mouse naïve, memory, and exhaustion enhancers in human samples indicated from a single HCV-infected donor.
Human naïve CD8+ T cells from the majority of donors showed greater chromatin accessibility in naïve-specific regions defined in the mouse than in memory- or exhaustion-specific regions. In the healthy donor, CMV-specific tetramer+ CD8+ T cells, and effector memory cells were enriched for memory-specific regions (Mann-Whitney U test, P = 0.01 to P < 0.0001) (Fig. 4C and fig. S8H). In contrast, HIV-specific tetramer+ cells from three out of the four subjects showed significantly greater chromatin accessibility in exhaustion-specific regions (Mann-Whitney U test, P = 0.05 to P < 0.001) than in memory-specific regions.
Finally, we confirmed these findings in a subject with chronic hepatitis C virus (HCV) infection in whom CD8+ T cell responses to two epitopes of HCV could be detected (Fig. 4D). Sequencing of the HCV genome in this subject revealed that, unlike the C63B epitope, the 174D epitope had undergone extensive viral escape, and no wild-type viral sequence could be detected (Fig. 4E). We found that the C63B tetramer+ cells had a phenotype consistent with exhaustion and showed significantly greater chromatin accessibility at exhaustion-specific regions (Mann-Whitney U test, P = 0.01) than memory regions (Fig. 4F). In contrast, 174D tetramer+ cells, which were specific for the escape mutant epitope, lacked exhaustion-specific surface markers and showed greater chromatin accessibility in memory-specific regions, as did influenza-specific CD8+ T cells (Mann-Whitney U test, P = 0.04) (Fig. 4F). Thus, the state-specific pattern of chromatin accessibility found in mouse exhausted CD8+ T cells is conserved in human exhausted CD8+ T cells.
We find that CD8+ T cell exhaustion occurs with a broad remodeling of the enhancer landscape and TF binding. This suggests that exhausted CD8+ T cells occupy a differentiation state distinct from functional memory CD8+ T cells. Identifying the plasticity of this state and whether or how it could be reverted becomes a critical question for immunotherapy applications. Our data also suggest that mapping state-specific enhancers in exhausted T cells could enable more precise genome editing for adoptive T cell therapy. Genome editing of CAR-T cells to make them resistant to exhaustion is an appealing concept and has led to recent studies investigating the deletion of the PD-1 gene locus (21, 22). Editing exhaustion-specific enhancers (15) may provide a more “tunable” and state-specific approach to modulate T cell function than deleting coding regions of genes. Functional maps of enhancers specific to exhausted CD8+ T cells may therefore provide a crucial step toward the rational engineering of T cells for therapeutic use.
Acknowledgments
The authors thank members of the Yosef and Haining laboratories for their input, the research subjects for their participation, and J. Doench and the entire Genetic Perturbation Platform at the Broad Institute for their advice on Cas9-mediated screening technology. The authors are grateful for input from the Cancer Center for Genome Discovery. The data reported in this manuscript are tabulated in the main paper and in the supplementary materials. Genome-wide data generated in this study can be accessed via GEO accession no. GSE87646. This research was supported by AI115712, AI091493, and AI082630 to W.N.H. from the NIH; by the BRAIN Initiative grants MH105979 and HG007910 from the NIH to N.Y.; and by 1R21AI078809-01 and UM1 AI068618 from the NIH to N.F. The authors declare no potential conflicts of interest. D.R.S., J.K., N.Y., E.J.W., and W.N.H. are inventors on a patent application (U.S. Patent Application no. 62/310,903) held and submitted by Dana-Farber Cancer Institute.
Footnotes
SUPPLEMENTARY MATERIALS
www.sciencemag.org/content/354/6316/1165/suppl/DC1
Materials and Methods
Figs. S1 to S8
Tables S1 to S7
References (23–43)
REFERENCES AND NOTES
- 1.Wherry EJ, et al. Immunity. 2007;27:670–684. doi: 10.1016/j.immuni.2007.09.006. [DOI] [PubMed] [Google Scholar]
- 2.Zajac AJ, et al. J Exp Med. 1998;188:2205–2213. doi: 10.1084/jem.188.12.2205. [DOI] [PMC free article] [PubMed] [Google Scholar]
- 3.Barber DL, et al. Nature. 2006;439:682–687. doi: 10.1038/nature04444. [DOI] [PubMed] [Google Scholar]
- 4.Topalian SL, et al. N Engl J Med. 2012;366:2443–2454. doi: 10.1056/NEJMoa1200690. [DOI] [PMC free article] [PubMed] [Google Scholar]
- 5.Porter DL, Levine BL, Kalos M, Bagg A, June CH. N Engl J Med. 2011;365:725–733. doi: 10.1056/NEJMoa1103849. [DOI] [PMC free article] [PubMed] [Google Scholar]
- 6.Long AH, et al. Nat Med. 2015;21:581–590. doi: 10.1038/nm.3838. [DOI] [PMC free article] [PubMed] [Google Scholar]
- 7.Buenrostro JD, Giresi PG, Zaba LC, Chang HY, Greenleaf WJ. Nat Methods. 2013;10:1213–1218. doi: 10.1038/nmeth.2688. [DOI] [PMC free article] [PubMed] [Google Scholar]
- 8.Doering TA, et al. Immunity. 2012;37:1130–1144. doi: 10.1016/j.immuni.2012.08.021. [DOI] [PMC free article] [PubMed] [Google Scholar]
- 9.Paley MA, et al. Science. 2012;338:1220–1225. doi: 10.1126/science.1229620. [DOI] [PMC free article] [PubMed] [Google Scholar]
- 10.Austin JW, Lu P, Majumder P, Ahmed R, Boss JM. J Immunol. 2014;192:4876–4886. doi: 10.4049/jimmunol.1302750. [DOI] [PMC free article] [PubMed] [Google Scholar]
- 11.Vierstra J, et al. Science. 2014;346:1007–1012. doi: 10.1126/science.1246426. [DOI] [PMC free article] [PubMed] [Google Scholar]
- 12.Lara-Astiaso D, et al. Science. 2014;345:943–949. doi: 10.1126/science.1256271. [DOI] [PMC free article] [PubMed] [Google Scholar]
- 13.Raimondi G, Shufesky WJ, Tokita D, Morelli AE, Thomson AW. J Immunol. 2006;176:2808–2816. doi: 10.4049/jimmunol.176.5.2808. [DOI] [PubMed] [Google Scholar]
- 14.Shalem O, et al. Science. 2014;343:84–87. doi: 10.1126/science.1247005. [DOI] [PMC free article] [PubMed] [Google Scholar]
- 15.Canver MC, et al. Nature. 2015;527:192–197. doi: 10.1038/nature15521. [DOI] [PMC free article] [PubMed] [Google Scholar]
- 16.Vierstra J, et al. Nat Methods. 2015;12:927–930. doi: 10.1038/nmeth.3554. [DOI] [PMC free article] [PubMed] [Google Scholar]
- 17.Pique-Regi R, et al. Genome Res. 2011;21:447–455. doi: 10.1101/gr.112623.110. [DOI] [PMC free article] [PubMed] [Google Scholar]
- 18.Gjoneska E, et al. Nature. 2015;518:365–369. doi: 10.1038/nature14252. [DOI] [PMC free article] [PubMed] [Google Scholar]
- 19.Villar D, et al. Cell. 2015;160:554–566. doi: 10.1016/j.cell.2015.01.006. [DOI] [PMC free article] [PubMed] [Google Scholar]
- 20.Farh KK, et al. Nature. 2015;518:337–343. doi: 10.1038/nature13835. [DOI] [PMC free article] [PubMed] [Google Scholar]
- 21.Hendel A, et al. Nat Biotechnol. 2015;33:985–989. doi: 10.1038/nbt.3290. [DOI] [PMC free article] [PubMed] [Google Scholar]
- 22.Schumann K, et al. Proc Natl Acad Sci USA. 2015;112:10437–10442. doi: 10.1073/pnas.1512503112. [DOI] [PMC free article] [PubMed] [Google Scholar]


