

Abstract
Despite emerging appreciation for the important role of immune checkpoint receptors in regulating the effector functions of T cells, it is unknown whether their expression is involved in determining the clinical outcome in response to cetuximab therapy. We examined the expression patterns of immune checkpoint receptors (including PD-1, CTLA-4, and TIM-3) and cytolytic molecules (including granzyme B and perforin) of CD8+ tumor-infiltrating lymphocytes (TILs) and compared them to those of peripheral blood T lymphocytes (PBLs) in patients with head and neck cancer (HNSCC) during cetuximab therapy. The frequency of PD-1 and TIM-3 expression was significantly increased in CD8+ TILs compared to CD8+ PBLs (P = 0.008 and P = 0.02, respectively). This increased CD8+ TIL population co-expressed granzyme B/perforin and PD-1/TIM-3, which suggests a regulatory role for these immune checkpoint receptors in cetuximab-promoting cytolytic activities of CD8+ TIL. Indeed, the increased frequency of PD-1+ and TIM-3+ CD8+ TILs was inversely correlated with clinical outcome of cetuximab therapy. These findings support the use of PD-1 and TIM-3 as biomarkers to reflect immune status of CD8+ T cells in the tumor microenvironment during cetuximab therapy. Blockade of these immune checkpoint receptors might enhance cetuximab-based cancer immunotherapy to reverse CD8+ TIL dysfunction, thus potentially improving clinical outcomes of HNSCC patients.
Keywords: cetuximab, checkpoint receptors, tumor infiltrating lymphocytes
Introduction
Immune checkpoint receptors expressed by T cells can negatively control their activation, expansion, and effector functions through inhibitory signals generated by interacting with their cognate ligands. Particularly, many of immune checkpoint receptors are significantly upregulated by tumor-infiltrating lymphocytes (TIL), indicating that these inhibitory receptors are induced by complex components distinctively formed at the tumor microenvironment (TME) (1–3). In the tumor microenvironment (TME), T cells with low TCR binding affinities are often insufficiently primed or boosted by antigenic stimulation and the cytokine milieu, contributing to T-cell exhaustion, by upregulating immune checkpoint receptors (4). For example, upregulation of programmed cell death 1 (PD-1) correlates with suppressed effector functions of T cells, such as cytolytic activity against tumors, cytokine release, and expansion in the TME, thus enabling tumors to evade immune surveillance (5). Upon interaction with its ligands PD-L1/-L2, expressed by tumor cells or inflammatory immune cells, PD-1 ligation inhibits T-cell receptor signaling by recruiting phosphatases SHP-1 and SHP-2 (6). Monoclonal antibodies (mAbs) to PD-1 or PD-L1 can block the negative signals and enhance T-cell functions, restoring antitumor immunity, and have emerged as an effective immunotherapy for patients with various cancers (7, 8). T-cell immunoglobulin and mucin domain 3 (TIM-3) is predominantly expressed by PD-1+ CD8+ TILs in both tumor-bearing animals and cancer patients (1, 9). Three different ligands, including galectin-9, HMGB1, and CEACAM1, can interact with TIM-3 and suppress T-cell activities (10–12). In spite of this, TIM-3+ CD8+ TILs isolated from melanoma patients more efficiently lysed autologous tumor cell lines than did their TIM-3− CD8+ TILs counterparts (1). Blockade of TIM-3 can increase cytokine production, including IFNγ and TNFα production, enhance expansion of tumor antigen NY-ESO-1–specific CD8+ T cells upon antigen stimulation, and act synergistically when combined with PD-1 blockade (13). Thus, blockade of TIM-3 has therapeutic potential in treating cancer patients by impairing the antitumor activities of tumor antigen-specific CD8+ TILs (14, 15).
Although the efficacy of cetuximab (a mAb to the EGF receptor) therapy is limited to 15–25% in treating patients with head and neck squamous cell cancer (HNSCC), the immunological mechanisms underlying this moderate response rate has not been well characterized. It has been proposed that immune tolerance in the TME is inversely associated with efficacy and correlated with resistance to anticancer drugs and cancer recurrence (16). We have demonstrated that CTLA-4+ and Foxp3+ regulatory T cells (Tregs) are significantly increased in the microenvironment of patients with HNSCC during cetuximab therapy, suppress cetuximab-induced NK cell cytotoxicity, and correlate with poor prognosis (17). We also proposed that treatment with cetuximab can stimulate CD8+ T cells through cross-presentation following tumor cell death, which is a critical process to induce expansion of tumor-derived antigen, EGFR-specific, CD8+ T cells (18). Because TCR activation induces immune checkpoint receptors, we hypothesized that cross-presentation mediated by cetuximab could upregulate these inhibitory receptors, thus contributing to T-cell dysfunction in the TME, subsequently affecting efficacy and resistance to cetuximab therapy. In this report, we demonstrate that the frequency of PD-1+ and TIM-3+ cells was significantly increased on CD8+ TILs, which also expressed granzyme B and perforin. These results suggest that therapeutic mAb targeting PD-1 or TIM-3 molecules should be combined with cetuximab to improve clinical outcomes for HNSCC patients.
Materials and Methods
Patients and specimens
Patients were seen in the Outpatient Clinic of the Department of Otolaryngology at the University of Pittsburgh Medical Center, and all subjects signed an informed consent approved by the Institutional Review Board of the University of Pittsburgh (IRB #99-06). Peripheral venous blood samples were obtained from cetuximab-treated patients with previously untreated stage III/IV HNSCC, receiving cetuximab monotherapy on a prospective phase II clinical trial (UPCI #08-013, NCT 01218048) (17). Tumor and blood were collected before and after a 4-week window of weekly cetuximab. Cetuximab 250 mg/m2 was weekly injected and 400 mg/m2 after an initial dose. 2 specimen were collected from larynx, 8 from oral cavity and 8 from oropharynx specimens for this study. We also summarized the samples used in each figures in Table 2.
Table 2.
Summary for patients and figures using their specimens (UPCI #08-013)
| Responder: before & after | Figures using specimens | ||||
|---|---|---|---|---|---|
| HN12-6675 & HN12-6741 | Fig. 1 | Fig. 2 | Fig. 3 | Fig. 5 | |
| HN12-6864 & HN12-6938 | Fig. 1 | Fig. 2 | Fig. 3 | Fig. 4 | Fig. 5 |
| HN12-7031 & HN12-7089 | Fig. 1 | Fig. 2 | Fig. 3 | Fig. 4 | Fig. 5 |
| HN12-7081 & HN12-7148 | Fig. 1 | Fig. 2 | Fig. 5 | ||
| HN12-7131 & HN12-7197 | Fig. 1 | Fig. 2 | Fig. 3 | Fig. 5 | |
| HN12-7252 & HN12-7308 | Fig. 1 | Fig. 2 | Fig. 3 | Fig. 5 | |
| NON-responder: before and after | |||||
| HN12-6453 & HN12-6487 | Fig. 1 | Fig. 2 | Fig. 3 | Fig. 4 | Fig. 5 |
| HN12-6479 & HN12-6528 | Fig. 1 | Fig. 2 | Fig. 3 | Fig. 4 | Fig. 5 |
| HN12-6631 & HN12-6687 | Fig. 1 | Fig. 2 | Fig. 5 | ||
| HN12-6658 & HN12-6721 | Fig. 1 | Fig. 2 | Fig. 5 | ||
| HN12-6465 & HN12-6517 | Fig. 1 | Fig. 2 | Fig. 5 | ||
| HN12-6768 & HN12-6829 | Fig. 1 | Fig. 2 | Fig. 3 | Fig. 4 | Fig. 5 |
| HN12-6839 & HN12-6901 | Fig. 1 | Fig. 2 | Fig. 3 | Fig. 4 | Fig. 5 |
| HN12-6837 & HN12-6884 | Fig. 1 | Fig. 2 | Fig. 3 | Fig. 4 | Fig. 5 |
| HN12-6933 & HN12-6983 | Fig. 1 | Fig. 2 | Fig. 3 | Fig. 4 | Fig. 5 |
| HN12-6908 & HN12-6980 | Fig. 1 | Fig. 2 | Fig. 3 | Fig. 4 | Fig. 5 |
| HN12-7036 & HN12-7091 | Fig. 1 | Fig. 2 | Fig. 3 | Fig. 4 | Fig. 5 |
| HN12-7006 & HN12-7097 | Fig. 1 | Fig. 2 | Fig. 3 | Fig. 4 | Fig. 5 |
Collection and processing of PBMCs and TILs
Blood samples from cancer patients (40mL) were drawn into heparinized tubes and centrifuged on Ficoll-Hypaque gradients (GE Healthcare Bioscience). Peripheral blood lymphocytes (PBL) were recovered, washed in RPMI-1640 or AIM-V medium (Invitrogen) and stored at -80¼C for FACS analysis. For TIL isolation, tumor tissues obtained from HNSCC patients undergoing surgery were collected, placed in sterile medium and delivered to the laboratory for processing. Tumor tissues were sliced into small pieces, which then were transferred to a cell strainer (70 μm nylon) and mechanically minced using a syringe plunger. No enzymes were used for TIL recovery. The cells which passed through the cell strainer were collected and subjected to Ficoll-Hypaque gradient centrifugation. Mononuclear cells were recovered and stored at -80 °C for l FACS analysis. For pre- and post-cetuximab treatment, PBMCs and TILs were isolated from HNSCC patients before and after therapy, according to the protocol for the UPCI #08-013 trial.
Monoclonal antibodies and flow cytometry
The mAbs used to stain human immune cells included PD-1-APC (Clone: EH12.2H7, eBioscience, San Diego, CA), CTLA-4-PE (Clone: L3D10), TIM-3-Brillian violet 421 (Clone: F38-2E2), Granzyme B-FITC (Clone: GB11), Perforin-APC (Clone: dG9, Biolegend, San Diego, CA), CD3-Alexa Fluor 405 conjugate (Clone: UCHT1, Invitrogen, Grand Island, NY) and CD4-AF700 (Clone RPA-T4, BD Biosciences, San Diego, CA) and their respective isotype controls. All mAb preparations were pre-titrated using activated as well as non-activated PBMC to determine the optimal staining dilution for each. Intracellular staining for granzyme B, and perforin was performed as follows: PBMCs or TILs were stained with mAb for surface markers and subsequently fixed and permeabilized (eBioscience). After washing, cells were subjected to intracellular staining for Foxp3, granzyme B, and perforin. Flow cytometry was performed using an EPICS XL-MCL flow cytometer equipped with Expo32 software, a CyAn flow cytometer (Dako, Ft. Collins, CO) or Fortessa (Becton Dickinson) machine; data were analyzed using Summit V4.3 software or the flowJo software (TreeStar, Inc.). The acquisition and analysis gates were restricted to the lymphocyte gate based on characteristic properties of the cells in the forward and side scatter. At least 1 × 10⁵ events were acquired for analysis.
Statistical analysis
Averages were calculated as means. For non-parametric distribution of samples, p-values were calculated by Kruskal-Wallis and two-tailed exact Wilcoxon-Mann-Whitney tests or nonparametric paired test (Wilcoxon matched paired test). p values < 0.05 were considered to be significant.
Results
Increased frequency of PD-1– and TIM-3–expressing TILs after cetuximab monotherapy
When TILs isolated from HNSCC patients were analyzed for expression of the immune checkpoint receptors CTLA-4, PD-1, and TIM-3, CD8+ TILs had an expression pattern distinct from CD4+ TIL. PD-1 and TIM-3 were more predominantly expressed by CD8+ TILs than CTLA-4 (P < 0.05 and P < 0.01, respectively), whereas CTLA-4 was more frequently expressed by CD4+ TILs, than were PD-1 and TIM-3 (P < 0.01 for both) (Fig. 1A),. Analysis of co-expression pattern of these immune checkpoint receptors showed that PD-1 and TIM-3 were highly co-expressed by CD8+ TILs, whereas CTLA-4 was rarely co-expressed with PD-1 or TIM-3 on these two TIL subsets (Fig. 1B and Table 1). This tight co-expression pattern between PD-1 and TIM-3 was more tightly correlated on CD8+ TILs compared with CD4+ TILs (R2 = 0.7576 vs R2 = 0.501, Table 1). Previously, we demonstrated that majority of CTLA-4–expression CD4+ TILs were Foxp-3+ regulatory T cells in the tumor microenvironment (17).
Figure 1. PD-1/TIM-3 are co-expressed by CD8+ TILs while CTLA-4 are predominantly expressed by CD4+ TIL.

CD4+ and CD8+ TILs isolated from HNSCC patients (n = 23) were analyzed for CTLA-4, PD-1, and TIM-3 expression by flow cytometry. (A) Comparison analysis of CTLA-4, PD-1, and TIM-3 expression on CD4+ and CD8+ TILs subsets. (B) Co-expression pattern of CTLA-4, PD-1, and TIM-3 expression on CD4+ and CD8+ TILs subsets. Proportion of each subset co-expressing CTLA-4, PD-1, and/or TIM-3 is indicated in the pie diagram.
Table 1.
Correlation among CTLA-4, PD-1 and TIM-3 expressed on TILs
| CD4+ T cells | CD8+ T cells | |
|---|---|---|
| CTLA-4 and PD-1 | R2 = 0.0095 | R2 = 0.002 |
| CTLA-4 and TIM-3 | R2 = 0.0375 | R2 = 0.0093 |
| PD-1 and TIM-3 | R2 = 0.501 (P = 0.0002) | R2 = 0.7576 (P < 0.0001) |
Because cetuximab induces clinical activity with a response rate of about 15~20% for patients with HNSCC, we postulated that these immune checkpoint receptors are involved in limiting the efficacy of cetuximab therapy by inhibiting T-cell effector functions in the TME. Based on the observation that PD-1 and TIM-3 are predominantly expressed by CD8+ TILs that are effectors to eliminate tumors, we examined the frequency of PD-1– and TIM-3–expressing CD8+ TILs isolated from a cohort of patients (n = 18) who received only single-agent cetuximab in a prospective phase II clinical trial (UPCI #08-013). As expected, CTLA-4+, PD-1+, and TIM-3+CD8+ T cells are significantly and consistently enriched in TILs compared with PBLs (Fig. 2A). Treatment with single-agent cetuximab for 4 weeks significantly increased the frequency of CTLA-4+, PD-1+, and TIM-3+CD8+ TILs in the patients with HNSCC, as compared with baseline (pre-cetuximab) (P < 0.05, P = 0.008, and P = 0.021, for CTLA-4+, PD-1+, and TIM-3+CD8+ TILs, respectively) (Fig. 2B), Each CTLA-4+, PD-1+, and TIM-3+CD8+ TIL subset increased up to 14.3%, 35.7%, and 29.8%, respectively, during cetuximab monotherapy, indicating that PD-1 and TIM-3 molecules were predominantly expressed by CD8+ TILs. Additionally, the average frequency of PD-1−TIM-3− (double-negative) CD8+ TIL subsets decreased from 67.0% to 56.9%, suggesting that PD-1 and TIM-3 single-positive and double-positive cells comprise significant proportion of CD8+ TILs during cetuximab monotherapy. However, these CD8+ T-cell subsets were not increased in PBLs during the therapy. This result indicates that cetuximab therapy increased CTLA-4+, PD-1+, and TIM-3+CD8+ T cells locally in the TME, which potentially could impair effector functions such as cytokine release and cytolytic activities of CTL, contributing to suppression of cetuximab-induced antitumor immunity.
Figure 2. Cetuximab monotherapy significantly increases frequency of PD-1+ and TIM-3+CD8+ TILs isolated from 18 HNSCC patients.

PBLs and TILs were isolated from blood and tumors, respectively, of HNSCC patients at pre- and post-single-agent cetuximab therapy. (A) Representative flow cytometry analysis of CTLA-4, PD-1, and TIM-3 expression on CD8+ PBLs and TILs isolated from a HNSCC patient (pre- and post-cetuximab treatment). The numbers represent the percentages of CTLA-4, PD-1, TIM-3 single, and double positive cells in CD8+ T cells. (B) Percentages of CTLA-4+, PD-1+, TIM-3+, PD-1+TIM-3+, and PD1−TIM-3− cells in CD8+ T cells were compared in HNSCC patients at pre- and post-single agent cetuximab therapy for 18 HNSCC patients.
Increased frequency of granzyme B- and perforin-expressing CD8+ TILs after cetuximab
To characterize cytolytic phenotypes of CD8+ T cells induced during cetuximab therapy, we first analyzed base line of granzyme B and perforin expressed by CD8+ PBLs and TIL. At baseline, perforin expression was lower on CD8+ TILs compared with PBLs (P = 0.002), whereas granzyme B expression was comparable to TILs and PBLs. To investigate the effect of cetuximab monotherapy on granzyme B and perforin expressed by CD8+ T cells, paired PBLs and TILs were isolated prospectively from HNSCC patients (n = 12) treated before and after 4 weeks of single-agent cetuximab therapy (Fig. 3C–E). Cetuximab monotherapy significantly and consistently increased the frequency of granzyme B+ and perforin+ cells in CD8+ TILs (P = 0.001). This result suggests that cetuximab therapy can significantly enhance cytolytic capacity of CD8+ T cells in the TME by increasing granzyme B and perforin expression.
Figure 3. Cetuximab monotherapy significantly increases frequency of granzyme B+ and perforin+CD8+ TILs isolated from HNSCC patients.

(A) Representative flow cytometry analysis of granzyme B and perforin on CD8+ PBLs and TILs isolated from a HNSCC patient, (B) granzyme B and perforin expression comparision of paired CD8+ PBLs and TILs isolated from 10 HNSCC patients, and (C) representative flow cytometry analysis of granzyme B and perforin expression on CD8+ PBLs and TILs isolated from a HNSCC patient at pre- and post-cetuximab treatment. The numbers represent the percentages of granzyme B+perforin−, granzyme B−perforin+ and granzyme B+perforin+ cells in CD8+ T cells. (D, E) Percentages of granzyme B+ and perforin+ cells in CD8+ T cells were compared in a cohort of HNSCC patients (n = 12) pre- and post-cetuximab neoadjuvant therapy.
Cetuximab increased granzyme B and perforin expression on CD8+ TILs positive for PD-1/TIM-3
Tumor antigen–specific T cells can be generated through cetuximab-mediated cross-presentation and subsequent TCR triggering, which induces granzyme B/perforin as well as PD-1/TIM-3 molecules in T cells (19, 20). Indeed, we observed that cetuximab therapy concomitantly increased the frequency of granzyme B+/perforin+ and PD-1+/TIM-3+ cells only on CD8+ TILs (Figs. 2 and 3). Next, we investigated whether the cetuximab-increased granzyme B/perforin–expressing CD8+ TILs also co-expressed PD-1/TIM-3 molecules on their cell surface. Indeed, most granzyme B–expressing CD8+ TILs co-expressed PD-1 and/or TIM-3 on their surface, which is more evident than perforin+CD8+ TILs (Fig. 4A and B). Due to the observation that this co-expression pattern was not detected in CD8+ PBLs, we further analyzed only CD8+ TILs to investigate the correlation between PD-1/TIM-3 and granzyme B/perforin pre- and post-cetuximab monotherapy. For TIM-3+CD8+ TIL, the frequency of both granzyme B+ and perforin+ cells were increased during cetuximab monotherapy (Fig. 4C and D, P < 0.01). Regarding TIM-3−CD8+ TILs, the frequency of perforin+ cells but not granzyme B+ cells was also significantly increased during cetuximab monotherapy. Compared with TIM-3−CD8+ TIL, TIM-3+CD8+ TILs were significantly and consistently high in granzyme B and perforin expression before and after cetuximab monotherapy (P = 0.001). Cetuximab monotherapy also significantly increased the frequency of granzyme B+ cells and perforin+ cells in both PD-1+CD8+ (P < 0.05) and PD-1−CD8+ TILs (P < 0.05 and P < 0.005) (Fig. 4 E and F). Compared with PD-1−CD8+ TIL, PD-1+CD8+ TILs were consistently high in granzyme B but not perforin expression before cetuximab monotherapy (P = 0.005). Taken together, granzyme B+/perforin+ CD8+ TILs increased during cetuximab monotherapy co-expressed TIM-3 and PD-1, indicating potential roles of PD-1 and TIM-3 molecules in controlling cytolytic activities of these cetuximab-expanded CD8+ T cells and inducing immune tolerance in the TME.
Figure 4. Granzyme B+ and perforin+CD8+ TILs co-express with PD-1/TIM-3 and further increased during cetuximab monotherapy.
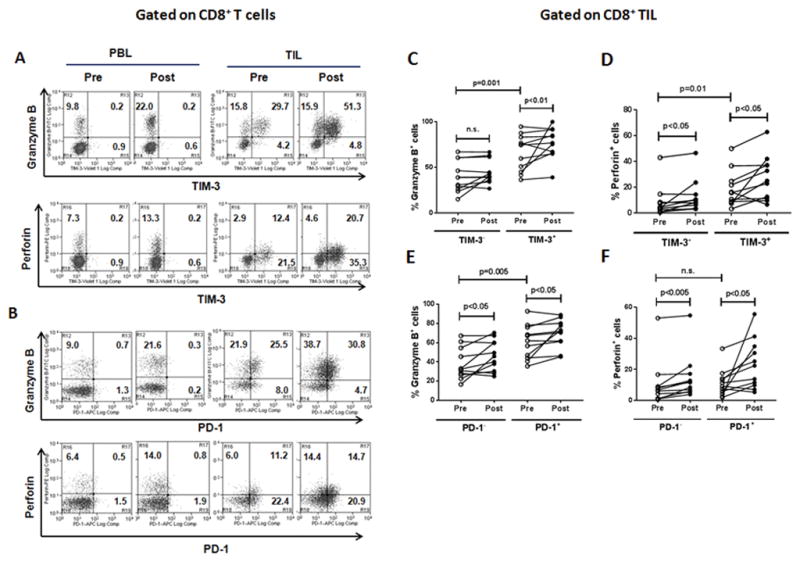
Representative flow cytometry analysis of co-expression of granzyme B/perforin and TIM-3 (A) or PD-1 (B) on CD8+ PBLs and TILs isolated from a HNSCC patient, Percentages of granzyme B+ (C and E) and perforin+ (D and F) in TIM-3− and TIM-3+ (C and D) or PD-1− and PD-1+ (E and F) CD8+ T-cell subsets were compared in 11 HNSCC patients at pre- and post-single agent cetuximab therapy.
PD-1 and TIM-3 are associated with the clinical outcome of cetuximab monotherapy
Based on the observation that PD-1 and TIM-3 are co-expressed with granzyme B and perforin on CD8+ T cells, which is further evident during cetuximab monotherapy (Fig. 4) and potentially negatively regulate antitumor immunity of CD8+ T cells (21), we hypothesized that PD-1 and TIM-3 could correlate with clinical outcome in HNSCC patients treated with cetuximab. To assess this, we compared the frequency of TIM-3+CD8+ TILs and PD-1+CD8+ TILs in objective clinical responders, based on tumor size shrinkage by comparing pre- and post-treatment CT scan, with clinical nonresponders during cetuximab monotherapy (Fig. 5A). In clinical nonresponders, the frequency of TIM-3+CD8+ TILs and PD-1+CD8+ TILs was significantly increased during cetuximab neoadjuvant therapy (P = 0.016 and P = 0.009, respectively) (Fig. 5B and C). However, the frequency of these same CD8+ TILs subsets in clinical responders was not significantly changed during cetuximab monotherapy. Taken together, these results suggest that frequency of TIM-3+CD8+ TILs and PD-1+CD8+ TILs negatively impacts on the efficacy of cetuximab monotherapy and provide a rationale to combine TIM-3 or PD-1 blockade with cetuximab therapy to improve clinical outcome for HNSCC patients.
Figure 5. Increased the frequency of PD-1+ and TIM-3+CD8+ TILs is inversely correlated with clinical outcome in cetuximab monotherapy.
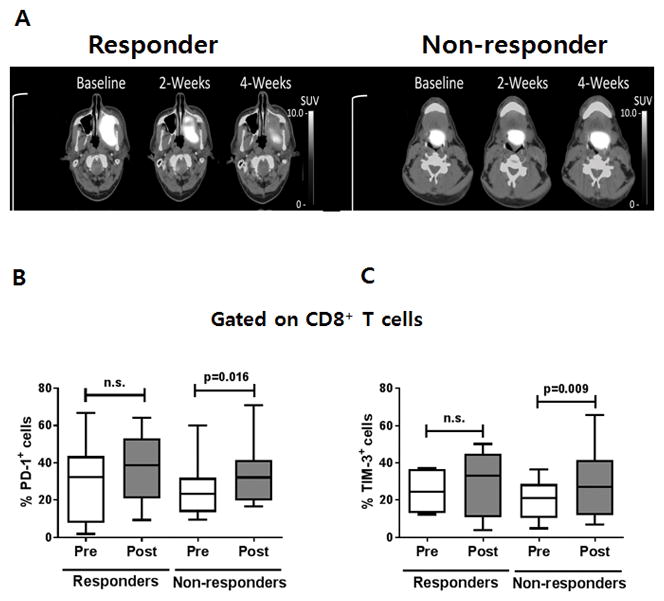
(A) Representative PET/CT scanning results of a responder and a non-responder during cetuximab monotherapy clinical trial (UPCI-#08-013). The frequency of (B) PD-1+ or (C) TIM-3+ cells in CD8+ TILs was measured using flow cytometry and compared in pre- and post single-agent cetuximab monotherapy for 5 responders and 13 non-responders, respectively.
Discussion
In this report, we demonstrate that the frequency of PD-1+CD8+ T and TIM-3+CD8+ T cells in the TME of the HNSCC patients increased during cetuximab monotherapy. We also observed that the frequency of granzymeB+ and perforin+ cells was also concomitantly increased in these CD8+ TILs, which also co-expressed PD-1 and TIM-3. These results indicate that activated CD8+ TILs are increased at the tumor sites during cetuximab therapy and may be controlled or suppressed of their cytolytic activity by PD-1 and/or TIM-3 in the TME. More importantly, PD-1+CD8+ and TIM-3+CD8+ TILs increased after cetuximab treatment were strongly associated with clinical outcome in these patients. Taken together, these results suggest that combination therapy using blockade of PD-1 or TIM-3 in the cetuximab therapy might improve clinical outcome of cetuximab-treated HNSCC patients by breaking immune tolerance induced by these cetuximab-induced immune checkpoint receptors on CD8+ TILs in the TME.
We speculate that T-cell activation takes places through TCR triggering in the TME, which is presumably enhanced by cetuximab-mediated cross-presentation (22), contributing to increase of PD-1+ and TIM-3+CD8+ TIL subsets. Previously, we reported that cetuximab therapy significantly increases the frequency of tumor antigen-specific CD8+ T cells in HNSCC patients (20). In this report, we also demonstrated that cetuximab-activated NK cells subsequently induced DC maturation by producing IFNγ. Based on these observations, we expect that cross-presentation function of DC might be enhanced by cetuximab treatment, thus contributing to activation and expansion of tumor antigen-specific T cells in the TME of head and neck cancer patients. Indeed, we also have observed that the frequency of CD137+ and CD107a+ intratumoral NK cells was increased during cetuximab monotherapy, confirming that NK cells are activated in the TME of the HNSCC patients treated with cetuximab (17). Given that granzyme B/perforin as well as PD-1/TIM-3 are induced upon T-cell activation, cetuximab therapy activates CD8+ T cells in the TME. Taken together these results support the idea that CD8+ T-cell activation actively takes place in the TME presumably through cetuximab-promoting cross-presentation.
It has been proposed that chronic antigen stimulation such as in chronic virus infection or tumors, leading to upregulation of immune checkpoint receptors associated with T-cell exhaustion, a hypo-responsive status of T cells (23). However, it is challenging to define the most important functions of T cells expressing immune checkpoint receptors in artificial tumor models. Several lines of research showed that tumor antigen-specific CD8+ TILs expressing high levels of PD-1 are defined as functionally impaired T cells in the TME (24–26). However, it was reported that the frequency of PD-1+ TILs positively correlated with a better clinical outcome in HPV-associated head and neck cancer patients (27). In this paper, treatment with cancer vaccine increases frequency of PD-1+ TILs and combination therapy using PD-1 blockade enhances antitumor activity, suggesting that PD-1+ TILs could be reactivated by PD-1 blockade (27). Regarding the roles of TIM-3 on TIL functions, the majority of TIM-3+ TILs were found to co-express PD-1 in both mouse bearing tumors (9) and melanoma patients (1). In the mouse tumor model, TIM-3+PD-1+ TILs were defined as severely exhausted cells based on their impaired capability to proliferate and produce cytokines including IL2, TNFα, and IFNγ. However, PD-1+CD8+ and TIM-3+CD8+ TILs in melanoma patients, but not PD-1−CD8+ and TIM-3−CD8+ TIL, are capable to recognize and lyse autologous tumor and react to tumor-derived mutated antigen. Importantly, blockade of TIM-3 led to rejection of carcinogen-induced sarcomas by producing IFNγ in preclinical model (28), and in response to antigen stimulation, it enhanced cytokine productions and expansion of tumor antigen-specific CD8+ T cells isolated from melanoma patients (13). Although TIM-3+CD8+ T cells express high level of perforin as well as T-bet in HIV infection, they are impaired in their degranulation capacity (29). In this study, blockade of TIM-3 increased the cytotoxicity of TIM-3+CD8+ T cells to lyse CD4 T cells expressing HIV antigens by enhancing degranulation (release) of granzyme B and perforin. Thus, TIM-3 may negatively control cytotoxicity of CD8+ T cells by inhibiting degranulation of granzyme B and perforin. These two studies imply that TIM-3+CD8+ T cells are activated cells but are suppressed in their cytolytic activity by TIM-3 molecules. Therefore, they might be recovered from the suppressed status and re-activated upon antigenic stimulation by using blockade of TIM-3.
In our study, granzyme B was co-expressed with 60~70 % of TIM-3+CD8+ and PD-1+CD8+ TILs , whereas this cytolytic molecule was not expressed by 20~30 % of TIM-3+CD8+ and PD-1+CD8+ TILs. Given the amount of granzyme B indicates cytolytic ability of activated CD8+ T cells, TIM-3+CD8+ and PD-1+CD8+ TILs co-expressing granzyme B could be defined as activated cells in the TME and have the potential to be re-activated using blockade of PD-1 or TIM-3. Additionally, PD-1+CD8+ and TIM-3+CD8+ TILs, compared with their negative counterparts, contain significantly more granzyme B+ and perforin+ cells both before and after cetuximab monotherapy. Our results also show that these activated CD8+ T cells increased and co-expressed PD-1 and TIM-3 in the TME during cetuximab monotherapy, suggesting that their cytolytic activities are being dampened. Hence, these results provide us with insight into understanding dysfunction of CD8+ T cells induced by PD-1 and TIM-3 in the TME during cetuximab therapy as well as provide a rationale to combine cetuximab therapy with blockade of PD-1 and/or TIM-3 to improve clinical outcome for HNSCC patients.
Acknowledgments
Grant Support
This work was supported by National Institute of Health grants R01 DE019727, P50 CA097190, CA206517, and University of Pittsburgh Cancer Institute grant P30CA047904.
We acknowledge excellent technical assistance from Michael Meyer, and Bratislav Janjic, University of Pittsburgh Cancer Institute. We thank Ferris lab members for helpful suggestions.
Footnotes
Disclosure of Potential Conflicts of Interest
No potential conflicts of interest disclosed
References
- 1.Gros A, Robbins PF, Yao X, Li YF, Turcotte S, Tran E, Wunderlich JR, Mixon A, Farid S, Dudley ME, et al. PD-1 identifies the patient-specific CD8(+) tumor-reactive repertoire infiltrating human tumors. The Journal of clinical investigation. 2014;124(5):2246–59. doi: 10.1172/JCI73639. [DOI] [PMC free article] [PubMed] [Google Scholar]
- 2.Jie HB, Gildener-Leapman N, Li J, Srivastava RM, Gibson SP, Whiteside TL, Ferris RL. Intratumoral regulatory T cells upregulate immunosuppressive molecules in head and neck cancer patients. Br J Cancer. 2013;109(10):2629–35. doi: 10.1038/bjc.2013.645. [DOI] [PMC free article] [PubMed] [Google Scholar]
- 3.Joyce JA, Fearon DT. T cell exclusion, immune privilege, and the tumor microenvironment. Science. 2015;348(6230):74–80. doi: 10.1126/science.aaa6204. [DOI] [PubMed] [Google Scholar]
- 4.Jiang Y, Li Y, Zhu B. T-cell exhaustion in the tumor microenvironment. Cell death & disease. 2015;6:e1792. doi: 10.1038/cddis.2015.162. [DOI] [PMC free article] [PubMed] [Google Scholar]
- 5.Chen L, Han X. Anti-PD-1/PD-L1 therapy of human cancer: past, present, and future. The Journal of clinical investigation. 2015;125(9):3384–91. doi: 10.1172/JCI80011. [DOI] [PMC free article] [PubMed] [Google Scholar]
- 6.Chemnitz JM, Parry RV, Nichols KE, June CH, Riley JL. SHP-1 and SHP-2 associate with immunoreceptor tyrosine-based switch motif of programmed death 1 upon primary human T cell stimulation, but only receptor ligation prevents T cell activation. J Immunol. 2004;173(2):945–54. doi: 10.4049/jimmunol.173.2.945. [DOI] [PubMed] [Google Scholar]
- 7.Swaika A, Hammond WA, Joseph RW. Current state of anti-PD-L1 and anti-PD-1 agents in cancer therapy. Molecular immunology. 2015;67(2 Pt A):4–17. doi: 10.1016/j.molimm.2015.02.009. [DOI] [PubMed] [Google Scholar]
- 8.Ferris RL, Blumenschein G, Jr, Fayette J, Guigay J, Colevas AD, Licitra L, Harrington K, Kasper S, Vokes EE, Even C, et al. Nivolumab for Recurrent Squamous-Cell Carcinoma of the Head and Neck. N Engl J Med. 2016;375(19):1856–67. doi: 10.1056/NEJMoa1602252. [DOI] [PMC free article] [PubMed] [Google Scholar]
- 9.Sakuishi K, Apetoh L, Sullivan JM, Blazar BR, Kuchroo VK, Anderson AC. Targeting Tim-3 and PD-1 pathways to reverse T cell exhaustion and restore anti-tumor immunity. The Journal of experimental medicine. 2010;207(10):2187–94. doi: 10.1084/jem.20100643. [DOI] [PMC free article] [PubMed] [Google Scholar]
- 10.Chiba S, Baghdadi M, Akiba H, Yoshiyama H, Kinoshita I, Dosaka-Akita H, Fujioka Y, Ohba Y, Gorman JV, Colgan JD, et al. Tumor-infiltrating DCs suppress nucleic acid-mediated innate immune responses through interactions between the receptor TIM-3 and the alarmin HMGB1. Nature immunology. 2012;13(9):832–42. doi: 10.1038/ni.2376. [DOI] [PMC free article] [PubMed] [Google Scholar]
- 11.Huang YH, Zhu C, Kondo Y, Anderson AC, Gandhi A, Russell A, Dougan SK, Petersen BS, Melum E, Pertel T, et al. CEACAM1 regulates TIM-3-mediated tolerance and exhaustion. Nature. 2015;517(7534):386–90. doi: 10.1038/nature13848. [DOI] [PMC free article] [PubMed] [Google Scholar]
- 12.Zhu C, Anderson AC, Schubart A, Xiong H, Imitola J, Khoury SJ, Zheng XX, Strom TB, Kuchroo VK. The Tim-3 ligand galectin-9 negatively regulates T helper type 1 immunity. Nature immunology. 2005;6(12):1245–52. doi: 10.1038/ni1271. [DOI] [PubMed] [Google Scholar]
- 13.Fourcade J, Sun Z, Benallaoua M, Guillaume P, Luescher IF, Sander C, Kirkwood JM, Kuchroo V, Zarour HM. Upregulation of Tim-3 and PD-1 expression is associated with tumor antigen-specific CD8+ T cell dysfunction in melanoma patients. J Exp Med. 2010;207(10):2175–86. doi: 10.1084/jem.20100637. [DOI] [PMC free article] [PubMed] [Google Scholar]
- 14.Li J, Shayan G, Avery L, Jie H-B, Gildener-Leapman N, Schmitt N, Lu B, Kane LP, Ferris RL. Tumor-infiltrating Tim-3+ T cells proliferate avidly except when PD-1 is co-expressed: evidence for intracellular cross talk. Oncoimmunology. 2016 doi: 10.1080/2162402X.2016.1200778. in press. [DOI] [PMC free article] [PubMed] [Google Scholar]
- 15.Shayan G, Srivastava R, Li J, Schmitt N, Kane LP, Ferris RL. Adaptive resistance to anti-PD1 therapy by Tim-3 upregulation is mediated by the PI3K-Akt pathway in head and neck cancer. Oncoimmunology. 2017;6(1):e1261779. doi: 10.1080/2162402X.2016.1261779. [DOI] [PMC free article] [PubMed] [Google Scholar]
- 16.Fridman WH, Pages F, Sautes-Fridman C, Galon J. The immune contexture in human tumours: impact on clinical outcome. Nature reviews Cancer. 2012;12(4):298–306. doi: 10.1038/nrc3245. [DOI] [PubMed] [Google Scholar]
- 17.Jie HB, Schuler PJ, Lee SC, Srivastava RM, Argiris A, Ferrone S, Whiteside TL, Ferris RL. CTLA-4(+) Regulatory T Cells Increased in Cetuximab-Treated Head and Neck Cancer Patients Suppress NK Cell Cytotoxicity and Correlate with Poor Prognosis. Cancer Res. 2015;75(11):2200–10. doi: 10.1158/0008-5472.CAN-14-2788. [DOI] [PMC free article] [PubMed] [Google Scholar]
- 18.Lopez-Albaitero A, Mailliard R, Hackman T, Andrade Filho PA, Wang X, Gooding W, Ferrone S, Kalinski P, Ferris RL. Maturation pathways of dendritic cells determine TAP1 and TAP2 levels and cross-presenting function. Journal of immunotherapy. 2009;32(5):465–73. doi: 10.1097/CJI.0b013e3181a1c24e. [DOI] [PMC free article] [PubMed] [Google Scholar]
- 19.Ferris RL, Lu B, Kane LP. Too much of a good thing? Tim-3 and TCR signaling in T cell exhaustion. Journal of immunology. 2014;193(4):1525–30. doi: 10.4049/jimmunol.1400557. [DOI] [PMC free article] [PubMed] [Google Scholar]
- 20.Srivastava RM, Lee SC, Andrade Filho PA, Lord CA, Jie HB, Davidson HC, Lopez-Albaitero A, Gibson SP, Gooding WE, Ferrone S, et al. Cetuximab-activated natural killer and dendritic cells collaborate to trigger tumor antigen-specific T-cell immunity in head and neck cancer patients. Clinical cancer research : an official journal of the American Association for Cancer Research. 2013;19(7):1858–72. doi: 10.1158/1078-0432.CCR-12-2426. [DOI] [PMC free article] [PubMed] [Google Scholar]
- 21.Zhou Q, Munger ME, Veenstra RG, Weigel BJ, Hirashima M, Munn DH, Murphy WJ, Azuma M, Anderson AC, Kuchroo VK, et al. Coexpression of Tim-3 and PD-1 identifies a CD8+ T-cell exhaustion phenotype in mice with disseminated acute myelogenous leukemia. Blood. 2011;117(17):4501–10. doi: 10.1182/blood-2010-10-310425. [DOI] [PMC free article] [PubMed] [Google Scholar]
- 22.Lee SC, Srivastava RM, Lopez-Albaitero A, Ferrone S, Ferris RL. Natural killer (NK): dendritic cell (DC) cross talk induced by therapeutic monoclonal antibody triggers tumor antigen-specific T cell immunity. Immunologic research. 2011;50(2–3):248–54. doi: 10.1007/s12026-011-8231-0. [DOI] [PMC free article] [PubMed] [Google Scholar]
- 23.Blackburn SD, Shin H, Haining WN, Zou T, Workman CJ, Polley A, Betts MR, Freeman GJ, Vignali DA, Wherry EJ. Coregulation of CD8+ T cell exhaustion by multiple inhibitory receptors during chronic viral infection. Nature immunology. 2009;10(1):29–37. doi: 10.1038/ni.1679. [DOI] [PMC free article] [PubMed] [Google Scholar]
- 24.Ahmadzadeh M, Johnson LA, Heemskerk B, Wunderlich JR, Dudley ME, White DE, Rosenberg SA. Tumor antigen-specific CD8 T cells infiltrating the tumor express high levels of PD-1 and are functionally impaired. Blood. 2009;114(8):1537–44. doi: 10.1182/blood-2008-12-195792. [DOI] [PMC free article] [PubMed] [Google Scholar]
- 25.Baitsch L, Baumgaertner P, Devevre E, Raghav SK, Legat A, Barba L, Wieckowski S, Bouzourene H, Deplancke B, Romero P, et al. Exhaustion of tumor-specific CD8(+) T cells in metastases from melanoma patients. The Journal of clinical investigation. 2011;121(6):2350–60. doi: 10.1172/JCI46102. [DOI] [PMC free article] [PubMed] [Google Scholar]
- 26.Lyford-Pike S, Peng S, Young GD, Taube JM, Westra WH, Akpeng B, Bruno TC, Richmon JD, Wang H, Bishop JA, et al. Evidence for a role of the PD-1:PD-L1 pathway in immune resistance of HPV-associated head and neck squamous cell carcinoma. Cancer Res. 2013;73(6):1733–41. doi: 10.1158/0008-5472.CAN-12-2384. [DOI] [PMC free article] [PubMed] [Google Scholar]
- 27.Badoual C, Hans S, Merillon N, Van Ryswick C, Ravel P, Benhamouda N, Levionnois E, Nizard M, Si-Mohamed A, Besnier N, et al. PD-1-expressing tumor-infiltrating T cells are a favorable prognostic biomarker in HPV-associated head and neck cancer. Cancer Res. 2013;73(1):128–38. doi: 10.1158/0008-5472.CAN-12-2606. [DOI] [PubMed] [Google Scholar]
- 28.Ngiow SF, von Scheidt B, Akiba H, Yagita H, Teng MW, Smyth MJ. Anti-TIM3 antibody promotes T cell IFN-gamma-mediated antitumor immunity and suppresses established tumors. Cancer research. 2011;71(10):3540–51. doi: 10.1158/0008-5472.CAN-11-0096. [DOI] [PubMed] [Google Scholar]
- 29.Sakhdari A, Mujib S, Vali B, Yue FY, MacParland S, Clayton K, Jones RB, Liu J, Lee EY, Benko E, et al. Tim-3 negatively regulates cytotoxicity in exhausted CD8+ T cells in HIV infection. PloS one. 2012;7(7):e40146. doi: 10.1371/journal.pone.0040146. [DOI] [PMC free article] [PubMed] [Google Scholar]