Abstract
Accurate tumor segmentation in PET is crucial in many oncology applications. We developed an adaptive region-growing (ARG) algorithm with a maximum curvature strategy (ARG_MC) for tumor segmentation in PET. The ARG_MC repeatedly applied a confidence connected region-growing (CCRG) algorithm with increasing relaxing factor f. The optimal relaxing factor (ORF) was then determined at the transition point on the f-volume curve, where the volume just grew from the tumor into the surrounding normal tissues. The ARG_MC along with five widely used algorithms were tested on a phantom with 6 spheres at different signal to background ratios and on two clinic datasets including 20 patients with esophageal cancer and 11 patients with non-Hodgkin lymphoma (NHL). The ARG_MC did not require any phantom calibration or any a priori knowledge of the tumor or PET scanner. The identified ORF varied with tumor types (mean ORF = 9.61, 3.78 and 2.55 respectively for the phantom, esophageal cancer, and NHL datasets), and varied from one tumor to another. For the phantom, the ARG_MC ranked the second in segmentation accuracy with an average Dice similarity index (DSI) of 0.86, only slightly worse than Daisne’s adaptive thresholding method (DSI=0.87), which required phantom calibration. For both the esophageal cancer dataset and the NHL dataset, the ARG_MC had the highest accuracy with an average DSI of 0.87 and 0.84, respectively. The ARG_MC was robust to parameter settings and region of interest selection, and it did not depend on scanners, imaging protocols, or tumor types. Furthermore, the ARG_MC made no assumption about the tumor size or tumor uptake distribution, making it suitable for segmenting tumors with heterogeneous FDG uptake. In conclusion, the ARG_MC was accurate, robust and easy to use, it provides a highly potential tool for PET tumor segmentation in clinic.
Keywords: 18F-FDG PET, adaptive region growing, optimal relaxing factor, segmentation, f-volume curve, local maximum curvature
1. INTRODUCTION
Positron emission tomography (PET) can quantify physiological and biochemical processes in a highly sensitive non-invasive way, and allows earlier diagnosis and better management of oncology patients, in contrast to anatomical imaging approaches. PET have been widely used for fundamental research and clinic applications nowadays[1].
Accurate tumor segmentation in PET plays an important role in many oncology applications, including diagnosis, prognosis[2], radiation therapy[3, 4], and treatment response assessment[5–7]. In PET-based intensity-modulated radiation therapy, accurate delineation of tumor volume can potentially reduce collateral damage to surrounding normal tissues and ensure the maximum dose delivered to the active disease[8]. Recently, computerized PET/CT image analysis was proposed to extract various volumetric image features (radiomics) for the evaluation of tumor response[5, 6, 9, 10]. Such analysis relied on an accurate delineation of the tumor volume.
PET is typically of low spatial resolution and high noise, which makes accurate tumor delineation challenging[11, 12]. A number of advanced automatic segmentation methods, such as variational methods[13], supervised and unsupervised learning[14–16], stochastic modeling[17, 18], have been adopted for tumor segmentation in PET[19, 20]. For example, Zeng et al. used an anisotropic diffusion filter to remove image noise and then applied a hierarchical active surface modeling scheme to segment tumors[14]. Geets et al. proposed a gradient-based watershed method to segment laryngeal tumors[21]. Hatt et al. developed a fuzzy locally adaptive Bayesian (FLAB) algorithm and showed that it was more accurate than the fuzzy hidden Markov chains (FHMC) and the fuzzy C-Means (FCM) algorithms[22]. Li et al. proposed a variational method with multiple regularizations for simultaneous image restoration, tumor segmentation and blur kernel estimation [23]. Although being able to provide high accuracy, these advanced methods can be sensitive to user inputs and computationally intensive, which make them less attractive in the clinic [19].
Interestingly, the most widely used automatic PET tumor segmentation methods in the clinic is the simple thresholding method, which is easy to use, objective and shows reasonable accuracy once an optimal threshold is identified [12]. By contrast, the manual delineation by experienced physicians in the clinic is typically fastidious and subjective, and suffers from a high intra- and inter- observer variability [24]. Identification of the optimal threshold has been intensively investigated[25–32]. For example, Daisne et al. proposed an adaptive thresholding method that computed the optimal threshold as a function of signal to background ratio (SBR) [25]. Jentzen et al. developed a series of calibrated threshold-volume curves under different SBRs from phantom studies, and proposed an iterative method to find the optimal threshold [27]. Prieto et al. reviewed and implemented a spectrum of classical automated thresholding algorithms for tumor segmentation in PET[33].
There are however limitations of thresholding methods — they often fail to segment a tumor with heterogeneous uptake and they do not maintain spatial connectivity of the segmented volume. In this study, we proposed and validated a novel automatic method termed adaptive region-growing with maximum curvature strategy (ARG_MC). This method is easy to implement and overcomes the aforementioned limitations.
2. METHODS AND MATERIALS
2.A. Confidence connected region growing (CCRG)
Region-growing starts from a seed region inside an object and progressively appends the connected neighboring voxels to the current region if they satisfy certain region membership criterion [34]. Let I(X) represents the image intensity at X. The region membership criterion for region-growing can be simply a fixed interval: I(X) ∈ [lower threshold, upper threshold], or a confidence interval[35, 36]:
| (1) |
where m and σ are, respectively, the mean and standard deviation of the intensities for all voxels in the current region, and f is a relaxing factor defined by users. The confidence connected region-growing (CCRG) iteratively considers the statistics of the current region and therefore is advantageous over the fixed-interval region-growing. However it is challenging to determine an optimal relaxing factor (ORF) for all objects because a small f restricts the inclusion of voxels to only those having very similar intensities to the current region and thus may result in undergrowth; while a large f relaxes the inclusion condition and thus may result in overgrowth to neighboring regions or background.
In a study that applied CCRG for PET tumor segmentation in rectal and anal cancer, Day et al. determined the ORF using phantom calibrations[35]. They applied the CCRG to the phantom images and modified f until the resulting volume matched the known phantom volume. They found that ORF ranged from 2.0 to 2.56 and varied with many factors, including scanner and reconstruction protocol, tumor properties, seed voxel intensity, and whether the tumor was close to an area of high uptake[35]. In their method, additional phantom calibrations would be needed to determine the ORF for different scanners.
2.B. Adaptive region growing (ARG)
We developed an adaptive region-growing (ARG) algorithm to automatically and specifically determine the ORF for each tumor. Firstly, a rough rectangular region of interest (ROI) was manually drawn to enclose the tumor (Fig. 1(a)). Secondly, the CCRG was repeatedly applied to segment the tumor with a relaxing factor f selected from the set F= {0, Δf, 2Δf, …, B}, where Δf and B are respectively the discretization step and upper bound of f. This generated a set of CCRG-segmented volumes (V). Thirdly, V was plotted as a function of F and an f-volume curve was obtained (Fig. 1(b)). The f-volume curve showed that when f was increased, V increased monotonically and gradually until a sharp increase was observed before transitioning into a plateau region corresponding to the entire ROI. Because the surrounding normal tissues or the background of a tumor in PET typically consists of large regions with relatively homogeneous uptake/intensity, the sharp increase corresponded to where the CCRG-segmented volume grew from the tumor into the background. Thus, the relaxing factor f* just before the sharp increase provided the ORF for segmenting the tumor. We termed this algorithm adaptive region-growing (ARG) since the ORF was specifically determined for each tumor based on its f-volume curve, which depended on the tumor size, tumor uptake distribution and the uptake difference between the tumor and its background. In our previous work, the ORF was determined as one Δf before the point with the maximum derivative (MD) on the f-volume curve (Fig. 2(c), ARG_MD) [37]. In PET images, the tumor boundary is usually blurred because of the low spatial resolution of the PET scanner, physics of PET, and motion (respiratory, cardiac, and patient motion). As a result, the ARG_MD method tended to overestimate the tumor volume since the MD point generally occurred around the middle rather than the beginning of the sharp volume increase (Fig. 2(c)). A dual-front active contour model had to be used to refine the segmentation results of the ARG_MD [37]. In addition, the derivative of the f-volume curve was noisy because it was calculated with numerical difference operations on a discrete curve (Fig. 2(c)). Finally, the resulting ORF depended to a certain degree on the discretization step Δf.
FIG. 1.

(a) An esophageal tumor (bright yellow) with a manually drawn ROI (red square) in a fused PET/CT image; and (b) its f-volume curve
FIG. 2.
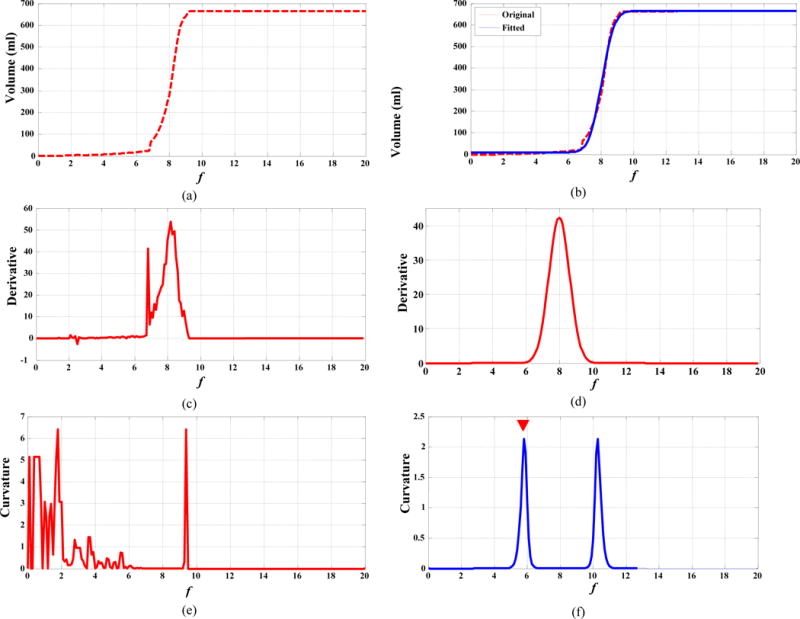
(a, c, e): f-volume curve for an esophageal tumor, its derivative, and its Menger curvature, respectively; (b, d, f): the fitted f-volume curve (blue line), its derivative, and its Menger curvature, respectively.
To overcome these issues, we developed an improved ARG algorithm that (1) smoothed the original f-volume curves, and (2) automatically determined the ORF with a maximum curvature (MC) approach. We observed that there were two transition points on the f-volume curve in Fig. 1(b). The first one was the transition from the gradual-increase part of the curve to the beginning of the sharp volume increase, and the second one was the transition from the end of the sharp volume increase to the plateau region where CCRG had enclosed all voxels within the ROI. Theoretically, these transition points can be identified as points with local MC. However, the curvature computed from a digital curve is generally unstable and sensitive to noise, as shown in Fig. 2(e). Therefore, we first fitted the original f-volume curve using a smooth function and then computed the curvature on the smoothed curve. The fitting function was:
| (2) |
where , is the error function, and a, b, c, and d are fitting parameters.
Curvature reflects the bending degree of a curve. Different methods are available to approximate the curvature for a digital curve. In this study, we used the Menger curvature to identify the transition points along the smoothed f-volume curve. Menger curvature is defined for a triad of points in n-dimensional Euclidean space Rn as the reciprocal of the radius of the circle that passes through the three points [38]. In our case, let (f1, v1), (f2, v2), and (f3, v3) be three such adjacent points on the f-volume curve. Menger curvature K is four times the area of the triangle formed by the three points divided by the product of its three sides:
| (3) |
Figure 2 displays the original f-volume curve vs. the fitted, smoothed f-volume curve, along with their derivative and curvature. The average fitting error (defined as |original curve – fitted curve|2/|fitted curve|2×100%) was small (at 6%) for all tested datasets. The derivative and curvature became much more stable with minimal noise after the fitting process. Now the two transition points were identified as the local MC points with the two largest curvatures, and the ORF was identified at the first of the two transition points (Fig. 2(f)). Using the ORF in the CCRG provided the final PET tumor segmentation. We termed this algorithm ARG with MC strategy (ARG_MC) and summarized it as below:
| Adaptive Region-Growing with Maximum Curvature Strategy (ARG_MC) Algorithm: |
| V = ARG_MC (I, ROI) |
Input:
|
Set parameters:
|
|
Iteration: For f = 0: Δf: B Obtain the CCRG-segmented volume at f: V(f) = CCRG(I, f, ROI); End |
| Determine ORF: |
|
Output: Final segmentation V = CCRG(I, ORF, ROI). |
Note that the CCRG itself is an iterative process. Our implementation of the CCRG algorithm is illustrated in the Appendix.
2.C. Validation study
2.C.1. Phantom and patient datasets
This retrospective study was approved by the University of Maryland Baltimore Institutional Review Board. The validation study was conducted on a phantom and two clinic datasets with different tumor types and imaged using different scanners, with a goal of examining whether the proposed method is scanner- or tumor-type dependent.
The phantom consisted of a cylindrical container with six spheres of different diameters in it [37]. The volumes of these six spheres are 20, 16, 12, 6, 1 and 0.5 mL, respectively. The phantom was scanned using a PET/CT scanner (Biograph-40 True Point/True View (Siemens Medical Solutions Inc., Knoxville, TN), with a detector ring of 84.2 cm diameter. All images were acquired in 3D mode (no septa). To generate various SBRs, the spheres contained 11C (half life =20.38 min) solution as sources, while the cylindrical container contained 18F-FDG (half life=109.77 min) solution as the background. The initial 11C activity concentration was 3.627 μCi/ml and the initial 18F-FDG activity concentration was 0.224 μCi/ml. PET images at six SBR levels (16:1, 12:1, 8:1, 6:1, 4:1, and 2:1) were reconstructed using the iterative Ordered Subset Expectation Maximization algorithm (OSEM) [39], with a voxel size of 4.1×4.1×2.0 mm3.
The first clinic dataset included 20 patients with esophageal cancer, imaged using a Philips 16-slice Gemini PET/CT scanner (Philips Medical Systems; Cleveland, OH). Following an institutional standard protocol, patients fasted for a minimum of 4 hours before intravenous injection of 12–14 mCi 18F-FDG. Whole-body PET and CT imaging began 60 minutes after injection. PET images were attenuation corrected and reconstructed with a maximum likelihood algorithm, with a voxel size of 4.0 × 4.0 × 4.0 mm3. The reference tumor volume was manually delineated by an experienced radiation oncologist using the complementary visual features of PET and CT following the approach in [40]. A visual interpretation of the PET image was used to determine the nature of each lesion, and the CT image was used to determine its anatomical boundary (e.g., outer wall of esophagus, or radial extent of primary tumor).
The second dataset included 11 patients with non-Hodgkin lymphoma (NHL), imaged using a GE Advance PET scanner (General Electric Medical Systems; Milwaukee, WI)[41]. Each patient was scanned 1 hour after the intravenous injection of 10 mCi activity of 18F-FDG, and whole-body PET images were reconstructed using a maximum likelihood algorithm with a voxel size of 4.3 × 4.3×4.3 mm3. Tumors in this dataset exhibited large variations in size, shape, and intensity. Each tumor was manually delineated three times per reviewer by five experienced nuclear medicine physicians, slice-by-slice, on the coronal PET images[41]. The reference tumor volume was computed from the 15 manual delineations using a voting strategy (i.e., a voxel belonged to a tumor if and only if it was considered as a tumor voxel at least eight times).
2.C.2. Algorithms for comparison
For comparison, three strategies for determining the ORF in CCRG were tested: ARG_MC (maximum curvature), ARG_MD (maximum derivative)[37], and CCRG_2.5 (fixed ORF=2.5)[35]. Thresholding with 42% and 50% of SUVmax in the tumor, Otsu automatic thresholding[42], fuzzy C-mean clustering (FCM)[43], active contours (AC)[44], geodesic active contours (GAC)[45], and graph cut (GC)[46] were also tested. 42% Threshold and 50% Threshold are widely used automatic methods for PET tumor segmentation. Otsu ranked as the best in the twelve thresholding methods tested in Prieto et al.[33]. The four advanced methods (FCM, AC, GAC, and GC) are among the most widely used ones for general image segmentation, and provide decent accuracy once their parameters are properly selected.
FCM is a classical image segmentation method based on fuzzy set theory [47]. A two-class FCM was used in our experiment with the fuzzy exponent set to 0.5. The two-class FCM segments tumor (foreground) from non-tumor (background) by iteratively comparing the distance of the uptake of each voxel to two evolving fuzzy cluster centers. AC [44] simplifies the Mamford-Shah model by assuming that the image is a stepwise function. It is an area-based level set method that does not depend on image gradient. GAC [45] is an edge-based level set method. It detects object boundary based on the computation of geodesic in a Riemannian space. In our experiments, to obtain decent accuracy for both AC and GAC, an initial contour near the target boundary was manually drawn in the ROI. GC is a graph-based image segmentation method, which looks for an optimal cut with the smallest cost to divide the nodes in a graph into two sets: foreground and background. The max-flow GC algorithm[46] was used in our experiments. The main limitation of these advanced methods is that the segmentation accuracy is sensitive to both the parameter settings and the contour initialization. In our experiments, the parameters for each advanced method were carefully optimized in a manual way.
In the phantom study, Daisne’s adaptive thresholding method [25] and Jenzten’s iterative thresholding method [27] were also tested for comparison. Daisne method computes the threshold as [25], and Jenzten method computes the threshold as , where V is the object volume, and is updated iteratively in the segmentation process [27]. Both methods are dependent on PET scanners, and phantom calibrations are required to optimize their parameters a, b or c for different imaging settings[25, 27]. In our phantom experiment, three PET images with SBR of 12:1, 6:1, and 2:1 were used for calibrating: i.e., determining these parameters using curve fitting methods, while the other three images with SBR of 16:1, 8:1, and 4:1 were used for testing.
2.C.3. Criteria for validation
Dice similarity index (DSI) was calculated to evaluate the segmentation accuracy. DSI measures the ratio of the overlapping regions between the estimated volume VA, obtained by a segmentation method, and the reference volume VR:
| (4) |
DSI ranges from 0 (no spatial overlap) to1 (perfect segmentation).
In addition to segmentation accuracy, the robustness of each segmentation method to the ROI selection was evaluated using the interrun variation (τ)[24, 48, 49]. For this purpose, a sufficiently large ROI (though without including other organs of high uptake) and a sufficiently small ROI (merely enclosed the whole tumor) were manually selected for each tumor. Six other ROIs were automatically produced with dimensions equally spaced between the sufficiently large ROI and the sufficiently small ROI. In this way, a total of eight ROIs were obtained for each tumor. For any tested method, each tumor was segmented eight times with different ROIs. The interrun variation in DSI is defined as:
| (5) |
where Q is the number of ROIs (Q=8), (k=p or q) is the value of DSI of one tested method on the ith image segmented with the kth ROI, N is the number of images or patients (N=3, 20, and 11, for the phantom and two clinic datasets, respectively), and . The interrun variation denotes the average of all DSI differences among the eight different ROIs for the same segmentation method. A smaller interrun variation ( ) indicates that the method is more robust to the ROI selection.
3. RESULTS
3.A. Segmentation accuracy
Figure 3(a) displays the DSI, averaged over all SBR levels (16:1, 8:1, and 4:1) and all sphere sizes in the phantom study. Among all tested methods, Daisne method [25] had the highest accuracy (DSI=0.88). Note that both Daisne method [25] and Jenzten method [27] required previous scanner calibrations. The proposed ARG_MC does not need any previous calibrations, and still had a high accuracy (DSI=0.87), only slightly worse than the Daisne method[25]. The 42% Threshold and 50% Threshold had a reasonable accuracy, while CCRG_2.5 was the least accurate (DSI=0.36).
FIG. 3.
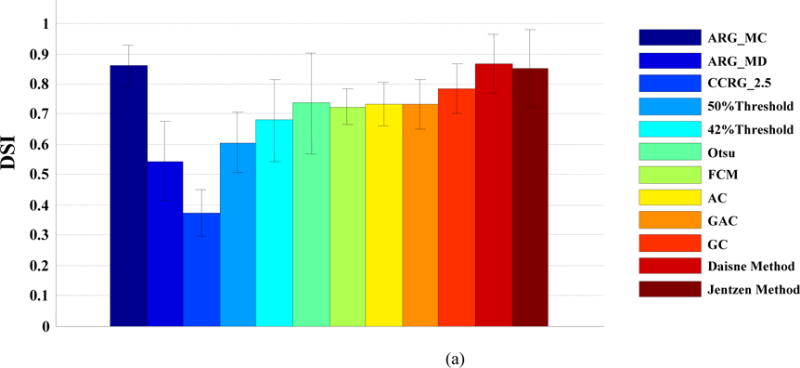

(a). DSI averaged over all SBR levels and all object sizes; (b). DSI at different SBR levels, averaged over all sphere sizes; (c). DSI at different sphere phantom sizes, averaged over all SBR levels
Figure 3(b) displays the DSI at different SBR levels, averaged over all sphere sizes. SBR can affect the segmentation accuracy. When the SBR decreased from 16:1 to 4:1, all methods tended to be less accurate. Nevertheless, the proposed ARG_MC algorithm was among the best at all SBR levels. Figure 3(c) displays the DSI at different sphere phantom sizes, averaged over all SBR levels. As we can see, the smaller the sphere was, the less accurate was a method. The improvement of the proposed ARG_MC algorithm over other methods was clear, especially for the smallest (0.5 mL) sphere, indicating a stronger ability of the proposed algorithm in handling the partial volume effect.
Figure 4 displays the DSI averaged over all patients in the esophageal cancer dataset for all tested algorithms. Note that the Daisne method and the Jentzen method were not tested on the two clinical datasets due to unavailability of phantom calibrations. ARG_MC had the highest accuracy (DSI=0.87), and ARG_MD had the lowest accuracy (DSI=0.26). CCRG_2.5 had a somewhat higher accuracy (DSI=0.57) than ARG_MD. The thresholding methods (42% Threshold, 50% Threshold, and Otsu) were worse than the advanced methods (FCM, AC, GAC, and GC). Among all tested methods, the GC ranked the second (DSI=0.75), and the FCM ranked the third (DSI=0.72).
FIG. 4.
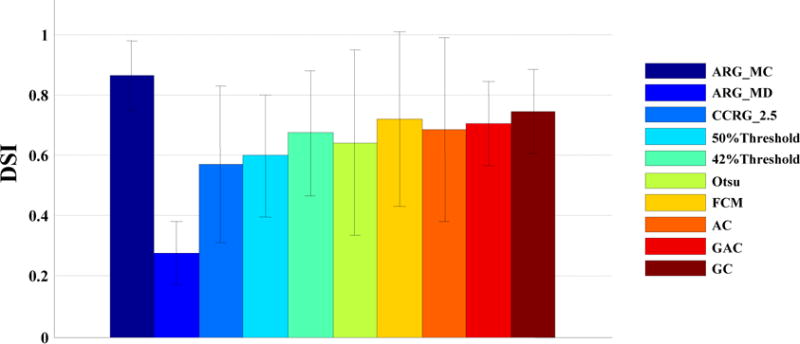
DSI averaged over all patients with esophageal cancer.
Figure 5 shows the DSI averaged over all patients in the NHL dataset. Again in this dataset, ARG_MC had the highest accuracy (DSI=0.84), and ARG_MD had the lowest accuracy (DSI=0.33). CCRG_2.5 had a somewhat higher accuracy (DSI=0.48) than ARG_MD. The thresholding methods (42% Threshold, 50% Threshold, and Otsu) were worse than the advanced methods (FCM, AC, GAC, and GC). Among all tested methods, FCM ranked the second (DSI=0.75).
FIG. 5.

DSI averaged over all patients with non-Hodgkin lymphoma.
Figure 6 shows example results using different algorithms for an esophageal cancer patient for visual comparison. ARG_MC (Fig. 6(b)) had the highest accuracy with DSI=0.77. CCRG_2.5 (Fig. 6(c)) had the lowest accuracy with DSI = 0.30 and its segmentation was obviously smaller than that of the reference contour in Fig. 6(a).
FIG. 6.
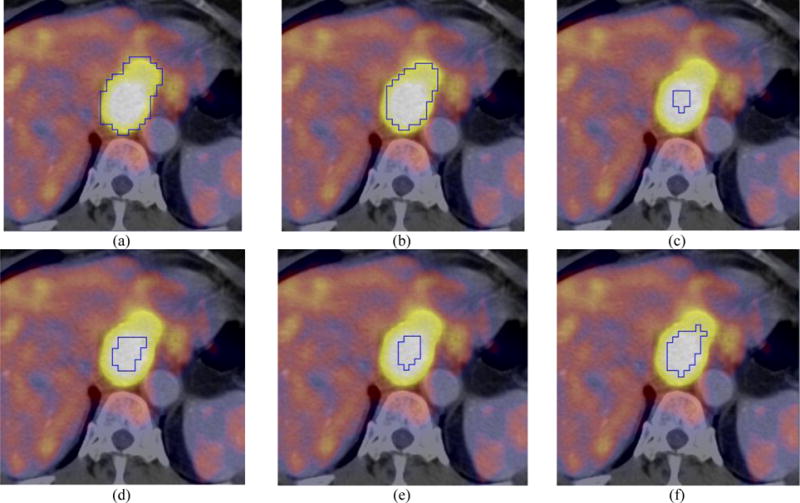
Visual comparison (axial PET/CT) for a patient with esophageal cancer: (a) manual contour; (b) ARG_MC (DSI=0.77); (c) CCRG_2.5 (DSI=0.30); (d) 42% Threshold (DSI=0.41); (e) Otsu (DSI=0.34); and (f) FCM (DSI=0.57). Closed blue contours represent the resulting tumor boundaries of different methods.
Figure 7 shows example results for an NHL patient. The boundary from ARG_MC (Fig. 7(c)) coincided well with the reference contour (Fig. 7(a)), with DSI=0.95, whereas other algorithms were less accurate than the ARG_MC. In Fig. 7, a hole in the segmentation result of the 42% Threshold (Fig. 7(e)) indicates that the uptake within this tumor was heterogeneous, and there was a cold subregion with uptake lower than 0.42 × SUVmax. Figure 7(f), a zoom-in view of Fig. 7(e), demonstrates the cold subregion more clearly. Both 42% Threshold (Fig. 7(f)) and FCM (Fig. 7(l)) missed this cold subregion. The ARG_MC (Figs. 7(c) and 7(d)) successfully included the cold subregion (as did the GC (Fig. 7(i),7(j))), indicating that it was able to segment tumors with heterogeneous uptake. The CCRG_2.5 method (Figs. 7(g) and 7(h)) only found the hottest parts in the tumor region, indicating that f=2.5 was too small for segmenting this tumor. By comparison, the ORF by ARG_MC was 9.4 for this tumor (Fig. 7(m) and 7(n)), leading to a very good segmentation result.
FIG. 7.
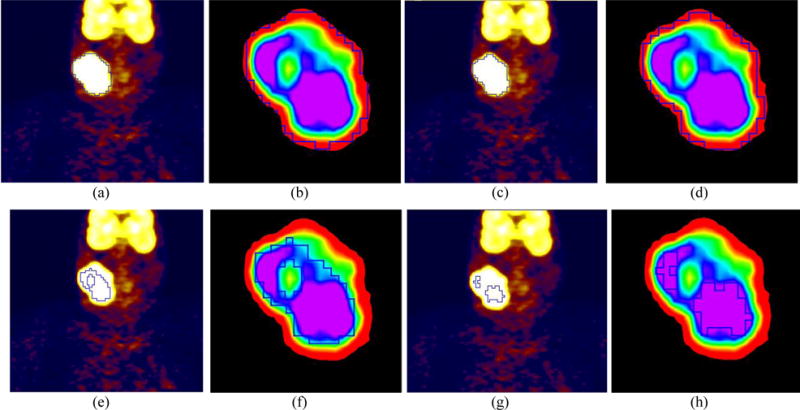
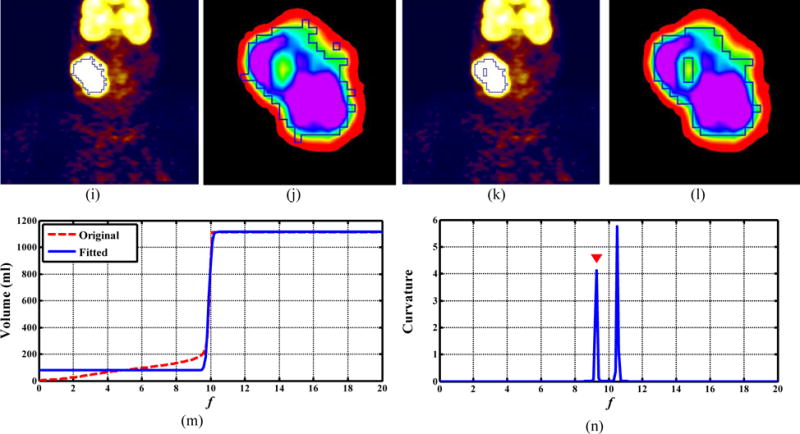
Visual comparison (coronal view for PET only) for a patient with non-Hodgkin lymphoma. (a) manual contour, (c) ARG_MC (DSI = 0.95), (e) 42% Threshold (DSI = 0.59), (g) CCRG_2.5 (DSI= 0.32), (i) GC (DSI = 0.82), and (k) FCM (DSI = 0.72). Zoom-in views of the tumor region for: (b) manual contour, (d) ARG_MC, (f) 42% Threshold, (h) CCRG_2.5, (j) GC, and (l) FCM. Closed blue contours represent the resulting tumor boundaries of different methods. In ARG_MC: (m) the original and fitted f-volume curve, and (n) the Menger curve of the fitted f-volume curve.
3.B. Segmentation robustness
Table I lists the interrun variations of the tested algorithms for assessing segmentation robustness to ROI selection. The thresholding methods, by definition, had the smallest interrun variations close to 0, indicating that the ROI selection had almost no influence on them. The ROI selection affected the accuracy of FCM and AC the most. ARG_MC showed some variations (τ=3.25 and 1.15 respectively), but was more robust or comparable to other advanced methods. Similar results were observed in the phantom study.
Table I.
Interrun variation of segmentation algorithms to ROI selection
| Algorithm Type | Algorithms | Esophageal cancer | Non-Hodgkin lymphoma |
|---|---|---|---|
| Region Growing | ARG_MC | 3.25 | 1.15 |
| ARG_MD | 19.17 | 29.66 | |
| CCRG_2.5 | 1.06 | 0.02 | |
|
| |||
| Thresholding | 50% Threshold | 0.16 | 0 |
| 42% Threshold | 0.47 | 0 | |
| Otsu | 0.16 | 0.02 | |
|
| |||
| Advanced Methods | FCM | 13.05 | 12.25 |
| AC | 12.91 | 11.25 | |
| GAC | 2.11 | 1.99 | |
| GC | 2.01 | 2.71 | |
We also examined the robustness of the proposed algorithm to the discretization step Δf and the upper bound B of the relaxing factor. Table II lists the DSI averaged over all SBR levels and all sphere sizes in the phantom, and over all patients in the two clinic datasets, with Δf= 0.001, 0.005, 0.01, 0.05, 0.1, 0.2, and 0.5, while fixing B at 20. The proposed ARG_MC was insensitive to the change of Δf. For example, in the NHL dataset, when Δf changed by 100 times from 0.1 to 0.001, DSI changed only slightly from 0.84 to 0.86. It should be noted that a finer Δf led to a heavier computational burden. For example, the computational time for a typical patient in the dataset increased 50 times (from around 0.5 to 25 minutes (PC with 3.6 GHz CPU and 16GB RAM)) when Δf changed from 0.1 to 0.001. To balance computational burden and segmentation accuracy, we set Δf= 0.1 for all experiments.
Table II.
DSI of ARG_MC with different discretization step Δf
| Δf | 0.001 | 0.005 | 0.01 | 0.05 | 0.1 | 0.2 | 0.5 |
| Phantom | 0.86 | 0.86 | 0.86 | 0.86 | 0.86 | 0.86 | 0.83 |
| Esophageal cancer | 0.83 | 0.83 | 0.83 | 0.85 | 0.87 | 0.82 | 0.80 |
| Non-Hodgkin lymphoma | 0.86 | 0.86 | 0.85 | 0.84 | 0.84 | 0.82 | 0.82 |
The upper bound B can affect the accuracy of the proposed method. If B takes a value that is too small, the f-volume curve may not include the entire sharp increase or transition area, which will make the proposed method fail to find the ORF. For safety, one should select a B value as large as possible; however, this will increase the computational burden. To evaluate the robustness of ARG_MC to the choice of B, we computed the DSI, averaged over all patients in the two clinic datasets, for B = 18, 20, 22, 24, 26, 28, and 30, respectively, while fixing Δf at 0.1. The DSI remained unchanged for both datasets at all B values, suggesting that the choice of B did not affect the accuracy of ARG_MC as long as it was sufficiently large. In our experiment, we fixed B at 20. Similar results were observed in the phantom study.
4. DISCUSSION
The CCRG algorithm integrates the statistics of the uptake in the tumor area into the segmentation process. Furthermore, the guaranteed spatial connectivity makes it effective in handling the complex heterogeneous uptake distribution in PET. It was shown that CCRG had higher accuracy than thresholding while remaining simple and having high reproducibility for PET tumor segmentation in clinic[35–37]. However, it is challenging to determine an ORF for all objects. Clinical factors, such as tumor types and imaging protocols from different scanners, can affect the ORF in CCRG[35]. Day et al. pointed out that to determine the ORF for a different scanner, their phantom calibration need to be re-performed [35]. In this study, we proposed an ARG_MC algorithm to automatically determine the ORF for a specific object based on the f-volume curve. It did not depend on scanners, imaging protocols, or tumor types. The results demonstrated that the ARG_MC algorithm had high segmentation accuracy for the phantom study and the two clinic datasets, and was robust to both parameter settings and ROI selections.
The ARG-MC algorithm made an underlying assumption that the uptake/intensity of the surrounding normal tissues or background is relatively homogeneous. This assumption is typically true for PET tumor imaging. In the present study, all objects (phantoms and patients) showed sharp volume increase on the f-volume curve at the identified ORF (see Fig. 1(b) for example), supporting the validity of this assumption. The ARG_MC algorithm made no assumption about the tumor size or tumor uptake distribution, which is advantage over many other algorithms. As a result, the ARG_MC algorithm can segment tumors with heterogeneous uptake (see Fig. 7 for an example).
Day et al. used CCRG for PET tumor segmentation in rectal and anal cancer and found that the ORF ranged from 2.0 to 2.56 based on phantom calibrations[35]. When the spatial distribution of the tumor uptake is strictly Gaussian, it can be shown that CCRG encloses 98.8% of all tumor voxels when setting f = 2.5. In our experiments, the CCRG_2.5 strategy was much less accurate than the ARG_MC for the phantom study and both clinic datasets (Figs. 3–5). Figure 8 shows the histograms of the ORF obtained by ARG_MC. The three histograms demonstrated different distribution patterns, with average relaxing factors of 9.61±8.50 for the phantom study, 3.78±1.90 for esophageal cancer and 2.55±2.49 for NHL. These results indicated that the ORF varied not only with tumor types, but also from one tumor to another.
FIG. 8.

Histogram of the optimal relaxing factor (ORF) obtained using the maximum curvature strategy in:(a) phantom; (b) the esophageal cancer dataset; and (c) the non-Hodgkin lymphoma dataset. The bin width for all histograms was set to 0.5.
Figures 9 and 10 illustrate the difference of the obtained ORF between the ARG_MD and ARG_MC methods. The ORF determined with the MD method corresponded to the fastest volume increase and located around the middle of the sharp volume increase (Figs. 9(b) and 10(b)). On the other hand, the ORF determined with the MC method corresponded to the first transition point where the gradual-increase part of the (original) f-volume curve transited to the beginning of the sharp volume increase (Figs. 9(c) and 10(c)). As a result, the ARG_MD included the intermediate (blurring) voxels between the tumors and the background, and thus overestimated both tumor volumes (Figs. 9(d) and 10(d)), yielding low DSIs (0.31 and 0.38). The ARG_MC segmented both tumors more accurately by excluding the intermediate voxels (Figs. 9(f) and 10(f)), yielding much higher DSIs (0.92 and 0.89). Note that the uptake was heterogeneous within the esophageal tumor in Fig. 10.
FIG. 9.
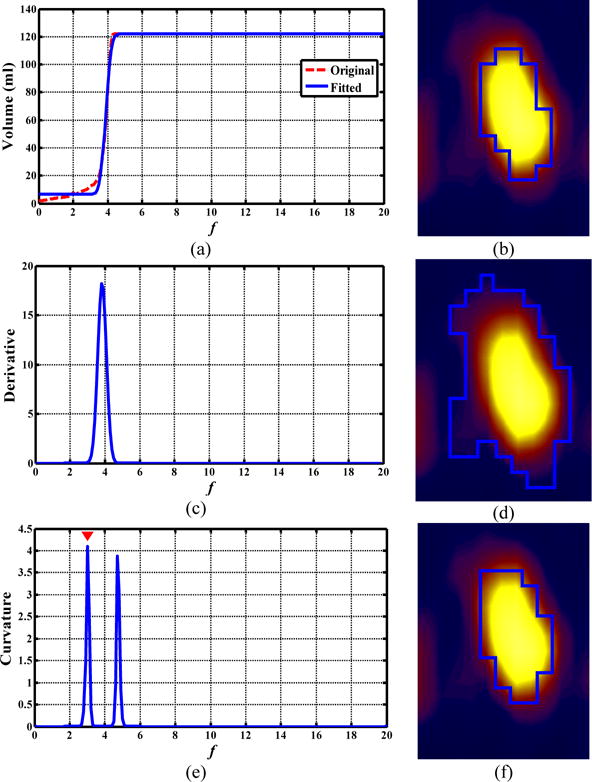
Comparison of the ORF obtained by the ARG_MD and ARG_MC methods for a patient with non-Hodgkin lymphoma. (a, c, e): the f-volume curve (red line) and the fitted f-volume curve (blue line), its derivative, and its Menger curvature, respectively; (b, d, f) coronal PET view: manual contour, segmentation results using ARG_MD (DSI=0.31) and ARG_MC (DSI=0.92), respectively.
FIG. 10.
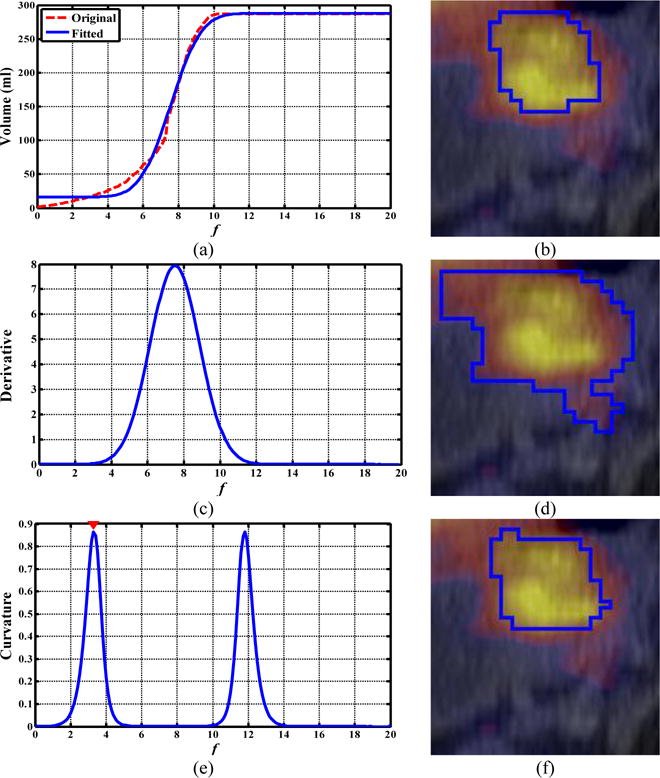
Comparison of the ORF obtained by ARG_MC and ARG_MD for a patient with esophageal cancer. (a, c, e): the f-volume curve (red line) and the fitted f-volume curve (blue line), its derivative, and its Menger curvature, respectively; (b, d, f) axial PET/CT view: manual contour, segmentation results obtained by the ARG_MD method (DSI=0.38) and ARG_MC method (DSI=0.89), respectively.
There are many methods for smoothing a curve and for calculating the curvature of a curve. We used Eq. (2) to smooth the original f-volume curve. Eq. (2) was constructed using the error function, which is smooth and of good mathematic behavior. The curve of Eq. (2) had a very similar shape as the original f-volume curve, which made the fitting process converge quickly and resulted in a small fitting error (6% for all tested datasets on average). We used the Menger curvature (Eq (3)) to detect the transition point along the f-volume curve. The Menger curvature is defined using only the first-order derivatives, while the classical mean curvature is defined using both the first-order and the second-order derivatives, which is more sensitive to noise. The calculation of the Menger curvature is thus more stable and computationally effective.
We fixed the upper bound B to 20 and found that the ARG_MC was insensitive to the selection of B as long as it is sufficiently large. A better approach is to set B automatically and adaptively for each tumor. We could have set B to be twice the value of f where the CCRG-segmented volume reaches the volume of the entire ROI. This would guarantee that B is sufficiently large and allow a stable curve fitting using Eq. (2).
In this study, the segmentation of each tumor was conducted in a manually drawn rough ROI. It would be more preferable to automatically select the ROI or detect a tumor in a fully automatic way. However, the automated detection of a tumor from a whole-body PET volume is challenging and is out of the scope of this work. Manually drawing rough ROI is the only step requiring user interaction. We considered this is a reliable and reasonably efficient pre-processing step for the ARG_MC algorithm.
The ARG_MC algorithm was designed for segmenting only one lesion within one ROI. We demonstrated that it worked for lesions with heterogeneous uptake (Figs. 7 and 10), including lesion with a cold island in the center (Fig. 7). For multiple lesions (that are clearly disconnected) within an ROI, the algorithm will need modification to select multiple seeds, run multiple CCRGs from each seed for each lesion, and take the sum of all CCRG-segmented volumes as the volume V for each f. Since the ARG_MC algorithm was based only on the assumption of a relatively homogeneous background without any assumptions about the tumors, this modification might likely work. This will be our future work.
The proposed method used only PET image for tumor segmentation. Recently multimodality PET/CT and PET/MR segmentation methods have been proposed[53]. These methods combined the functional information of PET and the anatomical information of CT and MRI[20, 54, 55] in the segmentation process. These studies revealed benefits of simultaneous usage of CT/MRI and PET images for tumor segmentation. Integrating anatomical information from CT and MRI into the proposed algorithm might potentially improve the segmentation accuracy, which is under investigation by our group.
5. CONCLUSIONS
We proposed a novel maximum curvature strategy to automatically identify the optimal relaxing factor in CCRG for tumor segmentation in PET. The results demonstrated that the ARG_MC algorithm outperformed several widely used segmentation methods, and other strategies to select the relaxing factor, for a phantom and two clinic datasets. Moreover, the ARG_MC was robust to parameter settings and ROI selection, and did not depend on scanners, imaging protocols, or tumor types. It provides an attractive alternative to the most widely used thresholding method for PET tumor segmentation in the clinic.
Acknowledgments
Shan Tan was supported in part by the National Natural Science Foundation of China, under Grant Nos. 61375018 and 61672253, and Fundamental Research Funds for the Central Universities, under Grant No. 2012QN086. This work was supported in part by the National Institutes of Health Grant No. R01 CA172638.
APPENDIX: Confidence Connected Region Growing (CCRG) Algorithm
| V(f) = CCRG(I, f, ROI) |
Input:
|
Set parameters:
|
Initialization:
|
Iteration:
|
|
Output: V(f) = Volume of current region R. |
Footnotes
The authors have no relevant conflicts of interest to disclose.
References
- 1.Gambhir SS. Molecular imaging of cancer with positron emission tomography. Nat Rev Cancer. 2002 Sep;2:683–93. doi: 10.1038/nrc882. [DOI] [PubMed] [Google Scholar]
- 2.Jerusalem G, Hustinx R, Beguin Y, Fillet G. The value of positron emission tomography (PET) imaging in disease staging and therapy assessment. Annals of oncology. 2002;13(Suppl 4):227–34. doi: 10.1093/annonc/mdf664. [DOI] [PubMed] [Google Scholar]
- 3.van Baardwijk A, Baumert BG, Bosmans G, van Kroonenburgh M, Stroobants S, Gregoire V, et al. The current status of FDG-PET in tumour volume definition in radiotherapy treatment planning. Cancer treatment reviews. 2006 Jun;32:245–60. doi: 10.1016/j.ctrv.2006.02.002. [DOI] [PubMed] [Google Scholar]
- 4.Juweid ME, Cheson BD. Positron-emission tomography and assessment of cancer therapy. The New England journal of medicine. 2006 Feb 2;354:496–507. doi: 10.1056/NEJMra050276. [DOI] [PubMed] [Google Scholar]
- 5.Zhang H, Tan S, Chen W, Kligerman S, Kim G, D’Souza WD, et al. Modeling Pathologic Response of Esophageal Cancer to Chemoradiation Therapy Using Spatial-Temporal (18)F-FDG PET Features, Clinical Parameters, and Demographics. International journal of radiation oncology, biology, physics. 2014 Jan 1;88:195–203. doi: 10.1016/j.ijrobp.2013.09.037. [DOI] [PMC free article] [PubMed] [Google Scholar]
- 6.Tan S, Kligerman S, Chen WG, Lu M, Kim G, Feigenberg S, et al. Spatial-Temporal F-18 FDG-PET Features for Predicting Pathologic Response of Esophageal Cancer to Neoadjuvant Chemoradiation Therapy. International Journal of Radiation Oncology Biology Physics. 2013 Apr;85:1375–1382. doi: 10.1016/j.ijrobp.2012.10.017. [DOI] [PMC free article] [PubMed] [Google Scholar]
- 7.Tan S, Zhang H, Zhang Y, Chen W, D’Souza WD, Lu W. Predicting pathologic tumor response to chemoradiotherapy with histogram distances characterizing longitudinal changes in 18F-FDG uptake patterns. Medical physics. 2013 Oct;40:101707. doi: 10.1118/1.4820445. [DOI] [PMC free article] [PubMed] [Google Scholar]
- 8.Pan T, Mawlawi O. PET/CT in radiation oncology. Medical physics. 2008 Nov;35:4955–66. doi: 10.1118/1.2986145. [DOI] [PubMed] [Google Scholar]
- 9.Lu W, Wang J, Zhang H. Computerized PET/CT image analysis in the evaluation of tumour response to therapy. The British journal of radiology. 2015;88:20140625. doi: 10.1259/bjr.20140625. [DOI] [PMC free article] [PubMed] [Google Scholar]
- 10.Lambin P, Rios-Velazquez E, Leijenaar R, Carvalho S, van Stiphout RG, Granton P, et al. Radiomics: extracting more information from medical images using advanced feature analysis. European Journal of Cancer. 2012;48:441–446. doi: 10.1016/j.ejca.2011.11.036. [DOI] [PMC free article] [PubMed] [Google Scholar]
- 11.Soret M, Bacharach SL, Buvat I. Partial-volume effect in PET tumor imaging. Journal of nuclear medicine. 2007 Jun;48:932–45. doi: 10.2967/jnumed.106.035774. [DOI] [PubMed] [Google Scholar]
- 12.Foster B, Bagci U, Mansoor A, Xu Z, Mollura DJ. A review on segmentation of positron emission tomography images. Comput Biol Med. 2014 Jul;50:76–96. doi: 10.1016/j.compbiomed.2014.04.014. [DOI] [PMC free article] [PubMed] [Google Scholar]
- 13.Hsu CY, Liu CY, Chen CM. Automatic segmentation of liver PET images. Computerized medical imaging and graphics: the official journal of the Computerized Medical Imaging Society. 2008 Oct;32:601–10. doi: 10.1016/j.compmedimag.2008.07.001. [DOI] [PubMed] [Google Scholar]
- 14.Zeng ZM, Wang J, Tiddeman B, Zwiggelaar R. Unsupervised tumour segmentation in PET using local and global intensity-fitting active surface and alpha matting. Computers in Biology and Medicine. 2013 Oct 1;43:1530–1544. doi: 10.1016/j.compbiomed.2013.07.027. [DOI] [PubMed] [Google Scholar]
- 15.Zhu W, Jiang T. Automation segmentation of PET image for brain tumours. presented at the IEEE NSS-MIC Conf Rec. 2003 [Google Scholar]
- 16.Kerhet A, Small C, Quon H, Riauka T, Schrader L, Greiner R, et al. Application of machine learning methodology for PET-based definition of lung cancer. Current oncology. 2010 Feb;17:41–7. doi: 10.3747/co.v17i1.394. [DOI] [PMC free article] [PubMed] [Google Scholar]
- 17.Chen JL, Gunn SR, Nixon MS. Markov random field model for segmentation of PET images. Lecture Notes on Computer Science. 2001;2082:468–474. [Google Scholar]
- 18.Hatt M, Lamare F, Boussion N, Turzo A, Collet C, Salzenstein F, et al. Fuzzy hidden Markov chains segmentation for volume determination and quantitation in PET. Physics in medicine and biology. 2007 Jun 21;52:3467–91. doi: 10.1088/0031-9155/52/12/010. [DOI] [PMC free article] [PubMed] [Google Scholar]
- 19.Zaidi H, El Naqa I. PET-guided delineation of radiation therapy treatment volumes: a survey of image segmentation techniques. European journal of nuclear medicine and molecular imaging. 2010 Nov;37:2165–87. doi: 10.1007/s00259-010-1423-3. [DOI] [PubMed] [Google Scholar]
- 20.Shepherd T, Teras M, Beichel RR, Boellaard R, Bruynooghe M, Dicken V, et al. Comparative study with new accuracy metrics for target volume contouring in PET image guided radiation therapy. IEEE transactions on medical imaging. 2012 Nov;31:2006–24. doi: 10.1109/TMI.2012.2202322. [DOI] [PMC free article] [PubMed] [Google Scholar]
- 21.Geets X, Lee JA, Bol A, Lonneux M, Gregoire V. A gradient-based method for segmenting FDG-PET images: methodology and validation. European journal of nuclear medicine and molecular imaging. 2007 Sep;34:1427–38. doi: 10.1007/s00259-006-0363-4. [DOI] [PubMed] [Google Scholar]
- 22.Hatt M, Cheze le Rest C, Turzo A, Roux C, Visvikis D. A fuzzy locally adaptive Bayesian segmentation approach for volume determination in PET. IEEE transactions on medical imaging. 2009 Jun;28:881–93. doi: 10.1109/TMI.2008.2012036. [DOI] [PMC free article] [PubMed] [Google Scholar]
- 23.Li L, Wang J, Lu W, Tan S. Simultaneous tumor segmentation, image restoration, and blur kernel estimation in PET using multiple regularizations. Computer Vision and Image Understanding. 2016 doi: 10.1016/j.cviu.2016.10.002. In Press. [DOI] [PMC free article] [PubMed] [Google Scholar]
- 24.Krak NC, Boellaard R, Hoekstra OS, Twisk JW, Hoekstra CJ, Lammertsma AA. Effects of ROI definition and reconstruction method on quantitative outcome and applicability in a response monitoring trial. European journal of nuclear medicine and molecular imaging. 2005 Mar;32:294–301. doi: 10.1007/s00259-004-1566-1. [DOI] [PubMed] [Google Scholar]
- 25.Daisne JF, Sibomana M, Bol A, Doumont T, Lonneux M, Gregoire V. Tri-dimensional automatic segmentation of PET volumes based on measured source-to-background ratios: influence of reconstruction algorithms. Radiotherapy and oncology. 2003 Dec;69:247–50. doi: 10.1016/s0167-8140(03)00270-6. [DOI] [PubMed] [Google Scholar]
- 26.Nestle U, Kremp S, Schaefer-Schuler A, Sebastian-Welsch C, Hellwig D, Rube C, et al. Comparison of different methods for delineation of 18F-FDG PET-positive tissue for target volume definition in radiotherapy of patients with non-Small cell lung cancer. Journal of nuclear medicine. 2005 Aug;46:1342–8. [PubMed] [Google Scholar]
- 27.Jentzen W, Freudenberg L, Eising EG, Heinze M, Brandau W, Bockisch A. Segmentation of PET volumes by iterative image thresholding. Journal of nuclear medicine. 2007 Jan;48:108–14. [PubMed] [Google Scholar]
- 28.van Dalen JA, Hoffmann AL, Dicken V, Vogel WV, Wiering B, Ruers TJ, et al. A novel iterative method for lesion delineation and volumetric quantification with FDG PET. Nuclear medicine communications. 2007 Jun;28:485–93. doi: 10.1097/MNM.0b013e328155d154. [DOI] [PubMed] [Google Scholar]
- 29.Black QC, Grills IS, Kestin LL, Wong CY, Wong JW, Martinez AA, et al. Defining a radiotherapy target with positron emission tomography. International journal of radiation oncology, biology, physics. 2004 Nov 15;60:1272–82. doi: 10.1016/j.ijrobp.2004.06.254. [DOI] [PubMed] [Google Scholar]
- 30.Kao CH, Hsieh TC, Yu CY, Yen KY, Yang SN, Wang YC, et al. 18F-FDG PET/CT-based gross tumor volume definition for radiotherapy in head and neck cancer: a correlation study between suitable uptake value threshold and tumor parameters. Radiation oncology. 2010;5:76. doi: 10.1186/1748-717X-5-76. [DOI] [PMC free article] [PubMed] [Google Scholar]
- 31.Biehl KJ, Kong FM, Dehdashti F, Jin JY, Mutic S, El Naqa I, et al. 18F-FDG PET definition of gross tumor volume for radiotherapy of non-small cell lung cancer: is a single standardized uptake value threshold approach appropriate? J Nucl Med. 2006 Nov;47:1808–12. [PubMed] [Google Scholar]
- 32.Erdi YE, Mawlawi O, Larson SM, Imbriaco M, Yeung H, Finn R, et al. Segmentation of lung lesion volume by adaptive positron emission tomography image thresholding. Cancer. 1997 Dec 15;80:2505–9. doi: 10.1002/(sici)1097-0142(19971215)80:12+<2505::aid-cncr24>3.3.co;2-b. [DOI] [PubMed] [Google Scholar]
- 33.Prieto E, Lecumberri P, Pagola M, Gomez M, Bilbao I, Ecay M, et al. Twelve automated thresholding methods for segmentation of PET images: a phantom study. Physics in medicine and biology. 2012 Jun 21;57:3963–80. doi: 10.1088/0031-9155/57/12/3963. [DOI] [PubMed] [Google Scholar]
- 34.Gonzalez RC, Woods RE, Eddins SL. Digital image processing using MATLAB. 2. United States: Gatesmark Publishing; 2009. [Google Scholar]
- 35.Day E, Betler J, Parda D, Reitz B, Kirichenko A, Mohammadi S, et al. A region growing method for tumor volume segmentation on PET images for rectal and anal cancer patients. Medical physics. 2009 Oct;36:4349–58. doi: 10.1118/1.3213099. [DOI] [PubMed] [Google Scholar]
- 36.Ibanez L, Schroeder W, Ng L, Cates J. The ITK Software Guide. Kitware; 2005. [Google Scholar]
- 37.Li H, Thorstad WL, Biehl KJ, Laforest R, Su Y, Shoghi KI, et al. A novel PET tumor delineation method based on adaptive region-growing and dual-front active contours. Medical physics. 2008 Aug;35:3711–21. doi: 10.1118/1.2956713. [DOI] [PMC free article] [PubMed] [Google Scholar]
- 38.Léger J-C. Menger curvature and rectifiability. Annals of mathematics. 1999;149:831–869. [Google Scholar]
- 39.Hudson HM, Larkin RS. Accelerated image reconstruction using ordered subsets of projection data. Medical Imaging, IEEE Transactions on. 1994;13:601–609. doi: 10.1109/42.363108. [DOI] [PubMed] [Google Scholar]
- 40.Leong T, Everitt C, Yuen K, Condron S, Hui A, Ngan SYK, et al. A prospective study to evaluate the impact of FDG-PET on CT-based radiotherapy treatment planning for oesophageal cancer. Radiotherapy and oncology. 78:254–261. doi: 10.1016/j.radonc.2006.02.014. [DOI] [PubMed] [Google Scholar]
- 41.Betrouni N, Makni N, Dewalle-Vignion A-S, Vermandel M. MedataWeb: A shared platform for multimodality medical images and Atlases. IRBM. 2012;33:223–226. [Google Scholar]
- 42.Otsu N. A threshold selection method from gray-level histograms. Automatica. 1975;11:23–27. [Google Scholar]
- 43.Bishop CM. Pattern recognition and machine learning. Vol. 4. springer; New York: 2006. [Google Scholar]
- 44.Chan TF, Vese LA. Active contours without edges. Image Processing, IEEE Transactions on. 2001;10:266–277. doi: 10.1109/83.902291. [DOI] [PubMed] [Google Scholar]
- 45.Caselles V, Kimmel R, Sapiro G. Geodesic active contours. International journal of computer vision. 1997;22:61–79. [Google Scholar]
- 46.Boykov Y, Funka-Lea G. Graph cuts and efficient ND image segmentation. International journal of computer vision. 2006;70:109–131. [Google Scholar]
- 47.Zadeh LA. Fuzzy sets. Information and control. 1965;8:338–353. [Google Scholar]
- 48.Deter RL, Harrist RB, Hadlock FP, Carpenter RJ. Fetal head and abdominal circumferences: I. Evaluation of measurement errors. Journal of clinical ultrasound: JCU. 1982 Oct;10:357–63. doi: 10.1002/jcu.1870100803. [DOI] [PubMed] [Google Scholar]
- 49.Chalana V, Winter TC, Cyr DR, 3rd, Haynor DR, Kim Y. Automatic fetal head measurements from sonographic images. Academic radiology. 1996 Aug;3:628–35. doi: 10.1016/s1076-6332(96)80187-5. [DOI] [PubMed] [Google Scholar]
- 50.Lartizien C, Marache-Francisco S, Prost R. Automatic Detection of Lung and Liver Lesions in 3-D Positron Emission Tomography Images: A Pilot Study. IEEE Transactions on Nuclear Science. 2012;59:102–112. [Google Scholar]
- 51.Ravì D, Wong C, Deligianni F, Berthelot M, Andreu-Perez J, Lo B, et al. Deep Learning for Health Informatics. IEEE Journal of Biomedical and Health Informatics. 2017;21:4–21. doi: 10.1109/JBHI.2016.2636665. [DOI] [PubMed] [Google Scholar]
- 52.Yu H, Caldwell C, Mah K, Poon I, Balogh J, MacKenzie R, et al. Automated radiation targeting in head-and-neck cancer using region-based texture analysis of PET and CT images. Int J Radiat Oncol Biol Phys. 2009 Oct 01;75:618–25. doi: 10.1016/j.ijrobp.2009.04.043. [DOI] [PubMed] [Google Scholar]
- 53.Yang D, Zheng J, Nofal A, Deasy J, El Naqa IM. Techniques and software tool for 3D multimodality medical image segmentation. Journal of Radiation Oncology Informatics. 2009;1:1–22. [Google Scholar]
- 54.Song Q, Bai J, Han D, Bhatia S, Sun W, Rockey W, et al. Optimal co-segmentation of tumor in PET-CT images with context information. IEEE transactions on medical imaging. 2013 Sep;32:1685–97. doi: 10.1109/TMI.2013.2263388. [DOI] [PMC free article] [PubMed] [Google Scholar]
- 55.El Naqa I, Yang D, Apte A, Khullar D, Mutic S, Zheng J, et al. Concurrent multimodality image segmentation by active contours for radiotherapy treatment planning. Med Phys. 2007 Dec;34:4738–49. doi: 10.1118/1.2799886. [DOI] [PubMed] [Google Scholar]


