

Abstract
Rho GDP‐dissociation inhibitor α (RhoGDIα) is an essential regulator for Rho GTPases. Although RhoGDIα may serve as an oncogene in colorectal cancer (CRC), the underlying mechanism is still unclear. We investigated the function, mechanism, and clinical significance of RhoGDIα in CRC progression. We founded that downregulation of RhoGDIα repressed CRC cell proliferation, motility, and invasion. Overexpression of RhoGDIα increased DNA damage response signals at telomeres, and led to telomere shortening in CRC cells, also being validated in 26 pairs of CRC tissues. Mechanistic studies revealed that RhoGDIα could promote telomeric repeat factor 1 (TRF1) expression through the phosphatidylinositol 3‐kinase–protein kinase B signal pathway. Moreover, RhoGDIα protein levels were strongly correlated with TRF1 in CRC tissues. A cohort of 297 CRC samples validated the positive relationship between RhoGDIα and TRF1, and revealed that RhoGDIα and TRF1 levels were negatively associated with CRC patients' survival. Taken together, our results suggest that RhoGDIα regulate TRF1 and telomere length and may be novel prognostic biomarkers in colorectal cancer.
Keywords: Colorectal cancer, prognosis, RhoGDIα, telomere, TRF1
Colorectal cancer is the second most common cancer and the fourth leading cause of cancer death worldwide, with approximately 1.4 million new cases and 693 900 deaths in 2012.1 Despite advances in the treatment of CRC, the prognosis remains poor, in part due to the high rate of distant metastasis.2, 3 Therefore, searching for biomarkers is essential for early diagnosis and increased survival rates for patients with CRC.
Rho GDP‐dissociation inhibitors are key regulators of Rho family GTPases characterized by their ability to prevent nucleotide exchange and membrane association.4 Rho GTPases are bound to RhoGDIs, preventing them from switching from their inactive GDP‐bound state to the active GTP‐bound state.5 Despite being initially characterized as Rho GTPase inhibitors, recent studies have suggested that RhoGDIs have more complex functions, such as controlling Rho GTPase expression, localization, and activation.6, 7 There are three types of RhoGDIs in mammals: RhoGDIα, RhoGDIβ, and RhoGDIγ. Among them, RhoGDIα is ubiquitously expressed and is the most abundant member.8, 9 Rho GDP‐dissociation inhibitor α can act as an oncogene or tumor suppressor depending on the cell type.10, 11, 12 In CRC, the RhoGDIα expression level is usually positively correlated with tumor progression. For example, Yamashita et al.13 used tissue microarrays to identify RhoGDIα as a metastasis‐related protein in patients with CRC. Similarly, Zhao et al.14 detected increased expression of RhoGDIα in metastatic CRC by comparative proteomic analysis. These data suggest that RhoGDIα is an important marker of CRC diagnosis and could represent a therapeutic target in the future. However, the molecular mechanisms of RhoGDIα in CRC remain unclear.
Telomeres, the ends of chromosomes, are essential for the maintenance of genomic integrity. In somatic cells, telomeres erode at each cell division due to the “end replication problem,” eventually leading to senescence.15 However, without fully functional DNA damage checkpoints, telomere dysfunction could occur when telomeres fuse with other chromosome loci after shortening to a certain length, impairing chromosomal stability. This occurs early during tumorigenesis and promotes cancer progression.16, 17 In mammals, telomeres are composed of nucleoprotein complexes that cap the ends of chromosomes.18 Six core telomere‐associated proteins, including TRF1, TRF2, TPP1, POT1, RAP1, and TIN2, are usually referred to as the telosome/shelterin complex. Recent studies in several shelterin‐transgenic mouse models showed that these proteins are linked to cancer susceptibility.19 Recently, the expression levels of these six proteins were measured by qRT‐PCR in 106 paired CRC and corresponding non‐cancerous mucosal specimens, and all the proteins except for POT1 were downregulated in CRC.20 However, this conclusion remains controversial considering the sample sizes and examination methods.21, 22
In this study, we identify RhoGDIα as a biomarker for poor prognosis in colorectal cancer, as it facilitates cell proliferation, migration, and invasion. Moreover, RhoGDIα promotes TRF1 expression, induces telomere shortening, and triggers telomere instability. Telomeric repeat factor 1 was also found to be highly expressed in CRC tissue samples, serving as a possible prognostic factor.
Materials and Methods
Patients and tissue specimens
In this study, 26 pairs of colorectal adenocarcinoma and corresponding normal tissue samples were obtained from the Sixth Affiliated Hospital of Sun Yat‐sen University (Guangzhou, China). The paraffin‐embedded pathological specimens from 279 patients with colorectal cancer were obtained from the First Affiliated Hospital of Sun Yat‐Sen University between 2001 and 2005. The enrollment criteria included the pathological confirmation of CRC, planned or completed curative surgical resection, no preoperative chemotherapy, and the availability of tumor specimens and follow‐up data. Written informed consent was obtained from each patient. Our study protocol was approved by the local ethics committee of the Sixth Affiliated Hospital of Sun Yat‐sen University.
Cell lines, constructs, siRNAs, and transfection
HEK293T and the DLD‐1 and HCT116 CRC cell lines were purchased from ATCC (Manassas, VA, USA) and cultured in RPMI‐1640 (HyClone, Logan, UT, USA) supplemented with 10% FBS and 1% penicillin–streptomycin. The sequence encoding human RhoGDIα was PCR‐amplified and cloned into a lentiviral expression vector for N‐terminal tagging with an HA‐Flag (under the control of the EF1α promoter) using the Gateway system (Invitrogen, Carlsbad, CA, USA). The siRNA oligos targeting RhoGDIα were purchased from Invitrogen. The sequences were: siControl, 5′‐CACAAGCTGGAGTACAACT‐3′; siRhoGDIα1, 5′‐CAGCGGAGAACGAGGAGGAUGAGCA‐3′; siRhoGDIα2, 5′‐AAGGAGGGUGUGGAGUACCGGAUAA‐3′; and siRhoGDIα‐3, 5′‐CCUGGGAGUGGAAUCUCACCAUCAA‐3′.
HEK293T cells were transfected with RhoGDIα constructs for lentivirus production. DLD‐1 cells were infected with the viruses and selected in puromycin (2.5 μg/mL) for 3 days before analysis. For RNAi, cells were transfected with siRNAs using Lipofectamine 2000 (Invitrogen) for 48 h following the manufacturer's instructions.
Western blotting, immunostaining, and antibodies
Whole‐cell lysates for Western blot analyses were obtained by the direct lysis of cells in 2× Laemmli buffer at 90°C. All samples were resolved by SDS‐PAGE, transferred to PVDF membranes (1620177; Bio‐Rad, Hercules, CA, USA) and probed with the appropriate antibodies. To study the TIF by immunostaining, cells that were plated on glass coverslips were fixed in 4% paraformaldehyde, permeabilized with 0.5% Triton X‐100, and incubated with primary and secondary antibodies.23
The following antibodies were used for Western blotting: anti‐RhoGDIα (133248; Abcam, Cambridge, England), anti‐TRF1 (GTX70290; Genetex, Irvine, CA, USA), anti‐TRF2 (OP129; Calbiochem, Darmstadt, Germany), anti‐β‐actin (sc‐47778; Santa Cruz Biotechnology, Santa Cruz, CA, USA), anti‐GAPDH (10494‐1‐AP; Proteintech Group, Chicago, IL, USA), anti‐Akt (40D4; Cell Signaling Technology), and anti‐phospho‐Akt (Ser473) (9271; Cell Signaling Technology, Danvers, MA, USA). For immunostaining, the antibodies included anti‐TRF2 (OP129; Calbiochem), and anti‐53BP1 (NB100‐304; Novus Biologicals, Littleton, CO, USA).
Telomere length measurement by qRT‐PCR
Telomere length was measured with a real‐time PCR assay as previously described.24 Briefly, genomic DNA was extracted from CRC cells or tissues using a DNeasy Blood & Tissue Kit (Qiagen, Duesseldorf, Germany). The PCR reactions were carried out on the iCycler iQ real‐time PCR detection system (Bio‐Rad) using previously described PCR settings.25 The sequences of the primers were as follows: telomere forward primer 5′‐CGGTTTGTTTGGGTTTGGGTTTGGGTTTGGGTTTGGGTT‐3′, reverse primer 5′‐GGCTTGCCTTACCCTTACCCTTACCCTTACCCTTACCCT‐3′; reference control gene (human 36B4 single copy gene) forward primer 5′‐CAGCAAGTGGGAAGGTGTAATCC‐3′, and reverse primer 5′‐CCCATTCTATCATCAACGGGTACAA‐3′. For each PCR reaction, a standard curve was generated by the serial dilution of a known amount of DNA. The relative telomere length for each sample was determined by the telomere to single copy gene ratio (T/S ratio). Equal amounts of DNA (30 ng) were used for each reaction.
Quantitative RT‐PCR
Total RNA was extracted using an RNeasy kit (Qiagen), and cDNA was synthesized using a c‐DNA kit (Bio‐Rad). Quantitative RT‐PCR was carried out with universal cycling variables on an ABI StepOnePlus instrument using commercially available target probes and Mastermix (from Applied Biosystems). Cycle threshold values were normalized to GAPDH. The qRT‐PCR primer sequences were as follows: RhoGDIα forward, 5′‐GGATGAGCACTCGGTCAACTA‐3′; RhoGDIα reverse, 5′‐GGCCTCCTTGTACTTTCGCAG‐3′; TRF1 forward, 5′‐GAAGGCAGCGGCAAAAGTAG‐3′; TRF1 reverse, 5′‐TGAGGATTCAGTTACCGCAGA‐3′; TRF2 forward, 5′‐GACCTTCCAGCAGAAGAT GCT‐3′, TRF2 reverse, 5′‐GTTGGAGGATTCCGTAGCTG‐3′; RAP1 forward: 5′‐CGGGGAACCACA GAATAAGA‐3′; RAP1 reverse, 5′‐CTCAGGTGTGGGTGGATCAT‐3′; POT1 forward, 5′‐TGGGTA TTGTACCCCTCCAA‐3′; POT1 reverse, 5′‐GATGAAGCATTCCAACCACGG‐3′; TPP1 forward, 5′‐CCCGCAGAGTTCTATCTCCA‐3′; TPP1 reverse, 5′‐GGACAGTGATAGGCCTGCAT‐3′; TIN2 forward, 5′‐GGAGTTTCTGCGATCTCTGC‐3′; TIN2 reverse, 5′‐GATCCCGCACTATAGGTCCA‐3′; GAPDH forward: 5′‐AAGGTGAAGGTCGGAGTCAAC‐3′; and GAPDH reverse, 5′‐GGGGTCATTGATGGC AACAATA‐3′.
Tissue microarray construction and immunohistochemistry
The TMAs were constructed at the Gastrointestinal Institute of Sun Yat‐sen University. The paraffin‐embedded tissue blocks and the corresponding histological H&E‐stained slides were overlaid for tissue TMA sampling. Duplicate cylinders 1 mm in diameter were punched from representative tumor areas of individual donor tissue blocks and re‐embedded into a recipient paraffin block at a defined position using a tissue arraying instrument (MiniCore; Alphelys, Plaisir, France).
Immunohistochemistry analysis was carried out as reported. The paraffin sections were incubated with primary antibody against RhoGDIα (1:100; Abcam) or TRF1 (1:50; Abcam). For the negative control, isotype‐matched antibodies were applied. The staining intensity of each slide was separately scored for tumor by blind evaluation by two experienced pathologists using a semiquantitative IRS. The percentages of positive tumor cells were classified as follows: 1, <25% positive cells; 2, 25–50% positive cells; 3, 50–75% positive cells; and 4, >75% positive cells. The staining intensity was scored as follows: 0, negative; 1, weak; 2, moderate; and 3, strong. Multiplication of these two scores resulted in a score ranging from 0 to 12. Under these conditions, samples with IRS 0–4 and IRS 5–12 were defined as low and high expression, respectively.
Cell proliferation assay
The rate of cell proliferation was determined using the xCELLigence RTCA DP instrument (Roche, Indianapolis, IN, USA), which was placed in a humidified incubator at 37°C and 5% CO2. Cell proliferation experiments were carried out using modified 16‐well plates (E‐plates; Roche). For each experiment, 50 μL medium was added to the wells, and the background readings were recorded. One hundred microliters of cell suspension were added to each well of the E‐plate to achieve a cell density of 5 × 10³ cells/well. Cell activities were expressed as the cell impedance index and were continuously monitored every 15 min.
Cell migration assay
Cell migration experiments were carried out using modified 16‐well plates (CIM‐16; Roche), with each well consisting of an upper and a lower chamber separated by a microporous membrane containing randomly distributed 8‐μm pores. Initially, 165 μL and 30 μL media were added to the lower and upper chambers, respectively, and the CIM‐16 plate was locked in the RTCA DP device at 37°C and 5% CO2 for 60 min to equilibrate according to the manufacturer's guidelines. Cells were then suspended in serum‐free medium, counted and seeded in the upper chamber at a concentration of 4 × 10⁴ cells in 100 μL. After cell addition, the CIM‐16 plates were incubated for 30 min at room temperature in the laminar flow hood to allow the cells to settle onto the membrane according to the manufacturer's guidelines. Signals were detected every 15 min over 24 h of incubation.
Cell invasion assay
The cell invasion experiments were similar to the cell migration assay. Cell invasion/migration plates were coated with 1 μg/μL fibronectin and a 1:50 solution of Matrigel (BD Biosciences, Franklin Lakes, NJ, USA). One hundred sixty‐five microliters of media were added to the lower chambers. Cells were suspended in serum‐free medium, counted and seeded in the upper chamber at a concentration of 4 × 10⁴ cells in 100 μL. Signals were detected every 15 min over the course of 48–72 h of incubation.
Wound healing assay
Cells in medium containing 10% FBS were seeded into the wells of 24‐well plates. After the cells grew to confluence, wounds were made with sterile pipet tips. Cells were washed with PBS and refreshed with medium with or without FBS. After 48 h of incubation at 37°C, the cells were fixed and photographed.
Statistical analysis
Statistical analysis was carried out using the spss statistical software package (standard version 16.0; SPSS, Chicago, IL, USA). The correlation between RhoGDIα and TRF1 expression and the clinicopathologic features of the patients with CRC was analyzed using a χ2‐test or Fisher's exact test. The Spearman test was used to analyze the association between cytoplasmic RhoGDIα and nuclear TRF1. For univariate survival analysis, survival curves were obtained using the Kaplan–Meier method, and differences between the survival curves were assessed with the log–rank test. The Cox proportional hazards regression model was used to identify the independent prognostic factors. All in vitro experiments were carried out in triplicate. The results are described as the mean ± SD. Statistical analysis was undertaken with one‐way anova, and comparisons among groups were made using the independent‐sample t‐test. The results were considered significant at a P‐value less than 0.05.
Results
Rho GDP‐dissociation inhibitor α promotes proliferation, migration, and invasion of CRC cells
To understand the function of RhoGDIα in CRC, two different RhoGDIα‐specific siRNAs were used to silence the expression of RhoGDIα in CRC cells. Both siRNA oligos were highly effective at reducing RhoGDIα levels (>80%) (Figs 1a and S1a). To investigate the possible role of RhoGDIα in CRC, DLD‐1 and HCT116 cells transfected with siRhoGDIα or siControl oligos were seeded in E‐plates or CIM‐plates, and the dynamics of cell growth, migration, and invasion were continuously monitored by an RTCA (Figs 1b–d and S1b–d). Depletion of RhoGDIα resulted in a significantly reduced cell growth rate and decreased the migration and invasion capacities of both DLD‐1 and HCT116 cells (Figs 1b–d and S1b–d). Moreover, in contrast to siControl‐transfected DLD1 cells, the cells transfected with siRhoGDIα displayed inhibited migration in a wound‐healing assay (Fig. 1e). Collectively, RhoGDIα plays an important role in promoting cell proliferation, migration, and invasion in CRC.
Figure 1.
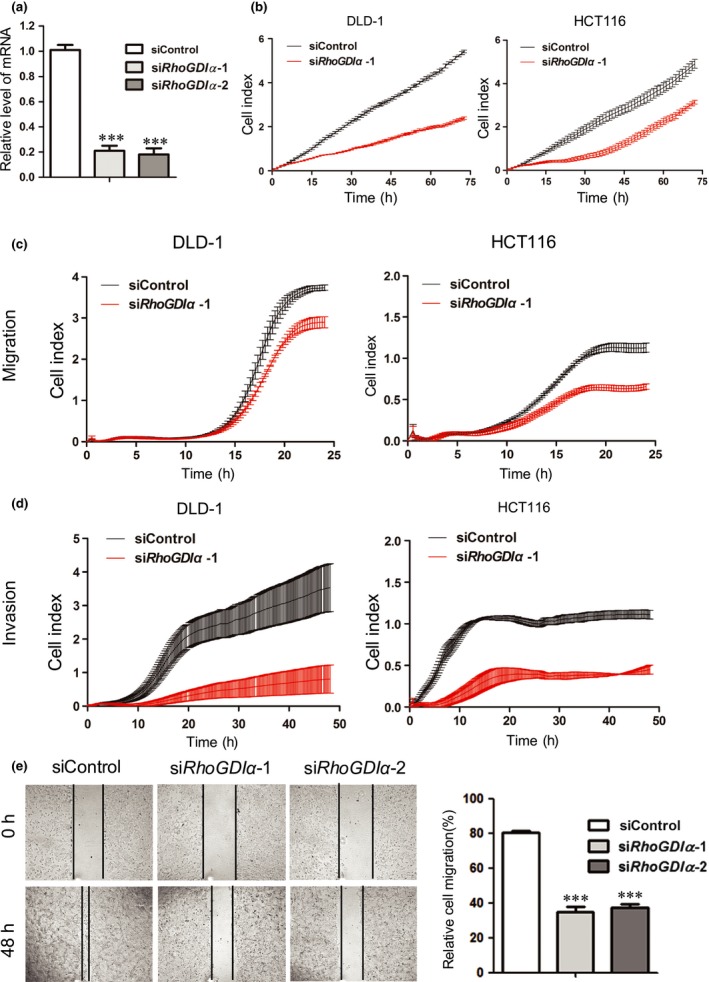
Rho GDP‐dissociation inhibitor α (RhoGDIα) depletion represses colorectal cancer cell proliferation and migration. DLD‐1 cells were transfected with control oligos (siControl) or two different oligos targeting RhoGDIα and analyzed in the following assays. (a) Quantitative real‐time PCR was used to assess RhoGDIα knockdown efficiency. Error bars indicate SD (n = 3). ***P < 0.001. (b) Cells were plated at a density of 5 × 10³ cells per well in an E‐plate and monitored every 15 min for 72 h followed by analysis with the xCELLigence RTCA DP instrument (Roche) to determine the cell proliferation rate. (c,d) Cells were plated at a density of 4 × 10⁴ cells per well in a cell invasion/migration plate and monitored every 15 min in a migration assay and an invasion assay. (e) Cells were examined with a wound‐healing assay to determine cell motility. Photographs were taken 0 and 48 h after the wound was made; 10× objective. Error bars indicate SD (n = 3). ***P < 0.001.
Rho GDP‐dissociation inhibitor α leads to shortened telomere length and telomere dysfunction
To determine the effects of RhoGDIα on telomere dynamics in CRC, we first measured RhoGDIα mRNA levels and relative telomere length in 26 paired CRC tissues and their adjacent non‐tumor tissues using qRT‐PCR (Fig. 2a). The ratio of relative telomere length was determined using the telomere repeat copy number and single copy gene copy number (T/S ratio). The qPCR results showed that the RhoGDIα mRNA level was 65.38% (17/26) higher in tumor tissue than the adjacent non‐tumor tissues. Importantly, the relative RhoGDIα expression in CRC tissues was negatively associated with telomere length (r = −0.468, P = 0.016; Fig. 2a). To further validate these results, we generated DLD‐1 cells stably expressing RhoGDIα or GFP (control) and measured the average telomere length over generations with qRT‐PCR (Fig. 2b). As shown in Figure 2(b), the cells overexpressing RhoGDIα showed shorter telomeres over time than control cells, suggesting that RhoGDIα represses telomere lengthening in CRC. In addition, we investigated whether RhoGDIα functioned in the DNA damage response at telomeres by measuring the number of TIF in DLD‐1 and HCT116 cells (Fig. 2c,d). In both cell lines, when RhoGDIα was overexpressed, the percentage of TIF‐positive (as indicated by 53BP1–telomere co‐localized foci) cells increased significantly (Fig. 2c,d). Taken together, these results indicate that the overexpression of RhoGDIα is responsible for telomere dysregulation in CRC.
Figure 2.
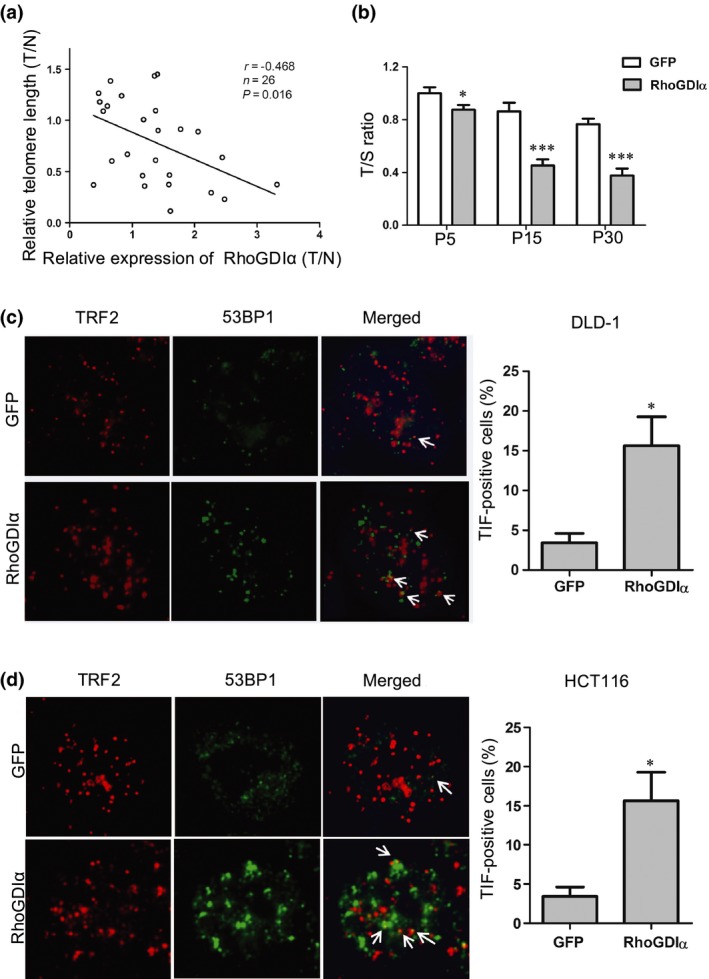
Overexpression of Rho GDP‐dissociation inhibitor α (RhoGDIα) is associated with shortened telomere length and telomere dysfunction. (a) Scatter plot of relative RhoGDIα expression and relative telomere length (T/N, tumor vs normal) in 26 paired colorectal cancer tissues and their adjacent non‐tumor tissues (P = 0.016, r = −0.468; Spearman's rank analysis). Relative RhoGDIα expression and telomere length were determined using quantitative real‐time PCR and quantitative PCR, respectively. (b) DLD‐1 cells stably expressing control (GFP) or RhoGDIα were passaged over time and examined for relative telomere length (as telomere / 36B4 single‐copy gene [T/S] ratios) using quantitative PCR. Error bars indicate SD (n = 3). *P < 0.05; ***P < 0.001. P, passage. (c) Left, representative images of the telomere dysfunction‐induced foci (TIF) assay in DLD‐1 cells stably expressing control (GFP) and RhoGDIα. The DNA damage signal and the telomere signal are indicated by 53BP1 (green) and telomeric repeat factor 2 (TRF2; red), respectively. Arrows indicate 53BP1–telomere co‐localization. Right, percentages of TIF‐positive cells were calculated using the data on the left. Cells with ≥3 co‐localization foci were scored as TIF‐positive. Error bars indicate SD (n = 3). *P < 0.05 compared with control (GFP). (d) TIF assay was carried out in HCT116 cells as described in (c). Left, representative images of TIF. Right, quantification of the percentages of TIF‐positive cells.
Rho GDP‐dissociation inhibitor α enhances TRF1 expression through the PI3K–Akt signaling pathway
As telosome/shelterin proteins are essential for regulating telomere length and suppressing DNA damage signaling,26 we speculated that RhoGDIα may exert its effect by modulating telosome/shelterin proteins. Therefore, we first analyzed the mRNA levels of these six proteins in CRC cells overexpressing RhoGDIα by qRT‐PCR (Fig. 3a). We observed that TRF1 was significantly upregulated in RhoGDIα overexpressing cells compared with control cells (Figs 3a and S2). Consistently, the Western blotting results also showed increased TRF1 expression in RhoGDIα overexpressing cells (Figs 3b and S2d). Moreover, TRF1 expression was downregulated in CRC cells transiently transfected with siRNA oligos targeting RhoGDIα (Figs 3c and S2b), indicating that RhoGDIα could positively regulate TRF1 expression.
Figure 3.
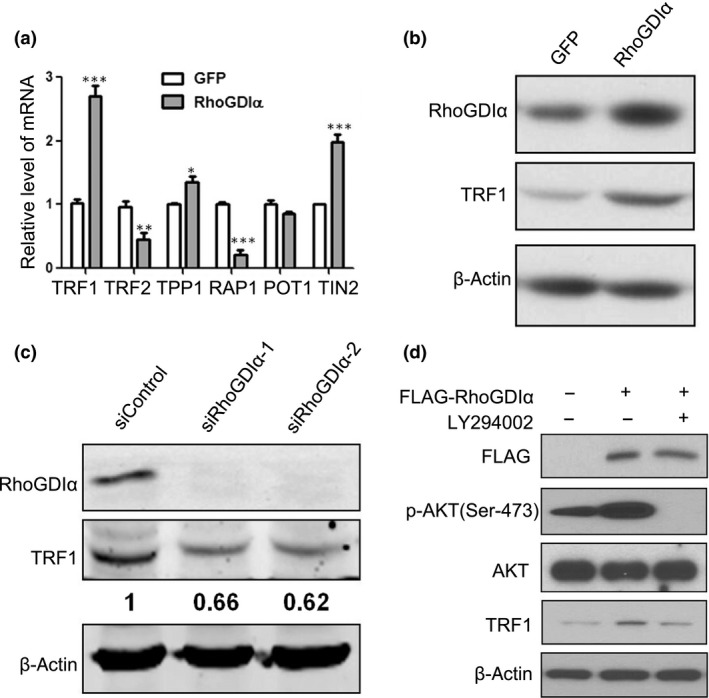
Rho GDP‐dissociation inhibitor α (RhoGDIα) induces telomeric repeat factor 1 (TRF1) expression through the phosphatidylinositol 3‐kinase–protein kinase B (PI3K–Akt) signaling pathway. (a,b) DLD‐1 cells stably expressing a control protein (GFP) or RhoGDIα were analyzed with the following assays. (a) Quantitative real‐time PCR for the expression of six shelterin/telosome proteins. Error bars indicate SD (n = 3). *P < 0.05; **P < 0.01; ***P < 0.001. (b) Western blotting for the expression of RhoGDIα and TRF1. β‐Actin was used as a loading control. (c) DLD‐1 cells transiently transfected with control oligos (siControl) or two different oligos targeting RhoGDIα were analyzed for the expression of RhoGDIα and TRF1 with Western blotting. β‐Actin was used as a loading control. (d) DLD‐1 cells transiently transfected with empty vector, Flag‐tagged RhoGDIα, or treated with the PI3K inhibitor LY294002 were analyzed by Western blotting with the indicated antibodies. β‐Actin was used as a loading control. POT1, protection of telomeres 1; RAP1, Ras‐associated protein 1; TIN2, TERF1‐interacting nuclear factor 2; TPP1, tripeptidyl peptidase 1.
How does RhoGDIα activate TRF1 expression? Given that the overexpression of RhoGDIα can promote cell proliferation and migration through the PI3K/Akt pathway in hepatocellular carcinoma27 and TRF1 was upregulated by Akt and led to telomere shortening,28 we speculated that RhoGDIα probably enhances TRF1 expression through the Akt pathway in CRC. Therefore, we sought to examine the expression levels of these proteins in CRC cells. As shown in Figure 3(d), cells transiently transfected with Flag‐tagged RhoGDIα not only showed increased TRF1 levels, but also significantly increased phosphorylation of Akt (Ser‐473) without changes in the total Akt level (Figs 3d and S2d). Moreover, the additions of the PI3K‐specific inhibitor LY294002 and Akt‐specific inhibitor MK‐2206 2HCl reduced both phosphorylated Akt and TRF1 levels in RhoGDIα‐overexpressing cells (Figs 3d and S2c,d), suggesting that RhoGDIα modulates TRF1 expression through the PI3K–Akt signaling pathway.
Rho GDP‐dissociation inhibitor α and TRF1 expression are correlated with poor prognosis in patients with CRC
Our data proved that RhoGDIα overexpression increases TRF1 expression in CRC cells (Fig. 3b). To further verify their correlation, we evaluated RhoGDIα and TRF1 protein levels in eight pairs of CRC tissues compared with adjacent normal mucosa. As shown in Figure 4(a), compared to the adjacent normal mucosa, most of the CRC tissues had higher RhoGDIα/TRF1 expression levels, suggesting a strong correlation between these two proteins.
Figure 4.
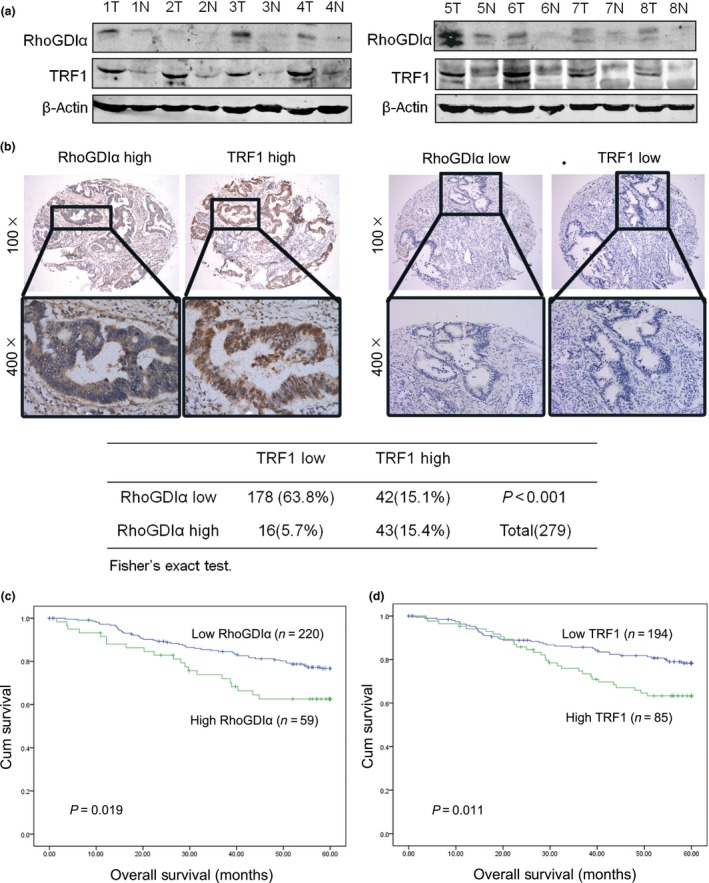
Rho GDP‐dissociation inhibitor α (RhoGDIα) is associated with telomeric repeat factor 1 (TRF1) expression and the survival of patients with colorectal cancer (CRC). (a) Western blot analysis for the expression of RhoGDIα and TRF1 in eight pairs of CRC tissues (T) compared with adjacent normal mucosa (N). β‐Actin was used as a loading control. (b) Immunohistochemical staining for the RhoGDIα and TRF1 proteins in 279 CRC tissues. Representative images (upper panels) showing high expression of RhoGDIα/TRF1 (left) or low expression of RhoGDIα/TRF1 (right) in the same field. Images were captured at magnifications of 100×; the inset shows a higher magnification of 400× (lower panels). Statistical analysis of the correlation between RhoGDIα and TRF1 using Fisher's exact test, P < 0.001. (c) Overall survival curves of 279 patients with CRC with high or low RhoGDIα expression (P = 0.019). (d) Overall survival curves of 279 patients with CRC with high or low TRF1 expression (P = 0.011).
To investigate the clinical relevance, we undertook immunohistochemical staining for RhoGDIα and TRF1 on a tissue microarray containing 279 human CRC specimens. The immunohistochemical staining of RhoGDIα and TRF1 in representative CRC samples is shown in Figure 4(b). The clinicopathological characteristics of the patients with CRC are shown in Table 1. We used a ROC curve to determine cut‐off scores for RhoGDIα/TRF1 expression and divided the patients with CRC into high and low RhoGDIα/TRF1 expression groups according to the cut‐off scores (Fig. S3). In the cohort, high expression of RhoGDIα/TRF1 was found in 59/279 (21.1%) and 85/279 (30.5%) of CRC patients, respectively. There was no significant association between RhoGDIα/TRF1 expression and clinicopathologic features, such as patient gender, age, histological grade, T classification, N classification, distant metastasis, or clinical stage (Table 1). A significant positive correlation between the overexpression of RhoGDIα and TRF1 was shown in our cohort of CRC tissue (Fig. 4b, P < 0.001). The above results suggested that TRF1 expression is linked to RhoGDIα expression in CRC.
Table 1.
Correlation between the expression of Rho GDP‐dissociation inhibitor α (RhoGDIα), telomeric repeat factor 1 (TRF1), and clinicopathologic features in colorectal cancer
| RhoGDIα | P‐value† | TRF1 | P‐value† | |||
|---|---|---|---|---|---|---|
| Low (%) | High (%) | Low (%) | High (%) | |||
| All patients | 220 | 59 | 194 | 85 | ||
| Sex | ||||||
| Male | 117 (53.2) | 35 (59.3) | 0.400 | 107 (55.2) | 45 (52.9) | 0.733 |
| Female | 103 (46.8) | 24 (40.7) | 87 (44.8) | 40 (47.1) | ||
| Age, years‡ | ||||||
| <60 | 110 (50.0) | 20 (33.9) | 0.039 | 98 (50.5) | 32 (37.6) | 0.051 |
| ≥60 | 110 (50.0) | 39 (66.1) | 96 (49.5) | 53 (62.4) | ||
| Histological grade | ||||||
| G1–G2 | 191 (86.8) | 51 (86.4) | 0.939 | 166 (85.6) | 76 (89.4) | 0.447 |
| G3 | 29 (13.2) | 8 (13.6) | 28 (14.4) | 9 (10.6) | ||
| pT status | ||||||
| 1–2 | 35 (15.9) | 4 (6.8) | 0.090 | 28 (14.4) | 11 (12.9) | 0.852 |
| 3–4 | 185 (84.1) | 55 (93.2) | 166 (85.6) | 74 (87.1) | ||
| pN status | ||||||
| 0 | 135 (61.4) | 39 (66.1) | 0.548 | 117 (60.3) | 57 (67.1) | 0.347 |
| 1 | 85 (38.6) | 20 (33.9) | 77 (39.7) | 28 (32.9) | ||
| pM status | ||||||
| pM0 | 201 (91.4) | 53 (89.8) | 0.797 | 177 (91.2) | 77 (90.6) | 0.824 |
| pM1 | 19 (8.6) | 6 (10.2) | 17 (8.8) | 8 (9.4) | ||
| Clinical stage | ||||||
| I+II | 123 (55.9) | 35 (59.3) | 0.660 | 106 (54.6) | 52 (61.2) | 0.359 |
| III+IV | 97 (44.1) | 24 (40.7) | 88 (45.4) | 33 (38.8) | ||
All data are expressed as number of patients (%). †P‐values calculated in spss 16.0 using the χ2‐test. P‐values <0.05 were considered statistically significant. ‡Median age.
Univariate analysis indicated that N stage, M stage, RhoGDIα, and TRF1 expression are significantly associated with the survival of patients (Table 2). Figure 4(c,d) shows the Kaplan–Meier curves for RhoGDIα and TRF1 and 5‐year overall survival in 279 patients with CRC and reveals the significantly poorer survival for patients with high RhoGDIα or TRF1 expression (P < 0.05). In Cox proportional hazards analyses, high RhoGDIα or TRF1 expression was associated with unfavorable patient outcome (HR, 2.11; 95% CI, 1.23–3.61; and HR, 2.18; 95% CI, 1.34–3.55, respectively). Multivariate Cox regression analysis indicated that N stage and M stage were independent prognostic factors for patients with CRC (Table 3).
Table 2.
Univariate analysis of different prognostic parameters in patients with colorectal cancer
| Number | Mean survival, months | P‐valuea | |
|---|---|---|---|
| All patients | 279 | 51.476 | |
| Sex | |||
| Male | 152 | 52.036 | 0.666 |
| Female | 127 | 50.785 | |
| Age, years | |||
| <60 | 130 | 53.105 | 0.082 |
| ≥60 | 149 | 50.080 | |
| Histological grade | |||
| G1–G2 | 242 | 52.430 | 0.112 |
| G3 | 37 | 45.148 | |
| pT status | |||
| 1–2 | 39 | 56.211 | 0.218 |
| 3–4 | 240 | 50.703 | |
| pN status | |||
| 0 | 174 | 53.402 | 0.021 |
| 1 | 105 | 48.179 | |
| pM status | |||
| 0 | 254 | 54.084 | <0.001 |
| 1 | 25 | 25.749 | |
| RhoGDIα expression | |||
| Low | 220 | 52.767 | 0.019 |
| High | 59 | 46.618 | |
| TRF1 expression | |||
| Low | 194 | 52.859 | 0.011 |
| High | 85 | 48.345 | |
P‐values calculated in spss 16.0 using the log–rank test. P‐values <0.05 were considered statistically significant. RhoGDI, Rho GDP‐dissociation inhibitor; TRF1, telomeric repeat factor 1.
Table 3.
Multivariate analysis of different prognostic parameters in patients with colorectal cancer
| HR (95% CI) | P‐valuea | |
|---|---|---|
| RhoGDIα | ||
| Gender (male vs female) | 1.486 (0.906–2.437) | 0.116 |
| Age, years (<60 vs ≥60) | 1.641 (0.999–2.694) | 0.050 |
| Histological grade (G1/2 vs G3) | 1.334 (0.700–2.544) | 0.382 |
| pT status (T1/2 vs T3/4) | 1.013 (0.450–2.284) | 0.975 |
| pN status (N0 vs N1) | 2.307 (1.410–3.772) | 0.001 |
| pM status (M0 vs M1) | 13.666 (7.624–24.498) | <0.001 |
| RhoGDIα expression (low vs high) | 2.106 (1.229–3.607) | 0.007 |
| TRF1 | ||
| Gender (male vs female) | 1.351 (0.835–2.187) | 0.220 |
| Age, years (<60 vs ≥60) | 1.649 (1.005–2.708) | 0.048 |
| Histological grade (G1/2 vs G3) | 1.556 (0.820–2.949) | 0.176 |
| pT status (T1/2 vs T3/4) | 1.255 (0.560–2.814) | 0.582 |
| pN status (N0 vs N1) | 2.365 (1.448–3.864) | 0.001 |
| pM status (M0 vs M1) | 12.840 (7.281–22.645) | <0.001 |
| TRF1 expression (low vs high) | 2.180 (1.340–3.548) | 0.002 |
Multivariate Cox regression analysis including gender, age, histological grade, T status, N status, M status, Rho GDP‐dissociation inhibitor α (RhoGDIα) expression status, or telomeric repeat factor 1 (TRF1) expression status. CI, confidence interval; HR, hazard ratio.
Discussion
Reports have shown that the expression levels of RhoGDIα are upregulated or downregulated in different cancers and are tightly linked to the degree of malignancy, indicating a complex and crucial role of RhoGDIα in cancer development.29, 30 For example, microRNA‐151 can directly target and inhibit RhoGDIα to facilitate hepatocellular carcinoma cell migration.31 In breast cancer, RhoGDIα is a downstream target repressed by 14‐3‐3τ, suppressing tumor metastasis and invasion.32 In glioblastoma, RhoGDIα interacts with β8 integrin to regulate Rac1 and Cdc42 activation and drive glioblastoma cell migration and invasion.33, 34 In lung adenocarcinoma, RhoGDIα is repressed by microRNA‐483‐5p and negatively regulates the expression of Snail, thereby serving as a metastasis suppressor and inhibiting epithelial–mesenchymal transition.12 However, in another report into prostate cancer, RhoGDIα was identified as a tumor suppressor that can inhibit tumor growth in vitro and in vivo, suggesting that RhoGDIα plays different roles in different cancers.35
In this study, we have shown that the level of RhoGDIα was markedly upregulated in eight paired CRC tissues using Western blot analysis (Fig. 4a) and further confirmed this result with immunohistochemical analysis of a TMA containing 279 CRC tissues and matched adjacent normal mucosa (Fig. 4b); these results are similar to the results observed in 126 CRC cases by Zhao et al.29 Our data suggest that RhoGDIα may serve as an oncogene in CRC progression. Indeed, RhoGDIα depletion in DLD‐1 and HCT116 cells strongly repressed cell proliferation, invasion, and motility, consistent with a previous report indicating that the overexpression of RhoGDIα promoted cell proliferation and migration in HT29 colon cancer cells.29 Until now, the mechanism underlying RhoGDIα in CRC development is still far from being fully understood. In our observation, high RhoGDIα expression is correlated with shortened telomere length in CRC tissues, and the overexpression of RhoGDIα leads to telomere attrition in CRC cells. We also found an increase in TIFs in RhoGDIα‐overexpressing cells. Furthermore, we showed that RhoGDIα is capable of promoting TRF1 expression through Akt signaling. Taken together, our data unveil a previously unknown link between RhoGDIα and telomere dysregulation in CRC.
Our study shows that, among the six proteins in the telosome/shelterin complex, TRF1 is the most highly activated by RhoGDIα in CRC cells, as demonstrated by both gain‐of‐function and loss‐of‐function assays (Fig. 3b,c). Given that RhoGDIα overexpression is correlated with shortened telomeres (Fig. 2a,b) and that TRF1 is a negative regulator of telomere length,36 it is possible that RhoGDIα controls telomere length through TRF1 activation. Notably, our previous high‐throughput screening and bimolecular fluorescence complementation assay (data not shown) revealed that RhoGDIα could bind to TRF1.37 However, Flag‐tagged RhoGDIα failed to co‐immunoprecipitate with TRF1 (data not shown). One possible explanation is that the binding of these two proteins is too weak to be detected by co‐immunoprecipitation, which may favor high‐affinity interactions. It is also possible that additional factors are required for bridging the interaction between RhoGDIα and TRF1. Here, we provide evidence that RhoGDIα can mediate TRF1 expression through the PI3K–Akt pathway (Fig. 3d). Although the dysregulation of PI3K–Akt signaling is well known in tumor progression and leads to telomere dysfunction,3, 38 this is the first study to reveal that excessive PI3K–Akt signaling can be triggered by RhoGDIα and further induces TRF1 expression in CRC.
Our analysis showed high expression of TRF1 in CRC tissues; this was correlated with shortened survival. Genetic TRF1 ablation impairs the growth of p53‐null K‐Ras(G12V)‐induced lung carcinomas and increases mouse survival.38 In 91 samples from patients with CRC, higher TRF1 levels were observed in the CRC tissues than their paired control tissues. Additionally, patients with shortened telomeres showed higher TRF1 levels.39 A previous study found TRF1 and TRF2 staining was stronger in invasive colon cancer than low grade dysplasia, while telomeres were significantly shortened in colon dysplasia.22
Disclosure Statement
The authors have no conflict of interest.
Abbreviations
- Akt
protein kinase B
- CIM
cell invasion/migration
- CRC
colorectal cancer
- IRS
immunoreactivity score
- PI3K
phosphatidylinositol 3‐kinase
- POT
protection of telomeres
- qRT‐PCR
quantitative real‐time PCR
- RAP1
Ras‐associated protein 1
- RhoGDI
Rho GDP‐dissociation inhibitor
- RTCA
real‐time cell analyzer
- TIF
telomere‐dysfunction‐induced foci
- TIN
TERF1‐interacting nuclear factor
- TMA
tissue microarray
- TPP
tripeptidyl peptidase 1
- TRF
telomeric repeat factor
Supporting information
Fig. S1. Rho GDP‐dissociation inhibitor α (RhoGDIα) depletion represses colorectal cancer cell proliferation and migration. (a) Quantitative real‐time PCR was used to assess RhoGDIα knockdown efficiency in HCT116 cells. Error bars indicate SD (n = 3). ***P < 0.001. (b–d) Colorectal cancer cells were transfected with siControl or siRhoGDIα‐2 oligos. The xCELLigence RTCA DP instrument (Roche) was used to determine the cell proliferation rate, and migration and invasion assays were carried out.
Fig. S2. Rho GDP‐dissociation inhibitor α (RhoGDIα) induces telomeric repeat factor 1 (TRF1) expression through the phosphatidylinositol 3‐kinase–protein kinase B (PI3K–Akt) signaling pathway. (a) Quantitative real‐time PCR for the expression of six shelterin/telosome proteins in HCT116 cells expressing GFP or RhoGDIα. Error bars indicate SD (n = 3). **P < 0.01. (b) HCT116 cells transiently transfected with control oligos (siControl) or two different oligos targeting RhoGDIα were analyzed for the expression of RhoGDIα and TRF1 with Western blotting. GAPDH was used as a loading control. (c,d) Colorectal cancer cells transiently transfected with empty vector, Flag‐tagged RhoGDIα, treated with the PI3K inhibitor LY294002 or the Akt inhibitor MK‐2206 2HCl, were analyzed by Western blotting with the indicated antibodies. GAPDH was used as a loading control.
Fig. S3. Receiver–operating characteristic curves to determine cut‐off scores for Rho GDP‐dissociation inhibitor α (RhoGDIα) and telomeric repeat factor 1 (TRF1) expression in patients with colorectal cancer.
Acknowledgments
This work was supported by the National Natural Science Foundation of China (Grant Nos. 81602429, 81630072, and 31601179), by 973 Projects from the Ministry of Science and Technology of China (Grant No. 2015CB554000), and by the Natural Science Foundation of Guangdong Province (Grant No. 2016A030310209). This work was also supported by the National Key Technology R&D Program for the 12th Five‐Year Plan of China (Grant No. 2014BAI09B06).
Cancer Sci 108 (2017) 1293–1302
Funding Information
National Natural Science Foundation of China, (Grant/Award Number: ‘81602429’, ‘81630072’, ‘31601179’), 973 Projects from Ministry of Science and Technology of China, (Grant/Award Number: ‘2015CB554000’), National Key Clinical Discipline.
Contributor Information
Junjiu Huang, Email: hjunjiu@mail.sysu.edu.cn.
Lekun Fang, Email: fanglk3@mail.sysu.edu.cn.
References
- 1. Torre LA, Bray F, Siegel RL, Ferlay J, Lortet‐Tieulent J, Jemal A. Global cancer statistics, 2012. CA Cancer J Clin 2015; 65(2): 87–108. [DOI] [PubMed] [Google Scholar]
- 2. Lan YT, Jen‐Kou L, Lin CH et al Mutations in the RAS and PI3K pathways are associated with metastatic location in colorectal cancers. J Surg Oncol 2015; 111: 905–10. [DOI] [PubMed] [Google Scholar]
- 3. Fang L, Lu W, Choi HH et al ERK2‐dependent phosphorylation of CSN6 is critical in colorectal cancer development. Cancer Cell 2015; 28: 183–97. [DOI] [PMC free article] [PubMed] [Google Scholar]
- 4. Garcia‐Mata R, Boulter E, Burridge K. The ‘invisible hand’: regulation of RHO GTPases by RHOGDIs. Nat Rev Mol Cell Biol 2011; 12: 493–504. [DOI] [PMC free article] [PubMed] [Google Scholar]
- 5. DerMardirossian C, Bokoch GM. GDIs: central regulatory molecules in Rho GTPase activation. Trends Cell Biol 2005; 15: 356–63. [DOI] [PubMed] [Google Scholar]
- 6. Boulter E, Garcia‐Mata R, Guilluy C et al Regulation of Rho GTPase crosstalk, degradation and activity by RhoGDI1. Nat Cell Biol 2010; 12: 477–83. [DOI] [PMC free article] [PubMed] [Google Scholar]
- 7. Dovas A, Couchman JR. RhoGDI: multiple functions in the regulation of Rho family GTPase activities. Biochem J 2005; 390(Pt 1): 1–9. [DOI] [PMC free article] [PubMed] [Google Scholar]
- 8. Fukumoto Y, Kaibuchi K, Hori Y et al Molecular cloning and characterization of a novel type of regulatory protein (GDI) for the rho proteins, ras p21‐like small GTP‐binding proteins. Oncogene 1990; 5: 1321–8. [PubMed] [Google Scholar]
- 9. Leonard D, Hart MJ, Platko JV et al The identification and characterization of a GDP‐dissociation inhibitor (GDI) for the CDC42Hs protein. J Biol Chem 1992; 267: 22860–8. [PubMed] [Google Scholar]
- 10. Li W, Wang H, Jin X, Zhao L. Loss of RhoGDI is a novel independent prognostic factor in hepatocellular carcinoma. Int J Clin Exp Pathol 2013; 6: 2535–41. [PMC free article] [PubMed] [Google Scholar]
- 11. Cao Z, Li X, Li J et al SUMOylation of RhoGDIalpha is required for its repression of cyclin D1 expression and anchorage‐independent growth of cancer cells. Mol Oncol 2014; 8: 285–96. [DOI] [PMC free article] [PubMed] [Google Scholar]
- 12. Song Q, Xu Y, Yang C et al miR‐483‐5p promotes invasion and metastasis of lung adenocarcinoma by targeting RhoGDI1 and ALCAM. Can Res 2014; 74: 3031–42. [DOI] [PubMed] [Google Scholar]
- 13. Yamashita T, Okamura T, Nagano K et al Rho GDP‐dissociation inhibitor alpha is associated with cancer metastasis in colon and prostate cancer. Pharmazie 2012; 67: 253–5. [PubMed] [Google Scholar]
- 14. Zhao L, Wang H, Sun X, Ding Y. Comparative proteomic analysis identifies proteins associated with the development and progression of colorectal carcinoma. FEBS J 2010; 277: 4195–204. [DOI] [PubMed] [Google Scholar]
- 15. Harley CB, Futcher AB, Greider CW. Telomeres shorten during ageing of human fibroblasts. Nature 1990; 345: 458–60. [DOI] [PubMed] [Google Scholar]
- 16. Capper R, Britt‐Compton B, Tankimanova M et al The nature of telomere fusion and a definition of the critical telomere length in human cells. Genes Dev 2007; 21: 2495–508. [DOI] [PMC free article] [PubMed] [Google Scholar]
- 17. Artandi SE, Chang S, Lee SL et al Telomere dysfunction promotes non‐reciprocal translocations and epithelial cancers in mice. Nature 2000; 406: 641–5. [DOI] [PubMed] [Google Scholar]
- 18. Chan SR, Blackburn EH. Telomeres and telomerase. Philos Trans R Soc Lond B Biol Sci 2004; 359: 109–21. [DOI] [PMC free article] [PubMed] [Google Scholar]
- 19. Martinez P, Thanasoula M, Munoz P et al Increased telomere fragility and fusions resulting from TRF1 deficiency lead to degenerative pathologies and increased cancer in mice. Genes Dev 2009; 23: 2060–75. [DOI] [PMC free article] [PubMed] [Google Scholar]
- 20. Kojima K, Hiyama E, Otani K et al Telomerase activation without shortening of telomeric 3′‐overhang is a poor prognostic factor in human colorectal cancer. Cancer Sci 2011; 102: 330–5. [DOI] [PubMed] [Google Scholar]
- 21. Izgi A, Gunal A, Yalcin S, Gunduz U. Telomere 1 (POT1) gene expression and its association with telomerase activity in colorectal tumor samples with different pathological features. Biomed Pharmacother 2014; 68: 8416. [DOI] [PubMed] [Google Scholar]
- 22. Raynaud CM, Jang SJ, Nuciforo P et al Telomere shortening is correlated with the DNA damage response and telomeric protein down‐regulation in colorectal preneoplastic lesions. Ann Oncol 2008; 19: 1875–81. [DOI] [PubMed] [Google Scholar]
- 23. Chiang CJ, Yang YW, Chen JD et al Significant reduction in end‐stage liver diseases burden through national viral hepatitis therapy program in Taiwan. Hepatology 2015; 61(4): 1154–62. [DOI] [PubMed] [Google Scholar]
- 24. Cawthon RM. Telomere measurement by quantitative PCR. Nucleic Acids Res 2002; 30(10): e47. [DOI] [PMC free article] [PubMed] [Google Scholar]
- 25. Li R, Maminishkis A, Wang FE, Miller SS. PDGF‐C and ‐D induced proliferation/migration of human RPE is abolished by inflammatory cytokines. Invest Ophthalmol Vis Sci 2007; 48: 5722–32. [DOI] [PubMed] [Google Scholar]
- 26. Bilsland AE, Cairney CJ, Keith WN. Targeting the telomere and shelterin complex for cancer therapy: current views and future perspectives. J Cell Mol Med 2011; 15: 179–86. [DOI] [PMC free article] [PubMed] [Google Scholar]
- 27. Wang H, Wang B, Liao Q et al Overexpression of RhoGDI, a novel predictor of distant metastasis, promotes cell proliferation and migration in hepatocellular carcinoma. FEBS Lett 2014; 588: 503–8. [DOI] [PubMed] [Google Scholar]
- 28. Chen YC, Teng SC, Wu KJ. Phosphorylation of telomeric repeat binding factor 1 (TRF1) by Akt causes telomere shortening. Cancer Invest 2009; 27(1): 24–8. [DOI] [PubMed] [Google Scholar]
- 29. Zhao L, Wang H, Li J, Liu Y, Ding Y. Overexpression of Rho GDP‐dissociation inhibitor alpha is associated with tumor progression and poor prognosis of colorectal cancer. J Proteome Res 2008; 7: 3994–4003. [DOI] [PubMed] [Google Scholar]
- 30. Jiang WG, Watkins G, Lane J et al Prognostic value of rho GTPases and rho guanine nucleotide dissociation inhibitors in human breast cancers. Clin Cancer Res 2003; 9: 6432–40. [PubMed] [Google Scholar]
- 31. Ding J, Huang S, Wu S et al Gain of miR‐151 on chromosome 8q24.3 facilitates tumour cell migration and spreading through downregulating RhoGDIA. Nat Cell Biol 2010; 12: 390–9. [DOI] [PubMed] [Google Scholar]
- 32. Xiao Y, Lin VY, Ke S, Lin GE, Lin FT, Lin WC. 14‐3‐3tau promotes breast cancer invasion and metastasis by inhibiting RhoGDIalpha. Mol Cell Biol 2014; 34: 2635–49. [DOI] [PMC free article] [PubMed] [Google Scholar]
- 33. Lee HS, Cheerathodi M, Chaki SP et al Protein tyrosine phosphatase‐PEST and beta8 integrin regulate spatiotemporal patterns of RhoGDI1 activation in migrating cells. Mol Cell Biol 2015; 35: 1401–13. [DOI] [PMC free article] [PubMed] [Google Scholar]
- 34. Reyes SB, Narayanan AS, Lee HS et al alphavbeta8 integrin interacts with RhoGDI1 to regulate Rac1 and Cdc42 activation and drive glioblastoma cell invasion. Mol Biol Cell 2013; 24: 474–82. [DOI] [PMC free article] [PubMed] [Google Scholar]
- 35. Zhu Y, Tummala R, Liu C et al RhoGDIalpha suppresses growth and survival of prostate cancer cells. Prostate 2012; 72: 392–8. [DOI] [PMC free article] [PubMed] [Google Scholar]
- 36. van Steensel B, de Lange T. Control of telomere length by the human telomeric protein TRF1. Nature 1997; 385: 740–3. [DOI] [PubMed] [Google Scholar]
- 37. Lee OH, Kim H, He Q et al Genome‐wide YFP fluorescence complementation screen identifies new regulators for telomere signaling in human cells. Mol Cell Proteomics 2011; 10(2): M110 001628. [DOI] [PMC free article] [PubMed] [Google Scholar]
- 38. Garcia‐Beccaria M, Martinez P, Mendez‐Pertuz M et al Therapeutic inhibition of TRF1 impairs the growth of p53‐deficient K‐RasG12V‐induced lung cancer by induction of telomeric DNA damage. EMBO Mol Med 2015; 7: 930–49. [DOI] [PMC free article] [PubMed] [Google Scholar]
- 39. Garcia‐Aranda C, de Juan C, Diaz‐Lopez A et al Correlations of telomere length, telomerase activity, and telomeric‐repeat binding factor 1 expression in colorectal carcinoma. Cancer 2006; 106: 541–51. [DOI] [PubMed] [Google Scholar]
Associated Data
This section collects any data citations, data availability statements, or supplementary materials included in this article.
Supplementary Materials
Fig. S1. Rho GDP‐dissociation inhibitor α (RhoGDIα) depletion represses colorectal cancer cell proliferation and migration. (a) Quantitative real‐time PCR was used to assess RhoGDIα knockdown efficiency in HCT116 cells. Error bars indicate SD (n = 3). ***P < 0.001. (b–d) Colorectal cancer cells were transfected with siControl or siRhoGDIα‐2 oligos. The xCELLigence RTCA DP instrument (Roche) was used to determine the cell proliferation rate, and migration and invasion assays were carried out.
Fig. S2. Rho GDP‐dissociation inhibitor α (RhoGDIα) induces telomeric repeat factor 1 (TRF1) expression through the phosphatidylinositol 3‐kinase–protein kinase B (PI3K–Akt) signaling pathway. (a) Quantitative real‐time PCR for the expression of six shelterin/telosome proteins in HCT116 cells expressing GFP or RhoGDIα. Error bars indicate SD (n = 3). **P < 0.01. (b) HCT116 cells transiently transfected with control oligos (siControl) or two different oligos targeting RhoGDIα were analyzed for the expression of RhoGDIα and TRF1 with Western blotting. GAPDH was used as a loading control. (c,d) Colorectal cancer cells transiently transfected with empty vector, Flag‐tagged RhoGDIα, treated with the PI3K inhibitor LY294002 or the Akt inhibitor MK‐2206 2HCl, were analyzed by Western blotting with the indicated antibodies. GAPDH was used as a loading control.
Fig. S3. Receiver–operating characteristic curves to determine cut‐off scores for Rho GDP‐dissociation inhibitor α (RhoGDIα) and telomeric repeat factor 1 (TRF1) expression in patients with colorectal cancer.