Abstract
Structural properties of sixteen (16) commercial samples of graphene-based materials (GBM) labelled as graphene, graphene oxide or reduced graphene oxide are investigated at room temperature using X-ray diffraction (XRD) and Raman spectroscopy. Based on the observed correlation between the results obtained with these two techniques, these samples are classified into three groups: Group A of seven samples consisting of graphitic nanosheets with evaluated thickness ≃20 nm and exhibiting both the 2H and 3R phases in XRD; Group B of six samples exhibiting XRD spectra characteristic of either graphene oxides (GO) or carbons with some order; and Group C of three samples with XRD spectra characteristic of disordered carbons. The relative intensities and widths of D, G, D′, 2D and (D + D′) bands in the Raman spectra are equally distinguishable between the samples in groups A, B and C. The width of the D-band is the smallest for Group A samples, intermediate for group B and the largest for group C samples. The intensity ratio I(D)/I(G) of the D and G bands in the Raman spectra of the samples is used to quantify the Raman-active defects whose concentration increases in going from samples in Group A to those in Group C.
1. Introduction
There continues to be great interest in the properties of graphene and graphene-based materials (GBM) because of the interesting physics resulting from these investigations and because of the many potential applications of these materials [1–5]. Along with this great interest in GBM, a number of recent studies have also been published on the important issue of the toxicology of GBM [6–8]. Since GBM are also now available from commercial sources, it is important to characterize the properties of these commercial samples of GBM. In this connection, we recently reported detailed X-ray diffraction (XRD) investigations of seven samples of graphene and graphene nano-plates [9]. These investigations showed that these samples contained both the 2H (ABA…) and 3R (ABCA…) phases of the graphite structure, typically yielding the concentration of 60/40 for the ratio of the 2H/3R phases. This presence of the 3R structure is important since unlike the 2H structure, the 3R phase is a semiconductor with tunable band gap [10, 11]. These seven samples were shown to contain several dozen sheets of graphene stacked on top of each other yielding a thickness of about 20 nm [9].
In this work, we have extended our investigations to sixteen (16) commercially available samples of GBM which are sold either as graphene, graphene oxide (GO) or reduced GO. In addition to the use of XRD, we have also employed the technique of Raman spectroscopy to characterize these samples. Based on the distinct features in the observed patterns of the XRD and Raman spectra of these samples and correlation among these features, these sixteen samples are divided into three groups: Group A of seven samples consisting of graphitic nanosheets, Group B of six samples consisting of either GO or ordered carbons and Group C consisting of disordered carbons. The ratio of the intensities I(D)/I(G) of the D band and G band in the Raman spectra of these samples is then used to determine the concentration nD of the Raman active defects in these samples. It is found that nD increases systematically from samples in group A to those in Group B and then Group C concomitant with the increasing width of the Raman D-band in these samples. Details of these results and their discussion and analysis are presented below.
2. Samples and experimental details
The list of the sixteen (16) samples and their respective commercial suppliers are listed in Table 1. These samples were characterized at room temperature by X-ray diffraction (XRD) and Raman spectroscopy. X-ray diffraction measurements were carried out using a Rigaku D-Max diffractometer equipped with a CuKα source (wavelength λ = 0.154185 nm). The powdered samples were hand-pressed on to a special silicon plate with a few drops of ethyl alcohol; the background signal from the silicon being negligible in the scan range of 2θ = 1° to 75°. The data were acquired in the step-scan mode using steps of 0.01° with a counting time of 6 s at each step.
Table 1.
Important parameters of the commercial samples used in this research. The symbols in the table represent the following terms: ACSM: ACS Materials; GS: Graphene Supermarket; NAM: Nanostructured and Amorphous Materials; CT: Cheap Tubes; Nan: Nanocs.net; GR: Graphene; GO: Graphene oxide; C: Carbon; DC: Disordered Carbon. Separation of the samples in Group B into B(1) and B(2) based on XRD is discussed in the text.
| Sample | Commercial name | Commercial source | Group | Phase detected | I(D)/I(G) |
|---|---|---|---|---|---|
| 1 | Graphene nanoplates (2–10 nm) | ACSM | A | GR | 0.22 |
| 2 | Graphene oxide | ACSM | B(1) | GO | 1.46 |
| 3 | Carboxyl graphene | ACSM | B(1) | GO | 1.50 |
| 4 | Single layer graphene (nitrogen doped) | ACSM | C | DC | 1.92 |
| 5 | Single layer graphene | ACSM | C | DC | 1.96 |
| 6 | Graphene nanopowder (12 nm flakes-A03) | GS | A | GR | 1.09 |
| 7 | Graphene nanopowder (8 nm flakes-A02) | GS | A | GR | 1.33 |
| 8 | Graphene nanopowder (multilayer flakes-A04) | GS | A | GR | 0.70 |
| 9 | High porosity reduced graphene oxide | GS | B(2) | C | 1.54 |
| 10 | Graphene nanopowder (3 nm-A01) | GS | B(2) | C | 1.55 |
| 11 | Graphene nanopowder | NAM | C | DC | 1.73 |
| 12 | Few layer graphene oxide (2–4 layers) | CT | B(1) | GO | 1.56 |
| 13 | Graphene oxide reduced | Nan | B(2) | C | 1.60 |
| 14 | Few layer graphene oxide (4–8 layers) | CT | A | GR | 0.99 |
| 15 | Graphene nanoplates (grade 4, 99% COOH rich) | CT | A | GR | 0.83 |
| 16 | Graphene nanoplates (grade 4, 99% N2 rich) | CT | A | GR | 0.82 |
The Raman spectra were acquired using a Renishaw inVia Raman Microscope (Renishaw Inc., Chicago, IL) with the following specifications: laser wavelength λL = 532 nm, spectral resolution = 1 cm−1 and groove density of the grating = 1800 lines/mm. To obtain good signal to noise, the laser beam was focused on the samples with a 5× objective of the microscope and exposure time was 10 s while taking 15 accumulations using 100% of the laser power (11.6 mW). The data were taken at room temperature in the scan range of 1000–3500 cm−1. In order to determine the intensities (area under the peaks) and full widths at half-maximum (FWHM) of the Raman lines, the Raman spectra were fitted to the Lorentzian curves using WiRE 3.4 software provided with the Renishaw spectrometer. To obtain the error bars associated with this analysis, similar analysis was carried out using OriginLab 9.0 software since WiRE 3.4 software does not provide this information. Typical error bars for FWHM and intensities are 1–2%.
Based on the XRD and Raman data, these samples are classified into three groups: Group A, B and C, with the samples in group B further split into sub-groups B(1) and B(2) based on differences in their XRD spectra although the Raman spectra for these samples are similar. If the characteristics of the Raman spectra for samples in groups B(1) and B(2) were significantly different, then it would have been proper to designate separate groups for them.
For samples in group A, the XRD pattern is that of multilayer graphite nanosheets which has been discussed in some detail in our recent paper [9]. For samples in group B(1), the XRD patterns as shown later resemble that of GO with interlayer spacing d ∼ 0.9 nm whereas the XRD patterns of samples in group B(2) are characteristic of carbons with some degree of ordering. For samples in group C, the XRD patterns are similar to those for disordered carbons. These samples are numbered from 1 to 16 as we received them from commercial suppliers and so they are not in any particular numerical order in terms of their placement in Groups A, B(1), B(2) and C. For this reason, this numbering of the samples has been also used in the identification of the spectra for these samples presented here in the figures as well as at appropriate places in this paper.
3. Experimental results and analysis
3.1. X-ray diffraction
The XRD patterns of the samples in group A displaying the features of the graphite structure are collected in Fig. 1. These are near identical to the XRD patterns reported in our recent paper dealing with the detection and quantification of the 2H and 3R phases in these materials using the intensity of the four lines observed from 2θ = 45° to 47° [9]. The XRD spectra in Fig. 1 also includes data on sample 14 although the four lines near 2θ = 45° in this sample are not as-well resolved. For making these plots in Fig. 1, the log-scale is used for the X-ray intensities to highlight the weaker four-line pattern observed near 2θ = 45°. Based on the discussion and analysis given in our recent paper on these samples [9], the four lines near 2θ = 45° with increasing 2θ are due to the 2H(100), 3R(101), 2H(101), and 3R(012) Bragg peaks and the intensities (areas under the peaks) of the middle 3R(101) and 2H(101) were used to determine the relative concentrations of the 2H/3R phases in these samples. Since the ratio 2H/3R was found to be near 60/40 for most of the samples in this group, it was inferred that the carbon atoms were nearly equally distributed between the 2H and the 3R phases. Also these samples are best characterized as graphite nanoplates or nanosheets since the thickness of these samples was determined to be around 20 nm with several dozen layers of graphene [9].
Fig. 1.
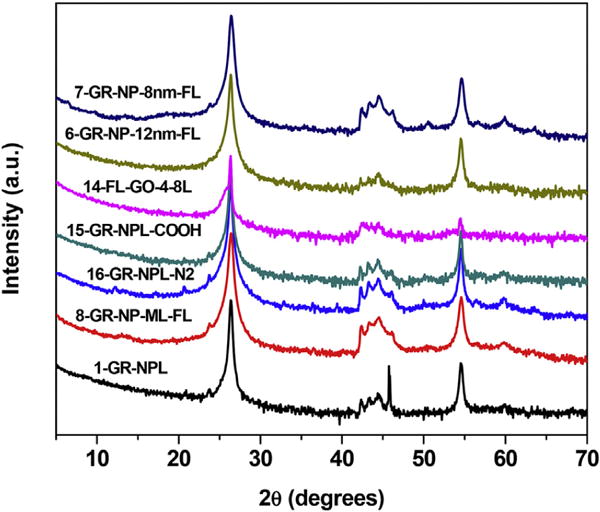
X-ray diffraction patterns of the samples of group A with the spectra shifted vertically for clarity. The first number in the names of the samples is the sample number listed in Table 1. Note that the intensities are plotted on a log scale to highlight the weaker lines. (A colour version of this figure can be viewed online.)
The XRD patterns of the samples of groups B(1), B(2) and C are shown as three separate panels in Fig. 2. The top panel (a) in Fig. 2 shows the XRD patterns of samples # 2, 3 and 12 of Table 1 belonging to group B(1) all of which have the characteristic peak near 2θ ≃ 10° corresponding to d = λ/(2sinθ) ≃ 0.9 nm compared to d = 0.335 nm for graphite. This interlayer spacing is typical of the XRD patterns of graphene oxides (GO), the extra spacing between the layers resulting from the intercalated oxide groups between the layers. The middle panel (b) shows the XRD patterns of samples # 9, 10 and 13 belonging to group B(2) which show broad peaks near 2θ ≃ 24° corresponding to d ≃ 0.37 nm with the combined (100) and (101) peaks also quite evident near 2θ ≃ 44°. These XRD patterns are quite similar to those reported for cokes [12] and some activated carbons [13], analysis of which yielded the structure to be graphite crystallites of about two cell lengths along the c-axis and about 10 cell lengths along the a-axis [13]. The bottom panel (c) in Fig. 2 shows XRD patterns of samples # 4, 5, and 11 which are included in a separate group C because in these samples the broad peak near 2θ ≃ 24° is extremely weak and there is no hint of the observation of peak near 2θ ≃ 44°. Therefore it follows that these carbons lack any meaningful crystalline order and so they are labelled as disordered carbons.
Fig. 2.
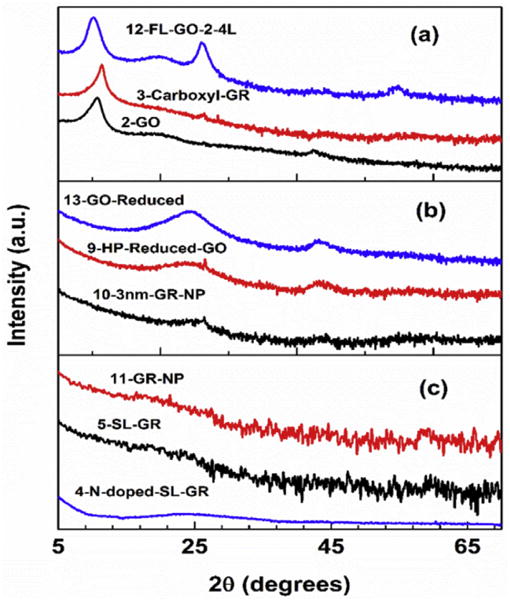
Same as Fig. 1 except that the XRD patterns are for samples of groups B(1), B(2) and C in panels (a), (b) and (c) respectively. (A colour version of this figure can be viewed online.)
For the XRD patterns shown in Fig. 2(b) and (c), it is evident that for the lower 2θ values in most carbons, the scattered intensity of X-ray photons increases sharply with decrease in 2θ. This is a characteristic feature of many materials which lack significant long range crystalline order. In this case, the measurements of the intensity of scattered X-rays covering smaller angles from 2θ = 0.01°–10° is termed small angle X-ray scattering (SAXS) which can provide very useful information about structural aspects of macromolecules between 5 and 25 nm [14, 15]. The quantity for SAXS is the intensity I(q) of the scattered X-rays of wavelength θ as a function of momentum transfer q = 4π·sinθ/λ. Such a plot for three samples viz. #9, 10 and 13 belonging to group B(2) is shown in Fig. 3 covering the data from 2θ = 1°–10° since our experimental facilities did not allow us to take data for angles below 2θ = 1°. Similar measurements were not carried out for samples of group C although qualitatively similar observations should be expected for these samples also.
Fig. 3.
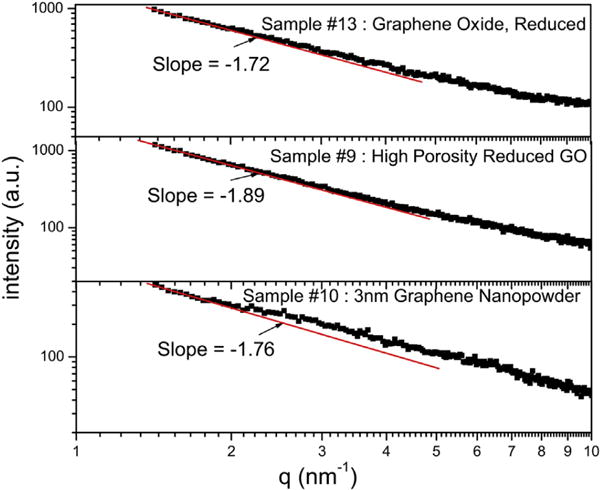
Log- Log plot of the scattered X-ray intensity against q = 4π·sinθ/λ for samples #9, 10 and 13. The data covers the scattering angles 2θ = 1°–10° only. (A colour version of this figure can be viewed online.)
Theoretically, the intensity I(q) ∼ q−α with α = 6−D where D is the dimensionality of pore-boundary surface [15]. In a lignite coal where the data could be measured down to 2θ = 0.01°, α ≃ 3.5 was observed yielding D = 2.5 as the fractal dimensions of the pore-boundary surface [15]. In our samples, α ≃ 1.8 is observed covering only the limited range of 2θ and q in our experiments. Hence additional measurements on these samples covering X-ray scattering at lower angles are needed to accurately determine the magnitude of α in these samples. The relevant point here is that the increase in X-ray intensity with decrease in scattering angle observed here for the carbons is due to the expected SAXS.
3.2. Raman spectra
The Raman spectra of the samples in group A are shown in Fig. 4 with the observed peaks labelled as D, G, D′, 2D and (D + D′) following the observations reported by others [16, 17]. The D-band near 1350 cm−1 and its sister bands D′, 2D and (D + D′) are due to Raman-active defects from the ideal structure of graphite as several earlier papers have elaborated [16, 17]. The narrowness of the graphitic G-band in the samples of Group A likely makes the observation of the D′ band possible in this group of samples. Among these samples, D-band is the weakest in sample 1 of Table 1 for which the D′ and (D + D′) bands are not visible in Fig. 4. For the samples in Group A where D′ band is resolved, the spectra were fitted to three lines (D, G, and D′ bands). The intensities I(D) and I(G) of the D and G bands (ratio given in Table 1) were measured by computing the areas under the peaks.
Fig. 4.
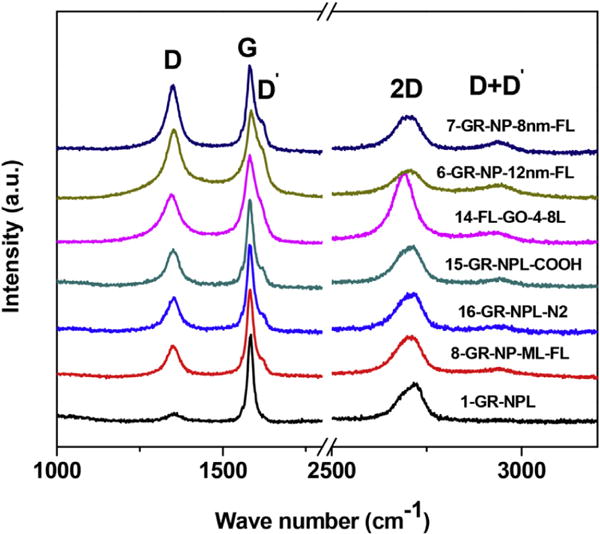
Raman spectra of samples of group A which are shifted vertically for clarity. The observed peaks are labelled as D, G, D′, 2D and D + D′ following the convention in literature. (A colour version of this figure can be viewed online.)
The Raman spectra of the samples in groups B(1), B(2) and C of Table 1 are combined in Fig. 5 as three separate panels similar to the arrangement made for the XRD pattern of Fig. 2 for these samples. In all these samples, the D′ band is not observed and the 2D and (D + D′) bands become considerably broader and weaker as we move down the panels for samples of group B(1) to samples of group B(2) and then to the bottom panel for samples of group C. These samples are easily distinguishable from those is group A in terms of the measured intensity ratio I(D)/I(G) shown in Fig. 6. This ratio is the largest for samples in Group C and intermediate for samples in group B(1) and group B(2).
Fig. 5.
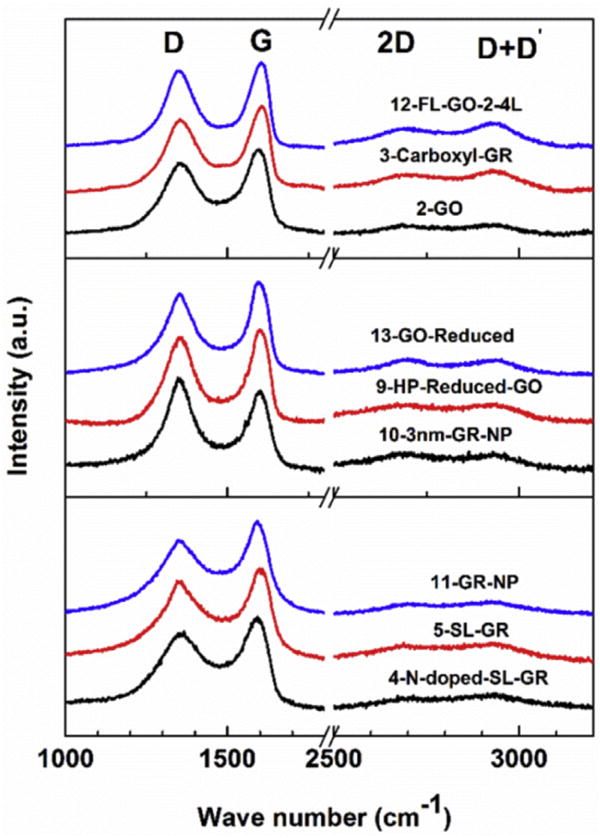
Same as Fig. 4 except that the Raman spectra are for samples of group B(1), group B(2) and group C in the top, middle, and the bottom panels respectively. (A colour version of this figure can be viewed online.)
Fig. 6.
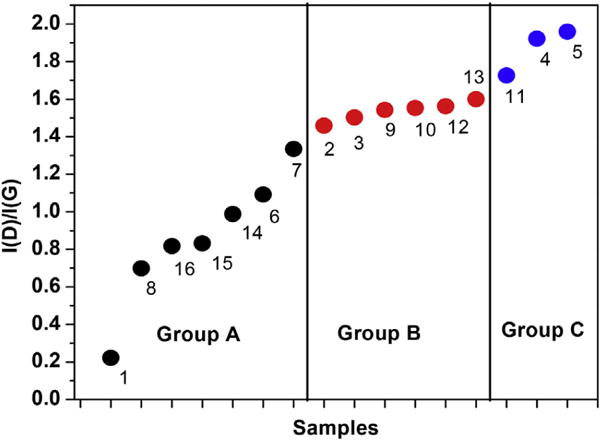
Plot of the intensity ratio I(D)/I(G) of the D and G-bands for all 16 samples with the number next to each data point representing the sample number shown in Table 1. The experimental error bars are within the size of the data points. Group B contains samples of both the B(1) and B(2) groups since I(D)/I(G) ratios in these samples are nearly the same. (A colour version of this figure can be viewed online.)
In determining the ratio I(D)/I(G), the data for samples in Groups B and C were fitted to two lines centered near 1350 cm−1 for the D band and near 1595 cm−1 for the G band with the positions picked by the WiRE 3.4 software as noted in Section 2. For the samples in Group A where the D′ band is resolved, the spectra were fitted to three lines (D, G, and D′ bands). The fitting of the spectra for one representative sample from each group (sample #15 from Group A, sample 10 from Group B, and sample 4 from Group C) are given in Fig. 7. This comparison in Fig. 7 shows the absence of a shoulder in the Raman G bands of the samples of Groups B and C, which might provide a hint of the presence of D′ band in these samples, justifying the procedure used for fitting the spectra in these samples to two lines. The software provides the adjusted R2 value as a measure of the quality of the fit with R2 = 1 meaning perfect fit. The R2 factor ∼0.97 or higher was obtained for fits of the data to Lorentzian lines. It is evident from Fig. 7 that the large widths of the D band in samples of groups B and particularly group C are affecting the position and width of the G band in these samples. It is noted that in rotated double-layer graphene, the intensities of the D, G and 2D bands have been shown to depend on the angle of mis-orientation between the layers [16]. However in these samples with many stacked layers, it is not possible to determine the effects of such mis-orientations if present.
Fig. 7.
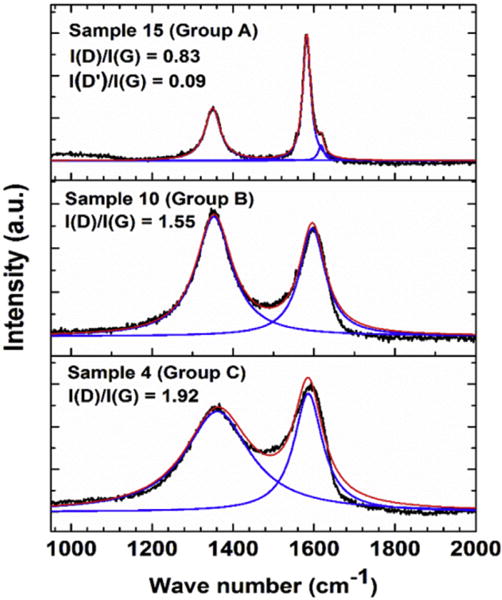
Fits of the Raman spectra for three samples, one each from groups A, B and C. Black lines represent the measured spectra, blue lines the fits to individual peaks and the red lines the overall fits. (A colour version of this figure can be viewed online.)
In recent papers, Cancado et al. [17] and Bruna et al. [18] have related the intensity ratio I(D)/I(G) to the density nD of the Raman active defects through the following relation which for λL = 532 nm used in our experiments leads to:
| (1) |
For the honeycomb lattice of a perfect graphene layer, the number of carbon atoms nC = 3.82 × 1015 cm−2 is calculated. The concentration of Raman-active defects in ppm (parts per million) can then be determined by taking the ratio nD/nC. As an example, I(D)/I(G) = 0.22 for sample 1 leads to nD = 4.80 × 1010 cm−2 and nD/nC = 1.26 ×10−5 = 12.6 ppm. For other samples, I(D)/I(G) is larger and so the density of defects is higher as shown in Fig. 8. The measured ratio of I(D)/I(G) for all 16 samples are plotted in Fig. 6 showing that for samples of Group A, I(D)/I(G) ≤ 1.4 and so nD/nC ≤ 75 ppm approximately.
Fig. 8.
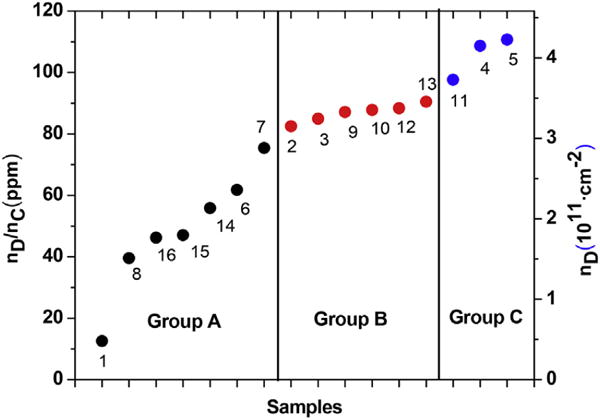
Same as in Fig. 6 except the plots are now for the defect density (right scale) and their concentrations in ppm (left scale) for all the samples. (A colour version of this figure can be viewed online.)
The division of the samples in terms of groups A, B and C is also evident from the widths of the D and G bands. The plots of the widths (full widths at half maximum, FWHM) of the D and G bands against computed nD/nC are shown in Figs. 9 and 10 respectively. The plot for the D band in Fig. 9 shows that D band is relatively narrow (FWHM < 80 cm−1) for samples of group A, intermediate for samples of graph B (FWHM = 100 cm−1 to 150 cm−1) and very broad for samples of group C (180 cm−1 to 210 cm−1). Thus the proposed division of the samples based just on the width of the D band is justified. This division based on the width of the G band is also evident in Fig. 9, although there is some overlap of the data near the boundaries between the three groups. As evident in Fig. 7 for the samples of group B and Group C, the tails of the D band extends to the center of the G band suggesting that the broader D band effectively broadens the G band also and it probably also affects whether D′ band is observed or not.
Fig. 9.
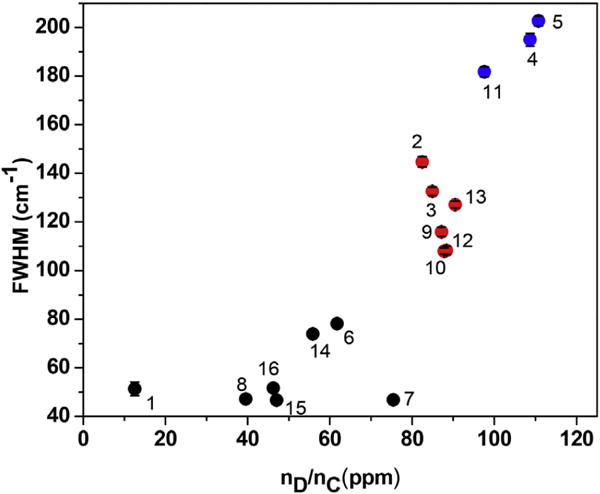
Same as Fig. 6 except the plot is for the full-width at half-maximum (FWHM) of the Raman D band vs. defect concentration in ppm for the 16 samples. The FWHM is the largest for samples of group C (blue), intermediate for group B (red) and the smallest for group A (black). (A colour version of this figure can be viewed online.)
Fig. 10.
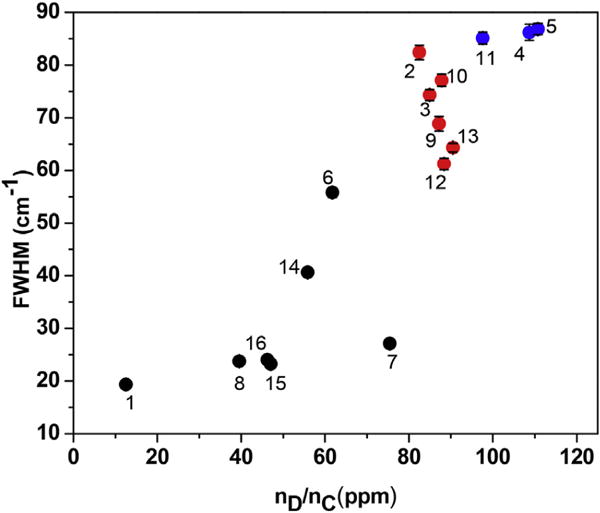
Same as in Fig. 9 except that the plot is for the FWHM of the Raman G band. (A colour version of this figure can be viewed online.)
The width of the D band in sample of Group C (Fig. 9) is considerably higher than those in samples of Group B or Group A. The XRD spectra of samples of group C in Fig. 2 is also distinctly different showing lack of any significant graphitic order. However, unlike in XRD, in the Raman spectra there is no distinct separation between samples of Groups B(1) and B(2) and consequently these samples are now grouped together as Group B in Figs. 6, 8,9 and 10. This represents a notable distinction between the XRD and Raman techniques for characterizing GBM.
The Raman spectra of chars has been analyzed by Li et al. [19], in which there is a considerable overlap between the D and G bands as observed here for samples of Group C. Li et al. [19] argue that in such a case, the D band is really made up of several different groups of organic molecules with centers of their Raman lines varying between 1000 cm−1 and 1500 cm−1. Such an analysis, even if valid for samples of group C, is beyond the scope of the present investigation.
4. Discussion
Based on the distinct features in the XRD patterns, the 16 samples of commercial GBM have been divided into groups labelled here as A, B(1), B(2) and C. The samples of Group A have features of graphitic nanosheets, samples of group B(1) those of GO, samples of group B(2) those of carbons with some degree of order and group C with features of disordered carbons. This division is further corroborated by the parameters of their Raman spectra in that the width of the D band is the smallest, intermediate and largest for samples of group A, B and C respectively. Also the ratio I(D)/I(G) varies systematically from samples in group A to samples of group C, and the D′ band is observed only in samples of group A. The densities of Raman-active defects being proportional to I(D)/I(G) have also been calculated for these samples.
Following up on the earlier studies of Tuinstra and Koening [20], Lespade et al. [21], Wang et al. [22], and Schwan et al. [23], Ferrari and Robertson [24] have discussed the evolution of the Raman spectra in disordered and amorphous carbons in terms of the sp2(graphitic) and sp3(diamondlike) bonds. From graphite to amorphous carbons (a–C), they proposed three stages: Stage 1 from graphite to nanocrystalline graphite; Stage 2 from nano-crystalline graphite to a–C; and Stage 3 from a–C to tetrahedral a–C. In stage 1, the G peak in the Raman spectra moves from near 1580 cm−1 to about 1600 cm−1 whereas in stage 2, the G peak moves from about 1600 cm−1 to about 1500 cm−1 and I(D)/I(G) goes to zero. Using the position of the G peak and the magnitudes of I(D)/I(G), it can be stated that all our samples belong to stage 1 of Ferrari and Robertson [24]. This is because the position of the G peak for samples in group A and group B is near 1584 cm−1 and it is near 1595 cm−1 for samples in group C. In addition, as evident in Fig. 6, I(D)/I(G) systematically increases in going from group A to group C. Therefore the groups A, B(1), B(2), and C proposed here for the commercial GBM may be considered as further subdivisions of the samples in Stage 1 of Ferrari and Robertson [24].
5. Conclusions
By correlating the features observed in the XRD and Raman spectroscopy of 16 commercially obtained samples of GBM, these samples are divided into groups labelled here as groups A, B(1), B(2) and C. Group A contains samples of graphitic nanosheets, group B(1) contains graphene oxides, group B(2) contains carbons with some degree of order and group C contains samples of disordered carbons. The observed features of the samples do not always match with the names given to them by the suppliers. Hence thorough structural characterization of the samples is warranted before their use in fundamental studies and applications. Finally, the Raman spectra of the samples of group B(1) containing GO and group B(2) containing carbons with some structural order are not as clearly distinguishable as their XRD patterns indicating differences in the sensitivity of the two techniques for such characterization.
Acknowledgments
The research at NIOSH/CDC was funded by the U.S. National Toxicology Program under Inter-Agency Agreement #11-NS11-04-M01. The research at West Virginia University was supported in part under contract #212-2013-M-54915 from NIOSH/CDC. We acknowledge use of the WVU Shared Research Facilities. The findings and conclusions in this report are those of the authors and do not necessarily represent the views of the National Institute for Occupational Safety and Health. Mention of any company or product does not constitute endorsement by NIOSH or West Virginia University.
References
- 1.Novoselov KS, Geim AK, Morozov SV, Jiang D, Zhang Y, Dubonox SV, et al. Electric field effect in atomically thin carbon films. Science. 2004;306:666–669. doi: 10.1126/science.1102896. [DOI] [PubMed] [Google Scholar]
- 2.Huang X, et al. Graphene-based materials: synthesis, characterization, properties and applications. Small. 2012;7:1876–1902. doi: 10.1002/smll.201002009. [DOI] [PubMed] [Google Scholar]
- 3.Craciun MF, Khrapach I, Barnes MD, Russo S. Properties and applications of chemically functionalized graphene. J Phys Condens Matter. 2013;25:423220, 22. doi: 10.1088/0953-8984/25/42/423201. [DOI] [PubMed] [Google Scholar]
- 4.Ray S. Applications of Graphene and Graphene Oxide Based Nanomaterials. William Andrew Publisher; 2015. [Google Scholar]
- 5.Wolf EL. Graphene: a New Paradigm in Condensed Matter and Device Physics. Oxford University Press; 2013. [Google Scholar]
- 6.Sanchez VC, Jachak A, Hurt RH, Kane AB. Biological interactions of graphene — family nanomaterials: an interdisciplinary review. Chem Res Toxicol. 2012;25:15–34. doi: 10.1021/tx200339h. [DOI] [PMC free article] [PubMed] [Google Scholar]
- 7.Xu C, Wang J, Xu Y, Shang G, Wang R, Lin Y. Review of and perspective on the toxicology of graphene-based materials. Curr Drug Metab. 2013;14:863–871. doi: 10.2174/138920021131400108. [DOI] [PubMed] [Google Scholar]
- 8.Roberts JR, Mercer RR, Stefaniak AB, Seehra MS, Geddam UK, Chaudhuri IS, Kyrlidis A, Sager T, Kenyon A, Bilgesu SA, Eye T, Scabilloni JF, Leonard SS, Fix NR, Schwegler-Berry D, Farris BY, Wolfarth MG, Porter DW, Castranova V, Erdely A. Evaluation of pulmonary and systemic toxicity following lung exposure to graphite nanoplates: a member of the Graphene-based nanomaterial family. Part Fibre Toxicol. 2016;13:34, 22. doi: 10.1186/s12989-016-0145-5. [DOI] [PMC free article] [PubMed] [Google Scholar]
- 9.Seehra MS, Geddam UK, Schwegler-Berry D, Stefaniak AB. Detection and quantification of 2H and 3R phases in commercial graphene-based materials. Carbon. 2015;95:818–823. doi: 10.1016/j.carbon.2015.08.109. [DOI] [PMC free article] [PubMed] [Google Scholar]
- 10.Morpurgo MF, Russo S, Yamamoto M, Oostinga JB, Morpurgo AF, Tarucha S. Trilayer graphene is a semimetal with a gate-tunable band overlap. Nat Nanotechnol. 2009;4:383–388. doi: 10.1038/nnano.2009.89. [DOI] [PubMed] [Google Scholar]
- 11.Khodkov T, Khrapach I, Cracium MF, Russo S. Direct observation of a gate tunable bandgap in electrical transport in ABC-trilayer graphene. Nano Lett. 2015;15:4429–4433. doi: 10.1021/acs.nanolett.5b00772. [DOI] [PubMed] [Google Scholar]
- 12.Seehra MS, Pavlovic AS. X-ray diffraction, thermal expansion, electrical conductivity, and optical microscopy studies of coal-based graphites. Carbon. 1993;31:557–564. [Google Scholar]
- 13.Manivannan A, Chirila M, Giles NC, Seehra MS. Microstructure, dangling bonds and impurities in activated carbons. Carbon. 1999;37:1741–1747. [Google Scholar]
- 14.Zhou W, Islam MF, Wang H, Ho DL, Yodh AG, Winey KI, Fischer JE. Small angle neutron scattering from single-wall carbon nanotube suspensions: evidence for isolated rigid rods and rod networks. Chem Phys Lett. 2004;384:185–189. [Google Scholar]
- 15.Bale HD, Schmidt PW. Small-angle X-ray-scattering investigations of sub-microscopic porosity with fractal properties. Phys Rev Lett. 1984;53:596–599. [Google Scholar]
- 16.Kim K, Coh S, Tan LZ, Regan W, Yuk JM, Chatterjee E, et al. Raman spectroscopy study of rotated double layer graphene: mis-orientation-angle dependence of electronic structure. Phys Rev Lett. 2012;108:246103, 6. doi: 10.1103/PhysRevLett.108.246103. [DOI] [PubMed] [Google Scholar]
- 17.Cancado LG, Jorio A, Martins Ferreira EH, Stavale F, Achete CA, Capaz RB, et al. Quantifying defects in graphene via Raman spectroscopy at different excitation energies. Nano Lett. 2011;11:3190–3196. doi: 10.1021/nl201432g. [DOI] [PubMed] [Google Scholar]
- 18.Bruna M, Ott AK, Ijas M, Yoon D, Sassi U, Ferrari AC. Doping dependence of the Raman spectrum of defected graphene. ACS Nano. 2014;8:7432–7441. doi: 10.1021/nn502676g. [DOI] [PubMed] [Google Scholar]
- 19.Li X, Hayashi J, Li A. FT-Raman spectroscopic study of the evolution of char structure during the pyrolysis of a Victorian brown coal. Fuel. 2006;85:1700–1707. [Google Scholar]
- 20.Tuinstra F, Koenig J. Raman spectra of graphite. J Chem Phys. 1970;53:1126–1130. [Google Scholar]
- 21.Lespade P, Al-Jishi R, Dresselhaus MS. Model for Raman scattering from incompletely graphitized carbons. Carbon. 1982;20:427–431. [Google Scholar]
- 22.Wang Y, Alsmeyer DC, McCreery RL. Raman spectroscopy of carbon materials: structural basis of observed spectra. Chem Mater. 1990;2:557–563. [Google Scholar]
- 23.Schwan J, Ulrich S, Batori V, Erhradt H, Silva SRP. Raman spectroscopy on amorphous carbon films. J Appl Phys. 1996;80:440–447. [Google Scholar]
- 24.Ferrari AC, Robertson J. Interpretation of Raman spectra of disordered and amorphous carbon. Phys Rev B. 2000;61:14095–14106. [Google Scholar]


