Abstract
Osteoarthritis (OA) of temporomandibular joints (TMJ) occurs in about 40% of the patients who present TMJ disorders. Despite its prevalence, OA diagnosis and treatment remain controversial since there are no clear symptoms of the disease, especially in early stages. Quantitative tools based on 3D imaging of the TMJ condyle have the potential to help characterize TMJ OA changes. The goals of the tools proposed in this study are to ultimately develop robust imaging markers for diagnosis and assessment of treatment efficacy. This work proposes to identify differences among asymptomatic controls and different clinical phenotypes of TMJ OA by means of Statistical Shape Modeling (SSM), obtained via clinical expert consensus. From three different grouping schemes (with 3, 5 and 7 groups), our best results reveal that that the majority (74.5%) of the classifications occur in agreement with the groups assigned by consensus between our clinical experts. Our findings suggest the existence of different disease-based phenotypic morphologies in TMJ OA. Our preliminary findings with statistical shape modeling based biomarkers may provide a quantitative staging of the disease. The methodology used in this study is included in an open source image analysis toolbox, to ensure reproducibility and appropriate distribution and dissemination of the solution proposed.
Keywords: Temporomandibular joint, Osteoarthritis, Statistical Shape Model, Classification, Computer Assisted Diagnosis
1. Introduction
Osteoarthritis (OA), the most prevalent arthritis worldwide, is associated with significant pain and disability and affects 13.9% of adults at any given time1; of those patients 42% manifest OA in their temporomandibular joints (TMJ). The complex pathogenesis of TMJ OA remains unclear to this day, and its course challenges experts given the different morphological patterns of bone resorption and formation observed in its various stages2. The disease may evolve into repair and morphological adaptation, but also into aggressive bone destruction and functional impairment (see figure 1 left).
Figure 1.
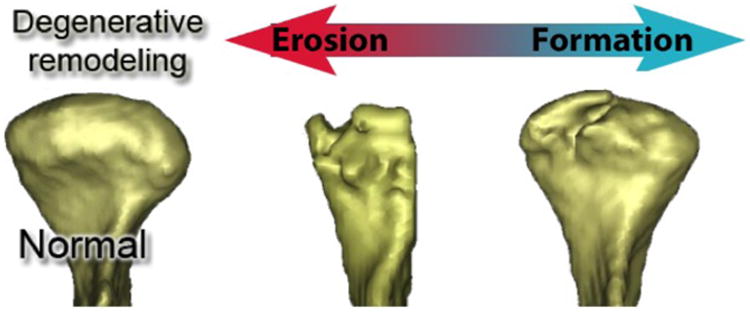
Different stages of bone resorption during TMJ OA.
Numerous imaging modalities are currently available for researchers and clinicians such as computed tomography (CT), cone beam CT (CBCT), MRI, intra-oral scanner and soft tissue 3D photography 3 and have the potential to improve dental diagnosis and evaluation of treatment outcomes 4. Specifically, CBCT has become widely used due to the low radiation dose necessary to get good quality images (as compared with other imaging techniques).
Even with advances in technology, current radiologic classification of TMJ pathology5 are subject to errors. These classification scores are affected by the acquisition procedures such as oblique cuts of the CT and head positioning errors, which can incorrectly diagnose flattening of the head of the condyle, formation of osteophytes, subchondral cysts, or condylar pitting when viewed on multiplanar 2D sections.
The wider availability of CBCT should provide researchers and clinicians complex information such as 3D surface models for comprehensive evaluation of the overall joint morphological alterations.
We believe that quantitative tools based on 3D models could aid detecting disease progression and disease staging. These tools would help to characterize TMJ OA and to enable the development of effective treatments. More importantly, these tools should be developed as open-source free-software to enable any researcher to realize their own characterization of the disease and increase the scientific knowledge about it.
The purpose of this study is to investigate novel imaging statistical methodology to classify 3D osteoarthritic morphological variations using 3D models, as well as to develop freely available software to disseminate that methodology. Specifically, this study proposed to identify differences among the asymptomatic controls and different clinical phenotypes of TMJ OA by means of Statistical Shape Modeling (SSM).
2. Materials
The study recruited 91 patients. Healthy patients were obtained retrospectively from other datasets, after confirming absence of symptoms and that radiographic condylar pathology was not present. TMJ OA patients underwent a clinical exam by an orofacial pain specialist and CBCT was obtained following clinical and radiographic diagnosis of TMJ osteoarthritis.
CBCT protocol consisted of a 20-second scan taken on all participants (i-CAT Next Generation, 120 kV, 18.66 mA, Imaging Sciences, Hatfield, PA) and a large field of view to include both TMJs. The study was approved by the University of Michigan institutional review board (IRB).
3. Methods
3.1 Diagnostic Index Methodology
Segmentation for all TMJs obtained from CBCT scans were performed semi-automatically using 3DSlicer6,7 and the user interactive ITK-SNAP software8. 3D surface models of the right and left mandibular condyles were constructed using 3DSlicer, and the left condyles were mirrored into the right using a random sagittal plane. 3D surface models were registered to the same reference space using a previously validated method9.
The UNC SPHARM-PDM shape analysis toolbox10 was employed to provide a unique and symmetric point correspondence across all measured surfaces. The correspondence was computed via mapping every point on the condylar 3D surface model to a unique position on the unit sphere11 followed by generating a uniformly triangulated surface based on this spherical mapping (SPHARM-PDM)12. The segmented 3D surface models of the condyles are first converted into surface meshes, and a spherical parameterization is computed for the surface meshes using area-preserving and distortion-minimizing spherical mapping. The SPHARM description is computed from the mesh and its spherical parameterization. Using the 1st-order ellipsoid from the spherical harmonic coefficients, the spherical parameterizations are aligned to establish correspondence across all surfaces. The SPHARM description is then sampled into triangulated surfaces (SPHARM-PDM) with the same number of points (1002 points per surface). All correspondent point distribution models were quality controlled to ensure all correspondent points represent the same anatomical areas in the population.
After quality control, the cohort consisted of 218 TMJs (153 TMJ OA, 65 Controls) obtained from CBCT images. 3D surface models of the TMJs were generated and TMJ OA joints were subdivided, by consensus between 3 clinicians, into 7 subgroups (see figure 2) based on morphological variability compared to the average control morphology. Preliminary experiments with 7 classification subgroups included a group with condylar overgrowth, a group with condylar morphology close to normal and 5 degrees of condylar degeneration13.
Figure 2.
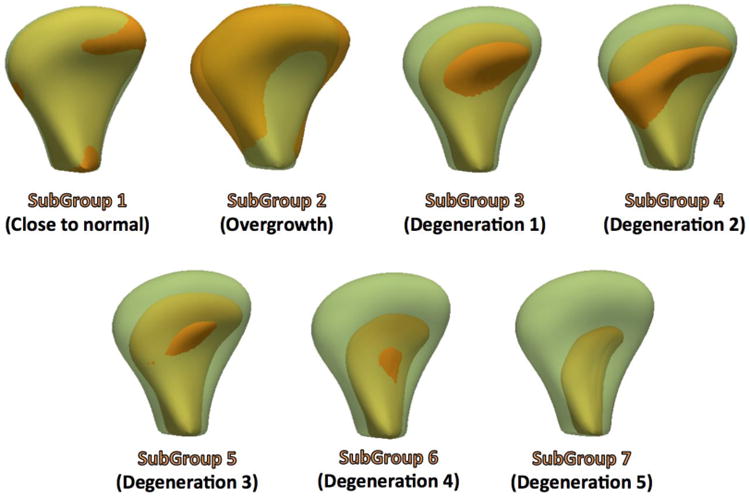
Average of each one of the TMJ OA seven clinical sub-groups (solid orange) in comparison with the average healthy morphology (semitransparent green).
For the 5 subgroups experiments, the group with overgrowth was removed as overgrowth is a diverse clinical condition and 2 of the groups with similar phenotypes and small number of samples were merged for analysis. For the 3 subgroups experiments, 3D morphological variability in the OA sample was classified as mild, moderate and severe OA compared to the average control morphology. (see fig. 3)
Figure 3.
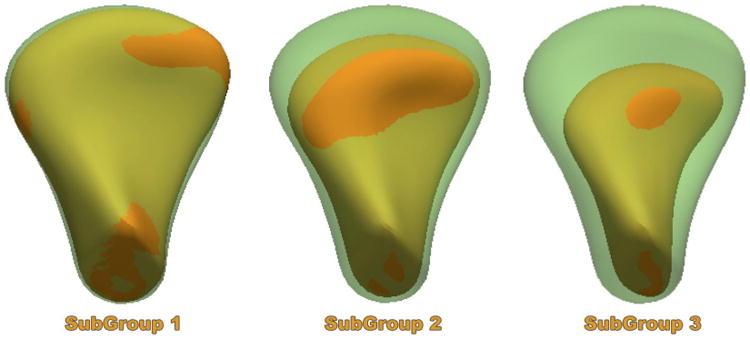
Average of each one of the TMJ OA three clinical sub-groups (solid orange) in comparison with the average healthy morphology (semitransparent green). SubGroup 1 average morphology shows mild arthritic bone changes indicative of incipient resorption of the lateral pole and bone apposition in the anterior surface of the condyle. SubGroup 2 average morphology shows moderate arthritic bone changes indicative of resorption of the articular surface and further bone apposition in the anterior surface of the condyle. SubGroup 3 average morphology shows severe arthritic bone changes indicative of marked resorption of the articular surface and still bony projection of the anterior surface of the condyle.
Then, using a leave-one out approach, each ck TMJ OA case was first projected into each one of the shape spaces defined by each SSM n=4,7,8, and shape loads αk for each ck, were computed via (1). holds the i eigenvectors ν⃗i scaled by the variance λi and c̄n is the mean for the n-th SSM.
| (1) |
For each one of the cases we compute a Mean Root Square Error (MRSE), which provides a weighted distance from the ck to the mean of a certain SSM. The case ck will be classified to the group to which this MRSE distance is the smallest (2).
| (2) |
3.2 Diagnostic Index Software
The emergence of open source libraries and tools in the last decade has changed the process of academic software development and continues to contribute to the free exchange of information and methods. Recently, increasing resource sharing and thus reproducibility is one of the most important initiatives of the National Institutes of Health.14
All these open access or open source developments have contributed significantly to level the medical image analysis field. Small research labs now have the unprecedented ability to generate considerable contributions to the field based on tools such as 3DSlicer. We decided to develop and disseminate our Diagnostic Index using 3DSlicer as dissemination mechanism.
The tool architecture uses Python, C++ code and Statismo and VTK C++ libraries (see figure 4. Statismo15, a C++ open source framework for SSM building, was used to generate the SSM for each one of the TMJ OA subgroups as well as the healthy group. Statismo is distributed with an open-source, free-software license, facilitates the development of an end-product to disseminate, which is part of the focus of our work. All the source code is freely available via Github16.
Figure 4.
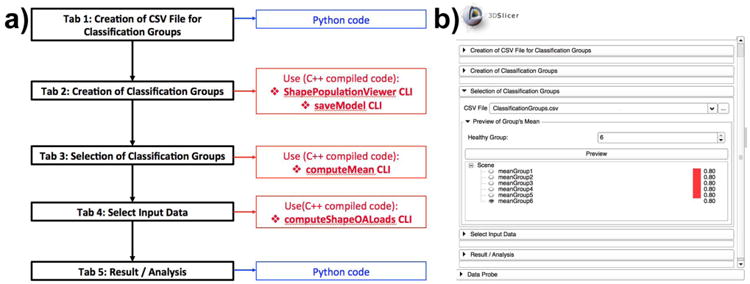
a) Architecture of the DiagnosticIndex 3DSlicer Extension. Functional unit flow displayed in black. Scripted code is displayed in blue whereas compiled code is displayed in red. b) DiagnosticIndex 3DSlicer Extension Graphic User Interface (GUI), displaying all the functional units in the architectural diagram.
4. Results
In order to validate our module, we computed the value of the diagnostic index for each one of our 209 samples. Figure 5 displays the misclassification results obtained by our Diagnostic Index module in our sample TMJ cohort.
Figure 5.
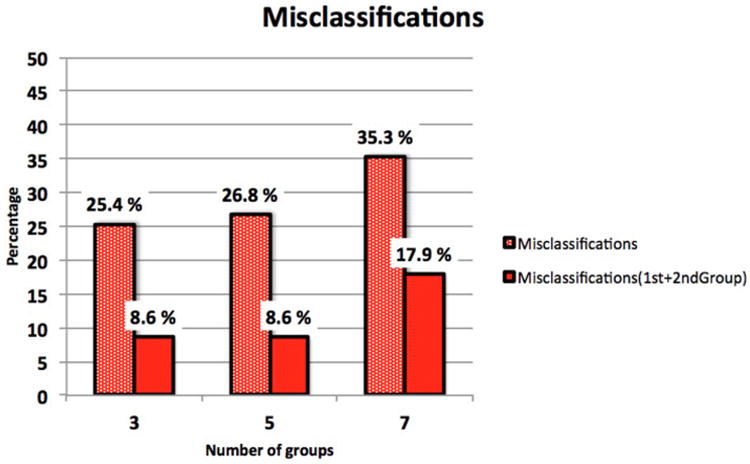
Percentage of statistical shape analysis misclassifications when the TMJ OA condyles were classified into 3, 5, or 7 OA subgroups, plus the healthy condyles subgroup. The dotted red bars show the percentages of misclassification when the condylar morphology is classified to the group to which this MRSE distance is the smallest. The solid red bars show the percentages of misclassification to the 2 groups to which this MRSE distances are the smallest.
When we look at the classification results for the 3 subgroups plus the control group that obtained the best classification results, represented via confusion matrix (table 1), we see that the majority (74.5%) of the classifications occur in agreement with the group assigned by consensus between our clinical experts (agreement classifications located in the matrix diagonal).
Table 1.
Confusion matrix with the classification results for 3 TMJ OA subgroups + healthy when the condylar morphology is classified to the group to which this MRSE distance is the smallest.
| Real | Assigned | G1 | G2 | G3 | HC |
|---|---|---|---|---|---|
| G1 | 6 | 14 | 5 | 7 | |
| G2 | 0 | 41 | 11 | 1 | |
| G3 | 0 | 2 | 57 | 0 | |
| HC | 1 | 9 | 3 | 52 | |
Looking at these results it is clear that there are groups that encode a much higher 3D shape variability than others particularly at early stages of the disease such as in Group 1. In our experiments, Group 1 has an 81% of samples misclassified and contributes to the total misclassification rate in a 49%. Most of the misclassified condyles of group 1 get classified as group 2, indicating overlap between groups 1 and 2. Several condyles, despite their visual similarity with the average of the clinically assigned group, have a higher number of correspondent points fitting another clinically determined group, as illustrated in Figure 6 Figure 6 shows that the head of the condyle and length fit agree with the clinical classification group (group 1), but there are multiple areas of disparity such as the width that fit more accurately the automatically classified group (Group 2).
Figure 6.
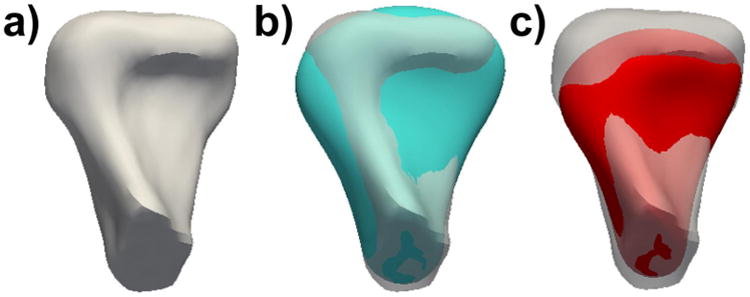
a) Example case morphology. b) Goodness of fit for the clinically assigned group, as displayed in the blue average of group 1. C) Goodness with the automatically assigned average group 2.
5. Discussion
The findings presented in this work reveal that designing imaging biomarkers of TMJ OA need to contemplate the presence of different phenotypic morphology, which was an aspect that our team had investigated before17. Our other preliminary studies concentrated in the design of classification methods18 and were not able to consistently separate among different groups. Thus, this study concentrated on designing a method that can be configured to different groupings easily.
In this paper we presented our findings using different groups obtained via clinical expert consensus. It revealed statistical shape modeling based biomarkers of the condylar morphology that can provide a quantitative staging of the disease. More importantly, the methods used in this study are disseminated and included in an open source image analysis toolbox. Commercial software packages produce adequate surface reconstructions and/or offer landmark, surface and/or voxel-based registration methods, but they are not open source, cannot be modified, do not interact well with each other and do not provide flexibility for customization. Due to its open licensing, 3D Slicer represents the perfect disseminating vehicle for our DiagnosticIndex extension.
Future steps to improve the current classification results contemplate other automatic clustering groups, such as deep learning. To improve the DiagnosticIndex also presented in this module, we are looking into having a way to fine-tune the clinically assigned groups via automatic classification that can be a new option for the module.
References
- 1.CDC - Arthritis - Data and Statistics. 2014 Aug 27; http://www.cdc.gov/arthritis/data_statistics.htm.
- 2.Samuels J, Krasnokutsky S, Abramson SB. Osteoarthritis: a tale of three tissues. Bull NYU Hosp Jt Dis. 2008;66(3):244–250. [PubMed] [Google Scholar]
- 3.3dMD. 3DMD. 2015 Jan 23; http://www.3dmd.com/
- 4.White SC, Pharoah MJ. The evolution and application of dental maxillofacial imaging modalities. Dent Clin North Am. 2008;52(4):689–705. doi: 10.1016/j.cden.2008.05.006. [DOI] [PubMed] [Google Scholar]
- 5.Ahmad M, Hollender L, Anderson Q, Kartha K, Ohrbach R, Truelove EL, John MT, Schiffman EL. Oral Surg Oral Med Oral Pathol Oral Radiol Endod. 6. Vol. 107. Mosby, Inc; 2009. Research diagnostic criteria for temporomandibular disorders (RDC/TMD): development of image analysis criteria and examiner reliability for image analysis; pp. 844–860. [DOI] [PMC free article] [PubMed] [Google Scholar]
- 6.Budin F, Paniagua B. Intensity Segmenter [Google Scholar]
- 7.3DSlicer. www.slicer.org.
- 8.Yushkevich PA, Piven J, Hazlett HC, Smith RG, Ho S, Gee JC, Gerig G. User-guided 3D active contour segmentation of anatomical structures: significantly improved efficiency and reliability. Neuroimage. 2006;31(3):1116–1128. doi: 10.1016/j.neuroimage.2006.01.015. [DOI] [PubMed] [Google Scholar]
- 9.Schilling J, Gomes LCR, Benavides E, Nguyen T, Paniagua B, Styner M, Boen V, Gonçalves JR, Cevidanes LHS. Regional 3D superimposition to assess temporomandibular joint condylar morphology. Dentomaxillofac Radiol. 2014;43(1):20130273. doi: 10.1259/dmfr.20130273. [DOI] [PMC free article] [PubMed] [Google Scholar]
- 10.Styner M, Oguz I, Xu S, Brechbühler C, Pantazis D, Levitt JJ, Shenton ME, Gerig G. Framework for the Statistical Shape Analysis of Brain Structures using SPHARM-PDM. Insight J. 2006;(1071):242–250. [PMC free article] [PubMed] [Google Scholar]
- 11.Brechbühler C, Gerig G, Kübler O. Comput Vis Image Underst. 2. Vol. 61. Elsevier Science Inc; 1995. Parametrization of Closed Surfaces for 3-D Shape Description; pp. 154–170. [Google Scholar]
- 12.Gerig G, Styner M, Jones D, Weinberger D, Lieberman J. Proc IEEE Work Math Methods Biomed Image Anal (MMBIA 2001) IEEE Comput Soc; 2001. Shape analysis of brain ventricles using SPHARM; pp. 171–178. [Google Scholar]
- 13.Paniagua B, Ruellas A, Marilia Y, Liliane G, Martin S, Steve P, Cevidanes LH. Staging of Temporomandibular Joint Osteoarthritis using Statistical Shape Modeling. Proc Shape Symp. 2015 [Google Scholar]
- 14.Baker M. 1,500 scientists lift the lid on reproducibility. Nature. 2016;533(7604) doi: 10.1038/533452a. [DOI] [PubMed] [Google Scholar]
- 15.Albrecht T, Gass T, Goksel O, Marcel L, Kistler M, Bousleiman H, Reyes M, Philippe B, Cattin PC, et al. Statismo - A framework for PCA based statistical models. 2012:1–18. [Google Scholar]
- 16.DiagnosticIndexExtension Github. 2016 Jul 15; https://github.com/DCBIA-OrthoLab/DiagnosticIndexExtension.
- 17.Cevidanes LHS, Gomes LR, Jung BT, Gomes MR, Ruellas ACO, Goncalves JR, Schilling J, Styner M, Nguyen T, et al. 3D superimposition and understanding temporomandibular joint arthritis. Orthod Craniofac Res. 2015;18 Suppl 1:18–28. doi: 10.1111/ocr.12070. [DOI] [PMC free article] [PubMed] [Google Scholar]
- 18.Gomes L, Gomes M, Jung B, Paniagua B, Ruellas AC, Goncalves JR, Styner M, Cevidanes LH. Diagnostic index of 3D osteoarthritic changes in temporomandibular joint condylar morphology. Accept To SPIE Med Imaging. 2015 doi: 10.1117/1.JMI.2.3.034501. [DOI] [PMC free article] [PubMed] [Google Scholar]


