

Abstract
Introduction
Muscle weakness is an important indicator of disability, chronic disease, and early mortality. Grip strength is a simple, cost-effective measure of overall muscle strength. The Foundation of the National Institutes of Health (FNIH) recently proposed sex-specific grip strength cut points for clinical muscle weakness. However, these criteria were established using non–nationally representative data. This study used nationally representative data on Americans aged ≥65 years to identify race- and sex-specific cut points for clinical muscle weakness and quantify prevalence among older blacks and whites by sex.
Methods
Classification and Regression Tree models were used to identify cut points based on individual-level grip strength associated with slow gait speed (<0.8 m/second) among 7,688 individuals (57% female; 8% black; mean age, 74.6 [SD=6.79] years) from the 2010/2012 Health and Retirement Study during January–April 2016. Identified cut points were then used to quantify the prevalence of weakness by race/sex subgroup.
Results
Fifty-five percent of men (max grip strength <39 kg) and 47% of women (<22 kg) were classified as weak. Higher cut points were identified for black men (<40 kg) and women (<31 kg), and the prevalence of weakness (57% and 88%, respectively), was higher compared with whites. Fifty-five percent of individuals had slow gait speed (<0.8 m/s).
Conclusions
Prevalence of weakness was substantially higher than previous reports, underscoring the importance of using population-level data to identify individuals at greatest risk for adverse health outcomes. This is the first study to establish cut points for muscle weakness in a nationally representative sample by race and sex.
Introduction
Muscle weakness is a primary determinant of age-related loss of function,1,2 and is associated with mobility disability,3–5 cardiovascular disease,6 and mortality.7 Hand grip strength has been shown to be a reliable and inexpensive surrogate of overall muscle strength8,9 and is a robust prognostic indicator of dynapenia, subsequent functional limitations,3,5 and future disease status.6 Leong et al.6 found grip strength to be a stronger predictor of all-cause and cardiovascular mortality than systolic blood pressure.
The current recommendations used to classify older adults as clinically weak were derived from grip strength cut points developed by the Foundation of the National Institutes of Health (FNIH) (25.99 kg for men and 15.92 kg for women).10,11 However, these cut points were derived from non–nationally representative, pooled data across eight observational and six clinical trial studies that do not reflect the growing racial and ethnic diversity in the U.S. population.11 The primary objectives of the current study were to establish race- and sex-specific cut points of grip strength from a nationally representative, racially-diverse sample of Americans aged ≥65 years that can be used to screen large populations for clinical muscle weakness and to estimate the race- and sex-specific prevalence of muscle weakness.
Methods
Study Sample
Data were from the Health and Retirement Study (HRS), a nationally representative, multistage area probability survey of non-institutionalized, community-dwelling Americans aged ≥51 years. Study details have been described previously.12 HRS is the longest running longitudinal study of older Americans in the U.S., with consistent response rates of approximately 85%.12 Sampled individuals have been re-interviewed biannually since 1992. New cohorts have been added to the original sample to maintain the nationally representative nature of the survey over time.12
Starting in 2006, a random one-half sample of HRS participants was selected for an enhanced face-to-face interview that included physical measurements (gait speed for those aged ≥65 years and hand grip strength), and the other random one-half completed the same interview in 2008.13 Proxy interviews and nursing home residents were ineligible to participate.
The latest cross-sectional waves of HRS data (2010/2012) were used to identify cut points for clinical muscle weakness, herein referred to as clinical weakness, in the most recent cohorts of older Americans. The analytic sample comprised adults aged ≥65 years in 2010 (n=4,898) and 2012 (n=4,652), creating one cross-sectional data set (N=9,550). Excluding proxy interviews and nursing home residents (n=1,475), as well as those self-reporting as “other” race (n=387), resulted in a final analytic sample of 7,688 individuals.
The HRS was approved by the Behavioral Sciences Committee IRB at the University of Michigan. The data used in this analysis are publically available and contain no unique identifiers, thereby ensuring respondent anonymity.
Measures
Hand grip strength was assessed using a Smedley spring-type hand dynamometer (Scandidact, Denmark). Participants were instructed to squeeze the device with the dominant hand as hard as they could and then let go. Grip strength assessments were administered while participants were standing with their arm at their side, with the elbow flexed at a 90-degree angle.13 After one practice trial, two measurements were taken with each hand, alternating hands. The maximum measurement from the four trials was used for the analysis.
Following existing work,1,10,11 slow gait speed was used as the primary outcome for calibrating grip strength cut points for clinical weakness. Gait speed was assessed using a timed walking test administered by trained raters in participants' homes.13 A space of approximately 12 feet in length was needed to set up the walking course. Study participants were timed while walking at their “normal pace” along an 8-foot course. Participants were permitted to use a walking aid if they normally used one to walk. The interviewer stopped the time as soon as the participant's first foot was completely past the tape marking the finish line and flat on the floor. Two trials were administered and the average of the two times was used to create a measure of usual gait speed (m/second). A binary indicator of slow gait speed was created based on a walking speed <0.8 m/second, which is highly predictive of incident disability14 and mortality15 in both blacks and whites.15 Additionally, slow walking speed at <0.6 m/second was also considered because previous work has also found a strong relationship between this gait speed threshold and mortality among community dwelling adults.15
Missing data for gait speed (n=832), for those with recent surgeries, injuries, or other health conditions (n=125), feeling unsafe (n=222), or not having suitable space for the test (n=283)) were imputed using the multiple imputation methods in SAS, version 9.3 (PROC MI) with SE corrections performed using PROC MIANALYZE.
All relevant covariates that FNIH used were included in the models in order to replicate their study as closely as possible,11 including age, sex, self-reported race/ethnicity, number of chronic conditions (a three-level summary score based on having less than, at least one, or more than one self-reported medically diagnosed chronic health condition [based on eight self-reported medically diagnosed chronic health conditions, including: high blood pressure, diabetes, cancer, lung disease, heart disease, stroke, psychiatric problems and arthritis], and BMI (weight in kg/[height in m]2).
Diagnostic properties of the grip strength cut points were assessed by quantifying the sensitivity and specificity of weakness corresponding to two clinically important outcomes: slow gait speed and difficulty with activities of daily living (ADLs).16,17 ADL disability was assessed using self-reported difficulty with six self-care ADLs (eating, bathing, dressing, transferring, toileting, and walking across a room).18 For each activity, difficulty was recorded as present (i.e., difficulty with activity or cannot do at all) or absent (no difficulty). A dichotomous variable was created to identify participants that reported difficulty with one or more activities versus none.
Statistical Analysis
Analyses were conducted from January to April 2016. Classification and Regression Tree (CART) models were used to identify grip strength cut points for clinical weakness that were associated with slow gait speed (<0.8 m/second). Secondary models were also run using a more conservative cut point of slow walking speed at 0.6 m/second. Sex-stratified models were first run for men and women. CART models recursively partition data to identify those predictors with the strongest relationship with the outcome based on the criterion of minimum prediction error.19,20 Candidate predictors entered into the model included: (1) maximum grip strength; (2) number of chronic conditions; (3) age; and (4) BMI. Individual models were run for each sex–race group. To avoid over-fitting, cross-validation was employed for each of the sex- and race-specific trees by randomly partitioning the data into ten mutually exclusive data sets. Each fully grown tree was then applied to each of the subsamples where the error variance was obtained. All trees were then pruned based on established recommendations21 to yield a final set of sex-and race-specific grip strength cut points.
All statistical analyses were conducted using SAS, version 9.3 and R, version 3.1.2 using the rpart package.19 Differences between groups who were weak versus non-weak were assessed using t-tests for continuous variables and chi-square tests for categorical variables. Descriptive analyses were weighted using HRS sampling weights and statistical significance was assessed with a two-tailed α of 0.05.
Results
The age, sex, and race breakdown of the sample is consistent with that of Americans aged ≥65 years based on 2012 U.S. Census data.18 Table 1 presents the weighted sociodemographic characteristics for all study participants. Fifty-seven percent were women, 91% were white, and the mean age was 75.2 years (range, 65–100 years).
Table 1. Demographic Characteristics of Study Sample by Race and Sex: Health and Retirement Study age 65+, 2010/2012 (N=7,688).
| Variables | Whites (n=6,628) | Blacks (n=1,058) | ||
|---|---|---|---|---|
|
| ||||
| Men (n=2,799) Mean (SD) | Women (n=3,829) Mean (SD) | Men (n=383) Mean (SD) | Women (n=675) Mean (SD) | |
| Age (y) | 75.5 (6.7) | 75.4 (7.0) | 73.6 (5.8) | 73.9 (6.2) |
| Maximum grip strength (kg) | 37.8 (8.7) | 22.1 (5.7) | 37.2 (8.7) | 24.5 (5.8) |
| Gait speed (meters/second) | 0.83 (0.25) | 0.75 (0.25) | 0.67 (0.21) | 0.59 (0.21) |
| Na (%)b | N (%) | N (%) | N (%) | |
| Slow walking speed | ||||
| Slow walkers (<0.8 m/s) | 1,297 (44.0) | 2,249 (58.7) | 287 (74.9) | 582 (87.3) |
| Normal walkers (≥0.8 m/s) | 1,502 (56.0) | 1,580 (41.4) | 96 (25.1) | 93 (12.7) |
| BMI | ||||
| Underweight (<18.5) | 19 (0.7) | 89 (2.1) | 7 (1.4) | 10 (2.4) |
| Normal weight (18.5-24.9) | 688 (23.5) | 1,319 (35.7) | 100 (27) | 129 (19.8) |
| Overweight (25-29.9) | 1,253 (45.1) | 1,289 (34.3) | 151 (38.7) | 228 (33.3) |
| Obese (≥30) | 830 (30.7) | 1,067 (28.3) | 123 (32.9) | 303 (44.6) |
| Activities of daily living (ADLs) | ||||
| 0 | 2,289 (85.8) | 3,175 (81.7) | 317 (79.7) | 490 (67.2) |
| 1+ | 410 (14.2) | 654 (18.3) | 66 (20.3) | 185 (32.8) |
| Chronic conditions | ||||
| No chronic conditions | 178 (7.2) | 212 (5.7) | 21 (6.1) | 17 (2.5) |
| At least 1 chronic condition | 479 (18.0) | 678 (18.0) | 68 (18.2) | 85 (13.3) |
| 2+ more chronic conditions | 2,141 (74.7) | 2,939 (76.2) | 294 (75.7) | 573 (84.1) |
Number of participants, unweighted
Percentage, weighted
Men had a higher overall mean grip strength (39 kg) compared with women (22 kg) (p<0.001). Black women had significantly higher mean grip strength (24.5 kg) compared to white women (22.1 kg) (p<0.001); however, no differences were found between black and white men. Slow gait speed was highly prevalent in this national sample, with >55% walking slower than 0.8 m/second. Among whites, 44% of men and 58% of women had slow gait speed, compared with 75% percent of black men and 87% of black women.
After running sex-specific CART models, a primary split was on race was identified, indicating that grip strength cut points may differ across subgroups. As a result, subgroup-specific models for black men, black women, white men, and white women were run. Results from the CART models indicated that grip strength had the greatest predictive power of slow gait speed, appearing as the primary split in all models. The cut points and prevalence estimates by sex are presented in Table 2, along with the published cut points by FNIH11 for comparison. Based on the HRS cut points, more than half of this nationally representative sample of men and women (55% of all men [<39 kg] and 47% of all women [<22 kg]) were classified as weak, compared with 10% and 12% for men (<25.99 kg) and women (<15.92 kg), respectively, using the FNIH cut points. Cut points for clinical muscle weakness based on a walking speed of 0.6 m/second are provided in Appendix Table 1).
Table 2. Comparing Grip Strength Cut points for Muscle Weakness and Prevalence Estimates by Sex Between the HRS and FNIH.
| Classification | All men(n=3,182) | All women(n=4,506) | ||
|---|---|---|---|---|
|
| ||||
| Cut point (kg) | N (%)a | Cut point (kg) | N (%)a | |
| HRS | ||||
| Weak | <39 | 1,845 (55) | <22 | 1,998 (47) |
| Normal | ≥39 | 1,274 (45) | ≥22 | 2,317 (53) |
| FNIH | ||||
| Weak | <25.99 | 317 (10) | <15.92 | 523 (12) |
| Intermediate | ≥25.99 | 554 (17) | ≥15.92 | 863 (20) |
| Normal | ≥31.83 | 2,248 (73) | ≥19.99 | 2,929 (68) |
Weighted percentages.
HRS, Health and Retirement Study; FNIH, Foundation of the National Institutes of Health
Results from the CART models and associated prevalence estimates for the sex/race-specific subgroups are presented in Table 3. Among whites, 37% of men (<35kg) and 48% of women (<22 kg) were considered weak; whereas among blacks, 57% of men (<40 kg) and 88% of women (<31 kg) were categorized as weak. A visual representation of each CART tree is presented in Figure 1.
Table 3. Cut points and Prevalence Estimates for Clinical Muscle Weakness by Race/Sex in the Health and Retirement Study (HRS).
| HRS total sample (N =7,688) | ||||||||
|---|---|---|---|---|---|---|---|---|
|
| ||||||||
| Classification | White males (n=2,799) | Black males (n=383) | White women (n=3,829) | Black women (n=675) | ||||
|
| ||||||||
| Cut point (kg) | N (%) | Cut point (kg) | N (%) | Cut point (kg) | N (%) | Cut point (kg) | N (%) | |
| Weak | <35 | 1,111 (37) | <40 | 223 (57) | <22 | 1,794 (48) | <31 | 557 (88) |
| c | ≥35 | 1,639 (63) | ≥40 | 145 (43) | ≥22 | 1,885 (52) | ≥31 | 78 (12) |
Figure 1.
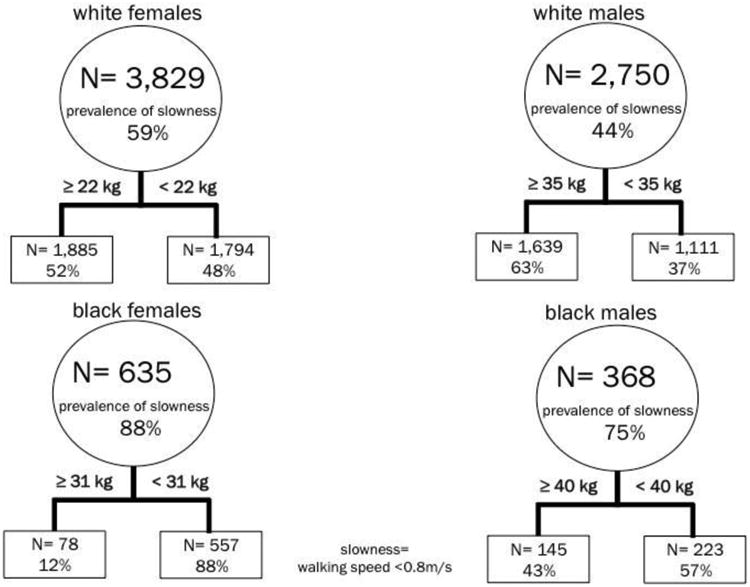
Classification and regression trees for clinical muscle weakness by race/sex in the Health and Retirement Study in the Health and Retirement Study.
The HRS grip strength cut points were found to have moderately high sensitivity and specificity with respect to slow gait speed and ADL disability (Appendix Table 2). For slow gait speed, sensitivity of the weakness cut points was 75% and 60% for white men and women, respectively. Specificity was also moderately high for white women (68%) and moderate for white men (54%). Sensitivity for black men (69%) and black women (90%) was notably higher, whereas specificity was somewhat lower for black men (65%) and women (29%). When comparing individuals on both weakness and ADLs, moderately high sensitivity and moderate specificity values for all subgroups were identified, providing further support that grip strength cut points were consistently identifying individuals with impaired function.
Discussion
This is the first study to identify grip strength cut points for clinical weakness using nationally representative data for older Americans. Findings indicate that muscle weakness is highly prevalent in the U.S. population, affecting more than half of men and women aged ≥65 years, and cut points varied widely by sex and race. Even when using the more conservative slow walking 0.6 m/second speed criterion, prevalence estimates were still high (from 22% to 58% across subgroups), especially compared with prevalence estimates using the recommended cut points proposed by FNIH.
Although there has been an ongoing debate in the literature on the validity of different cut points for clinical weakness,21 the FNIH cut points were intended for clinical practice22 and are already being utilized in research.23,24 The identified FNIH thresholds for grip strength are markedly lower than those obtained using population-based data, despite replicating their analysis using the same outcome (gait speed <0.8 m/second) with CART models. When quantifying the prevalence of clinical weakness using the FNIH cut points for men (<25.99 kg) and women (<15.92 kg) in the HRS data, only 10% of men and 12% of women were classified as weak. Using the FNIH cut points may, therefore, only identify the weakest and frail individuals in the population.
There is always a trade-off between sensitivity and specificity when cut points are assigned to a continuous screening variable. However, from a public health and prevention perspective, the choice to utilize a more conservative cut point in the context of screening and prevention may misclassify a large percentage of people who are actually at risk for future adverse health outcomes. Therefore, one can argue that it is far better to screen aggressively and provide early opportunities for identifying individuals that might actually benefit from a targeted intervention in order to delay or prevent steeper declines in function and health. And, as the cut points for clinical muscle weakness proposed in this study were derived at the population level, they have the potential to serve as a valuable screening tool in identifying which segments of the population are most vulnerable.
The grip strength cut points obtained for white men and women are consistent with a recent population-based survey in Finland, in which the association between grip strength cut points (<37 kg in men and <22 kg in women) and future incident mobility limitations was examined.25 Similarly, research conducted by Cruz-Jentoft and colleagues26 found that among community-dwelling older adults in Italy, having a grip strength <30 kg in men and <20 kg in women was associated with slow gait speed and an inability to walk 1 km without difficulty.
The results of this study show that grip strength cut points varied markedly by race, resulting in substantial differences in the prevalence of weakness by race and sex. Compared with white men (<35 kg) and women (<22 kg), grip strength cut points for clinical weakness were higher for black men (<40 kg) and women (<31 kg), indicating slow gait speed at higher levels of muscle strength. The accumulation of risks across the life course27,28 may offset the strength advantage in blacks. In addition, other competing risks may partly explain the high prevalence of slow walking speed in blacks. Notably, 44% of black women and 33% of black men were obese in this study, and weight status has been found to be an important predictor of slow walking speed.29 Thus, muscle strength may not confer the same level of protection for functional health outcomes in obese individuals. However, similar results were found when using relative grip strength (grip strength/BMI) in the CART models.
The results presented in this study are the first to address a critically important and stark health disparity among older black Americans, a minority group that has been largely overlooked in the muscle weakness literature, despite being at greater risk for physical functioning deficits and disability in later life.30 This work moves the field forward in identifying race-specific cut points while simultaneously shedding light on emerging health disparities that, if left untreated, may lead to a disproportionate burden of disability among blacks.
This study has several notable strengths. First, a novel statistical method in a nationally representative sample was used to obtain sex-specific cut points of clinical weakness by race. Although CART has been used in clinical research, tree-based approaches have been largely underutilized within observational epidemiology.31,32 Although variations in body composition across racial and ethnic groups are well established,36 this is the first study to examine racial differences in muscle weakness in diverse sample of older American adults. However, it should be noted that even though the replication of previous work by FNIH was carried out in this analysis, using slow walking speed as the primary outcome variable in the CART models may not have been ideal, particularly for black men and women, given the high prevalence of slow walking speed in the sample. Thus, future studies should focus on examining the relationship between grip strength and alternative outcomes when conducting muscle weakness research in a heterogeneous sample of older Americans.
In addition, using nationally representative data is an important strength of this study because the results can be generalized to American adults aged ≥65 years, rather than a select few. Given the emerging burden of weakness at the population level, the use of nationally representative data provides a critical first step in screening efforts used to identify individuals who may be a greatest risk, and ultimately for determining where best to direct preventive interventions. Previous work has derived cut points from sample-specific distributions,1 and relied on non-representative reference populations,3,34 or non–nationally representative, pooled data sources to establish definitions for weakness,11 all of which may not be generalizable at the population level for identifying and treating clinical weakness.
Limitations
Despite these strengths, this study is not without limitations. The small sample size of other racial/ethnic groups meant that there was not enough power to explore muscle weakness cut points by other subgroups. Future work is needed to examine grip strength cut points for older Hispanics as this is a rapidly growing subgroup projected to increase by nearly 115% between 2014 and 2060 in the U.S.35 Given the cross-sectional nature of this analysis, the temporal relationship between grip strength and gait speed could not be established. Longitudinal data are needed to directly assess the directional link between strength loss and mobility impairment, and to test the validity of the cut points in predicting negative health outcomes, such as mobility disability and mortality in later life. The timed walk was assessed by trained interviewers using home-based measurements that may be subject to measurement error. However, when using a more conservative criterion of 0.6 m/second for slow gait speed,36 29% of men and 22% of women were classified as weak, which is still greater than twice the prevalence identified using the FNIH cut points.11 Lastly, one major driver of sarcopenia is the subsequent loss in muscle mass.37 Appendicular muscle mass could not be assessed in this study because body composition measurements were not available in HRS.
Conclusions
Though further validation studies are needed, the results of this study lay the groundwork in establishing cut points that can serve as an easy and accessible clinical tool for identifying individuals who may be at risk for experiencing adverse health outcomes, including future falls,38 incident disability,3,5 morbidity,6 and all-cause mortality.7,39 Early identification of those at risk provides the greatest opportunities for effective interventions (e.g., resistance training) aimed at increasing muscle strength. Moreover, a high prevalence of both weakness and slow gait speed in older Americans was observed, which considered concurrently, have important implications for future disability risk in the U.S. population. The results presented in this study underscore the importance of using population level data to identify individuals at greatest risk for adverse health outcomes.
Supplementary Material
Acknowledgments
Research reported in this publication was supported by the National Institute on Aging of NIH under Award Number T32AG027708. The content is solely the responsibility of the authors and does not necessarily represent the official views of NIH. The funders had no role in the design and conduct of the study; the collection, analysis, and interpretation of the data; or the preparation, review, or approval of the manuscript.
Footnotes
No financial disclosures were reported by the authors of this paper.
Publisher's Disclaimer: This is a PDF file of an unedited manuscript that has been accepted for publication. As a service to our customers we are providing this early version of the manuscript. The manuscript will undergo copyediting, typesetting, and review of the resulting proof before it is published in its final citable form. Please note that during the production process errors may be discovered which could affect the content, and all legal disclaimers that apply to the journal pertain.
References
- 1.Cruz-Jentoft AJ, Baeyens JP, Bauer JM, et al. Sarcopenia: European consensus on definition and diagnosis: Report of the European Working Group on Sarcopenia in Older People. Age Ageing. 2010;39(4):412–423. doi: 10.1093/ageing/afq034. https://doi.org/10.1093/ageing/afq034. [DOI] [PMC free article] [PubMed] [Google Scholar]
- 2.Fielding RA, Vellas B, Evans WJ, et al. Sarcopenia: an undiagnosed condition in older adults. Current consensus definition: prevalence, etiology, and consequences. International working group on sarcopenia. J Am Med Dir Assoc. 2011;12(4):249–256. doi: 10.1016/j.jamda.2011.01.003. https://doi.org/10.1016/j.jamda.2011.01.003. [DOI] [PMC free article] [PubMed] [Google Scholar]
- 3.Sallinen J, Stenholm S, Rantanen T, Heliövaara M, Sainio P, Koskinen S. Hand-grip strength cut points to screen older persons at risk for mobility limitation. J Am Geriatr Soc. 2010;58(9):1721–1726. doi: 10.1111/j.1532-5415.2010.03035.x. https://doi.org/10.1111/j.1532-5415.2010.03035.x. [DOI] [PMC free article] [PubMed] [Google Scholar]
- 4.Hicks GE, Shardell M, Alley DE, et al. Absolute strength and loss of strength as predictors of mobility decline in older adults: the InCHIANTI study. J Gerontol A Biol Sci Med Sci. 2012;67(1):66–73. doi: 10.1093/gerona/glr055. https://doi.org/10.1093/gerona/glr055. [DOI] [PMC free article] [PubMed] [Google Scholar]
- 5.Rantanen T. Midlife Hand Grip Strength as a Predictor of Old Age Disability. JAMA. 1999;281(6):558. doi: 10.1001/jama.281.6.558. https://doi.org/10.1001/jama.281.6.558. [DOI] [PubMed] [Google Scholar]
- 6.Leong DP, Teo KK, Rangarajan S, et al. Prognostic value of grip strength: findings from the Prospective Urban Rural Epidemiology (PURE) study. Lancet. 2015;386(9990):266–273. doi: 10.1016/S0140-6736(14)62000-6. https://doi.org/10.1016/S0140-6736(14)62000-6. [DOI] [PubMed] [Google Scholar]
- 7.Cooper R, Kuh D, Hardy R. Objectively measured physical capability levels and mortality: systematic review and meta-analysis. BMJ. 2010;341:c4467. doi: 10.1136/bmj.c4467. https://doi.org/10.1136/bmj.c4467. [DOI] [PMC free article] [PubMed] [Google Scholar]
- 8.Peolsson A, Hedlund R, Oberg B. Intra- and inter-tester reliability and reference values for hand strength. J Rehabil Med. 2001;33(1):36–41. doi: 10.1080/165019701300006524. https://doi.org/10.1080/165019701300006524. [DOI] [PubMed] [Google Scholar]
- 9.Bandinelli S, Benvenuti E, Del Lungo I, et al. Measuring muscular strength of the lower limbs by hand-held dynamometer: A standard protocol. Aging Clin Exp Res. 2014;11(5):287–293. doi: 10.1007/BF03339802. https://doi.org/10.1007/BF03339802. [DOI] [PubMed] [Google Scholar]
- 10.Studenski SA, Peters KW, Alley DE, et al. The FNIH sarcopenia project: rationale, study description, conference recommendations, and final estimates. J Gerontol A Biol Sci Med Sci. 2014;69(5):547–558. doi: 10.1093/gerona/glu010. https://doi.org/10.1093/gerona/glu010. [DOI] [PMC free article] [PubMed] [Google Scholar]
- 11.Alley DE, Shardell MD, Peters KW, et al. Grip strength cutpoints for the identification of clinically relevant weakness. J Gerontol A Biol Sci Med Sci. 2014;69(5):559–566. doi: 10.1093/gerona/glu011. https://doi.org/10.1093/gerona/glu011. [DOI] [PMC free article] [PubMed] [Google Scholar]
- 12.Growing Older in America: The Health and Retirement Study. [Accessed December 15, 2015]; http://hrsonline.isr.umich.edu/index.php?p=dbook.
- 13.Crimmins EM, Guyer H, Langa KM, Ofstedal MB, Wallace RB, Weir DR. Documentation of Physical Measures, Anthropometrics and Blood Pressure in the Health and Retirement Study. HRS. 2008 Feb [Google Scholar]
- 14.Abellan van Kan G, Rolland Y, Andrieu S, et al. Gait speed at usual pace as a predictor of adverse outcomes in community-dwelling older people an International Academy on Nutrition and Aging (IANA) Task Force. J Nutr Health Aging. 2009;13(10):881–889. doi: 10.1007/s12603-009-0246-z. https://doi.org/10.1007/s12603-009-0246-z. [DOI] [PubMed] [Google Scholar]
- 15.Studenski S, Perera S, Patel K, et al. Gait speed and survival in older adults. JAMA. 2011;305(1):50–58. doi: 10.1001/jama.2010.1923. https://doi.org/10.1001/jama.2010.1923. [DOI] [PMC free article] [PubMed] [Google Scholar]
- 16.Sonn U, Frändin K, Grimby G. Instrumental activities of daily living related to impairments and functional limitations in 70-year-olds and changes between 70 and 76 years of age. [Accessed December 15, 2015];Scand J Rehabil Med. 1995 27(2):119–128. http://europepmc.org/abstract/med/7569821. [PubMed] [Google Scholar]
- 17.Brach JS, VanSwearingen JM. Physical impairment and disability: relationship to performance of activities of daily living in community-dwelling older men. Phys Ther. 2002;82(8):752–761. http://ptjournal.apta.org/content/82/8/752.full.pdf. [PubMed] [Google Scholar]
- 18.An aging nation: the older population in the United States. Washington, DC: U.S. Census Bureau; 2014. [Accessed December 7, 2015]. pp. 25–1140. www.census.gov/prod/2014pubs/p25-1140.pdf. [Google Scholar]
- 19.Therneau TM, Atkinson EJ. An Introduction to Recursive Partitioning Using the RPART Routines. Program. 1997:1–52. [Google Scholar]
- 20.Zhang H, Singer B. Recursive Partitioning in the Health Sciences. Springer Science and Business Media; 2013. [Google Scholar]
- 21.Clark BC, Manini TM. What is dynapenia? Nutrition. 2012;28(5):495–503. doi: 10.1016/j.nut.2011.12.002. https://doi.org/10.1016/j.nut.2011.12.002. [DOI] [PMC free article] [PubMed] [Google Scholar]
- 22.Studenski SA, Peters KW, Alley DE, et al. The FNIH sarcopenia project: rationale, study description, conference recommendations, and final estimates. J Gerontol A Biol Sci Med Sci. 2014;69(5):547–558. doi: 10.1093/gerona/glu010. https://doi.org/10.1093/gerona/glu010. [DOI] [PMC free article] [PubMed] [Google Scholar]
- 23.Looker AC, Wang CY (US) NC for HS. Prevalence of Reduced Muscle Strength in Older U.S. Adults: United States, 2011–2012. Women. 2015;60:79. [PubMed] [Google Scholar]
- 24.Fox B, Henwood T, Schaap L, et al. Adherence to a standardized protocol for measuring grip strength and appropriate cut-off values in adults over 65 years with sarcopenia: a systematic review protocol. JBI Database Syst Rev Implement Reports. 2015;13(10):50–59. doi: 10.11124/jbisrir-2015-2256. https://doi.org/10.11124/jbisrir-2015-2256. [DOI] [PubMed] [Google Scholar]
- 25.Lauretani F, Russo CR, Bandinelli S, et al. Age-associated changes in skeletal muscles and their effect on mobility: an operational diagnosis of sarcopenia. J Appl Physiol. 2003;95(5):1851–1860. doi: 10.1152/japplphysiol.00246.2003. https://doi.org/10.1152/japplphysiol.00246.2003. [DOI] [PubMed] [Google Scholar]
- 26.Cruz-Jentoft AJ, Baeyens JP, Bauer JM, et al. Sarcopenia: European consensus on definition and diagnosis: Report of the European Working Group on Sarcopenia in Older People. Age Ageing. 2010;39(4):412–423. doi: 10.1093/ageing/afq034. https://doi.org/10.1093/ageing/afq034. [DOI] [PMC free article] [PubMed] [Google Scholar]
- 27.Williams DR, Jackson PB. Social sources of racial disparities in health. Health Aff (Millwood) 2005;24(2):325–334. doi: 10.1377/hlthaff.24.2.325. https://doi.org/10.1377/hlthaff.24.2.325. [DOI] [PubMed] [Google Scholar]
- 28.Williams DR. Race and health: Basic questions, emerging directions. Ann Epidemiol. 1997;7(5):322–333. doi: 10.1016/s1047-2797(97)00051-3. https://doi.org/10.1016/S1047-2797(97)00051-3. [DOI] [PubMed] [Google Scholar]
- 29.Beavers KM, Beavers DP, Houston DK, et al. Associations between body composition and gait-speed decline: results from the Health, Aging, andBody Composition study. Am J Clin Nutr. 2013;97(3):552–560. doi: 10.3945/ajcn.112.047860. https://doi.org/10.3945/ajcn.112.047860. [DOI] [PMC free article] [PubMed] [Google Scholar]
- 30.Haas SA, Krueger PM, Rohlfsen L. Race/ethnic and nativity disparities in later life physical performance: the role of health and socioeconomic status over the life course. J Gerontol B Psychol Sci Soc Sci. 2012;67(2):238–248. doi: 10.1093/geronb/gbr155. https://doi.org/10.1093/geronb/gbr155. [DOI] [PMC free article] [PubMed] [Google Scholar]
- 31.Gass K, Klein M, Chang HH, Flanders WD, Strickland MJ. Classification and regression trees for epidemiologic research: an air pollution example. Environ Health. 2014;13(1):17. doi: 10.1186/1476-069X-13-17. https://doi.org/10.1186/1476-069X-13-17. [DOI] [PMC free article] [PubMed] [Google Scholar]
- 32.Banerjee M, Muenz DG, Chang JT, Papaleontiou M, Haymart MR. Tree-based model for thyroid cancer prognostication. J Clin Endocrinol Metab. 2014;99(10):3737–3745. doi: 10.1210/jc.2014-2197. https://doi.org/10.1210/jc.2014-2197. [DOI] [PMC free article] [PubMed] [Google Scholar]
- 33.Willett W. Nutritional Epidemiology. Oxford University Press; 2012. https://doi.org/10.1093/acprof:oso/9780199754038.001.0001. [Google Scholar]
- 34.Baumgartner RN, Koehler KM, Gallagher D, et al. Epidemiology of Sarcopenia among the Elderly in New Mexico. Am J Epidemiol. 1998;147(8):755–763. doi: 10.1093/oxfordjournals.aje.a009520. https://doi.org/10.1093/oxfordjournals.aje.a009520. [DOI] [PubMed] [Google Scholar]
- 35.Colby SL, Ortman JM. Projections of the Size and Composition of the U.S. Population: 2014 to 2060. 2015 www.census.gov/content/dam/Census/library/publications/2015/demo/p25-1143.pdf?
- 36.Perera S, Patel KV, Rosano C, et al. Gait speed predicts incident disability: a pooled analysis. J Gerontol Ser A Biol Sci Med Sci. 2016;71(1):63–71. doi: 10.1093/gerona/glv126. https://doi.org/10.1093/gerona/glv126. [DOI] [PMC free article] [PubMed] [Google Scholar]
- 37.Newman AB, Kupelian V, Visser M, et al. Strength, But Not Muscle Mass, Is Associated With Mortality in the Health, Aging and Body Composition Study Cohort. J Gerontol Ser A Biol Sci Med Sci. 2006;61(1):72–77. doi: 10.1093/gerona/61.1.72. https://doi.org/10.1093/gerona/61.1.72. [DOI] [PubMed] [Google Scholar]
- 38.Visser M, Schaap LA. Consequences of sarcopenia. Clin Geriatr Med. 2011;27(3):387–399. doi: 10.1016/j.cger.2011.03.006. https://doi.org/10.1016/j.cger.2011.03.006. [DOI] [PubMed] [Google Scholar]
- 39.Leong DP, Teo KK, Rangarajan S, et al. Prognostic value of grip strength: findings from the Prospective Urban Rural Epidemiology (PURE) study. Lancet. 2015;386(9990):266–273. doi: 10.1016/S0140-6736(14)62000-6. https://doi.org/10.1016/S0140-6736(14)62000-6. [DOI] [PubMed] [Google Scholar]
Associated Data
This section collects any data citations, data availability statements, or supplementary materials included in this article.