Abstract
Purpose
Sequential same‐patient CT images may involve deformation‐induced and non‐deformation‐induced voxel intensity changes. An adaptive deformation recovery and intensity correction (ADRIC) technique was developed to improve the CT reconstruction accuracy, and to separate deformation from non‐deformation‐induced voxel intensity changes between sequential CT images.
Materials and methods
ADRIC views the new CT volume as a deformation of a prior high‐quality CT volume, but with additional non‐deformation‐induced voxel intensity changes. ADRIC first applies the 2D‐3D deformation technique to recover the deformation field between the prior CT volume and the new, to‐be‐reconstructed CT volume. Using the deformation‐recovered new CT volume, ADRIC further corrects the non‐deformation‐induced voxel intensity changes with an updated algebraic reconstruction technique (“ART‐dTV”). The resulting intensity‐corrected new CT volume is subsequently fed back into the 2D‐3D deformation process to further correct the residual deformation errors, which forms an iterative loop. By ADRIC, the deformation field and the non‐deformation voxel intensity corrections are optimized separately and alternately to reconstruct the final CT.
CT myocardial perfusion imaging scenarios were employed to evaluate the efficacy of ADRIC, using both simulated data of the extended‐cardiac‐torso (XCAT) digital phantom and experimentally acquired porcine data. The reconstruction accuracy of the ADRIC technique was compared to the technique using ART‐dTV alone, and to the technique using 2D‐3D deformation alone. The relative error metric and the universal quality index metric are calculated between the images for quantitative analysis. The relative error is defined as the square root of the sum of squared voxel intensity differences between the reconstructed volume and the “ground‐truth” volume, normalized by the square root of the sum of squared “ground‐truth” voxel intensities. In addition to the XCAT and porcine studies, a physical lung phantom measurement study was also conducted. Water‐filled balloons with various shapes/volumes and concentrations of iodinated contrasts were put inside the phantom to simulate both deformations and non‐deformation‐induced intensity changes for ADRIC reconstruction. The ADRIC‐solved deformations and intensity changes from limited‐view projections were compared to those of the “gold‐standard” volumes reconstructed from fully sampled projections.
Results
For the XCAT simulation study, the relative errors of the reconstructed CT volume by the 2D‐3D deformation technique, the ART‐dTV technique, and the ADRIC technique were 14.64%, 19.21%, and 11.90% respectively, by using 20 projections for reconstruction. Using 60 projections for reconstruction reduced the relative errors to 12.33%, 11.04%, and 7.92% for the three techniques, respectively. For the porcine study, the corresponding results were 13.61%, 8.78%, and 6.80% by using 20 projections; and 12.14%, 6.91%, and 5.29% by using 60 projections. The ADRIC technique also demonstrated robustness to varying projection exposure levels. For the physical phantom study, the average DICE coefficient between the initial prior balloon volume and the new “gold‐standard” balloon volumes was 0.460. ADRIC reconstruction by 21 projections increased the average DICE coefficient to 0.954.
Conclusion
The ADRIC technique outperformed both the 2D‐3D deformation technique and the ART‐dTV technique in reconstruction accuracy. The alternately solved deformation field and non‐deformation voxel intensity corrections can benefit multiple clinical applications, including tumor tracking, radiotherapy dose accumulation, and treatment outcome analysis.
Keywords: CT reconstruction, deformation recovery, intensity correction, myocardial perfusion, total variation
1. Introduction
With three‐dimensional volumetric rendering, high spatial resolution, and relatively short imaging time, computed tomography (CT) has become a standard, multipurpose clinical tool for disease diagnosis,1 treatment planning and guidance,2, 3 treatment verification,4 and outcome analysis.5 Recent advancements in multislice, cone‐beam geometry‐based CT systems6 have further enabled more accurate and timely imaging of fast‐moving organs such as the heart with reduced motion artifacts. However, as CT is based on the use of x‐rays for imaging, radiation exposure poses additional risks to the patients. CT imaging may increase the risk of secondary cancers,7 especially when repetitive imaging is required. Such scenarios include dynamic myocardial perfusion imaging8 and daily on‐board cone‐beam CT imaging for radiation therapy patients.4
The current clinical CT imaging protocol needs to acquire a considerable amount (>>100) of projections across a full scan angle to reconstruct the CT volume. To reduce the CT imaging dose, there are proposals to reduce the dose per projection, or to reduce the number of projections by acquiring sparse‐view projections. However, the increased noise from lower dose acquisition, or the limited sampling from sparse‐view acquisition, leads to amplified image noises/artifacts in the reconstructed images by filtered back‐projection (FBP),9 the standard reconstruction algorithm used in current CT systems. To address this problem, multiple iterative reconstruction techniques10, 11, 12, 13, 14, 15, 16, 17, 18 have been proposed to improve reconstruction accuracy. These techniques, including the algebraic reconstruction technique (ART),10 iteratively optimize data fidelity through matching the acquired projections with the simulated projections from the reconstructed CT volumes. In addition to data fidelity optimization, many techniques also use preassumed CT image features like piecewise constancy and intensity gradient sparsity12, 13, 14 to further regularize the reconstructed image. The minimization of the total variation (TV),19 a metric effective for data de‐noising, has shown prominent benefits in CT reconstruction. All these methods may lead to substantial improvements in CT image quality as compared to the traditional FBP algorithm. However, the reconstructed CT often suffers from feature changes and fine structure loss due to oversmoothing,20 as the piecewise constancy and intensity gradient sparsity assumptions may not hold for complicated anatomical structures.
In addition to the previously mentioned techniques, a new CT reconstruction approach was recently investigated.21, 22, 23, 24, 25, 26, 27, 28, 29, 30 Instead of directly reconstructing the CT volume from acquired projections, the new approach estimates it by deforming a previously acquired high‐quality CT volume using a deformation field. The image reconstruction thus turns into the optimization of the deformation field to match the acquired projections with the projected ones from the deformed CT volume,28 which is a 2D‐3D deformation process. The deformation field can be solved as B‐splines,23, 24 solved with free‐form deformation models,25, 27, 28, 31 or solved by using dimensional reduction techniques like principal component analysis.22, 26 The efficacy of the 2D‐3D deformation approach has been validated in multiple studies. The successful incorporation of the prior CT volume enables accurate image reconstruction with limited‐view projections. This incorporation also passes along image features and fine structures from the high‐quality prior CT volume to the new CT volume to reduce potential oversmoothing effects. Recent studies32 also demonstrated that the CT volumes generated by 2D‐3D deformation enable more accurate dose calculation than CT volumes reconstructed by FBP‐based algorithm for radiation therapy due to the accurate Hounsfield unit (HU) information inherited from the high‐quality prior CT volume. However, the 2D‐3D deformation approach is based on the assumption that the voxel variations between prior and new CT volumes are induced by deformation alone, which does not apply to many clinical scenarios. Anatomical and physiological variations between prior and new CT acquisitions, such as tissue calcification,33 inflammation,34 fibrosis/necrosis,35 and transit of contrast agent in perfusion imaging,8 can all result in non‐deformation‐induced voxel intensity changes. These non‐deformation intensity changes cannot be corrected even with the true deformation fields. In contrast, they may adversely affect deformation field optimization by introducing false signals.
To address the problems described above, this study aimed to develop a new CT reconstruction method to integrate the TV‐constrained algebraic reconstruction technique with the 2D‐3D deformation method. The new reconstruction method, named adaptive deformation recovery and intensity correction (ADRIC), was able to recover both deformation and non‐deformation‐induced voxel intensity changes between prior and new CT volumes. Prior to this work, there are some previous studies trying to solve jointly the motion and the image intensity, including the motion‐compensated prior image constrained compressed sensing technique (PICCS) and the deformable prior image registration, penalized‐likelihood estimation technique (dPIRPLE).36, 37 However, the motion‐compensated PICCS technique only considers the rigid motion correction from prior to new images, which can potentially be less applicable to imaging sites that involve a large extent of deformation. On the other hand, the dPIRPLE technique proposes to solve deformation and image reconstruction jointly, which generates promising results in cadaver experiments. However, the deformation field of dPIRPLE is iteratively solved by deforming a fixed prior image to the gradually reconstructed new image. The non‐deformation‐induced image voxel intensity changes from prior to new images may introduce false signals that affect the accuracy of the solved deformation fields. In this study, we proposed the ADRIC technique to solve the deformation field and the non‐deformation‐induced intensity variations in an adaptive and alternating fashion. The deformation field will be updated, based on an adaptive prior image being continuously corrected for the non‐deformation‐induced intensity changes. Thus, the solved DVFs will potentially be less affected by the false signals introduced from non‐deformation‐induced intensity changes.
We evaluated the accuracy of the proposed method using the CT myocardial perfusion imaging scenario. In myocardial perfusion imaging, the spatial misalignments and contrast‐agent‐induced voxel intensity mismatches between prior and new CT volumes provided a good scenario to examine the efficacy of the ADRIC framework. Both simulation studies using the extended cardiac torso (XCAT)38 digital phantom and experimental studies using porcine data were performed. The effects of sampling sparseness and exposure per projection (simulated as different noise levels) were also evaluated in the study. In addition to the XCAT and the porcine studies, a physical lung phantom measurement study was also performed to further evaluate the accuracy of ADRIC using projections acquired on a real system.
2. Materials and methods
ADRIC is a technique that integrates and alternates between the 2D‐3D deformation technique and the TV‐constrained algebraic reconstruction technique (ART) (Fig. 1).
Figure 1.
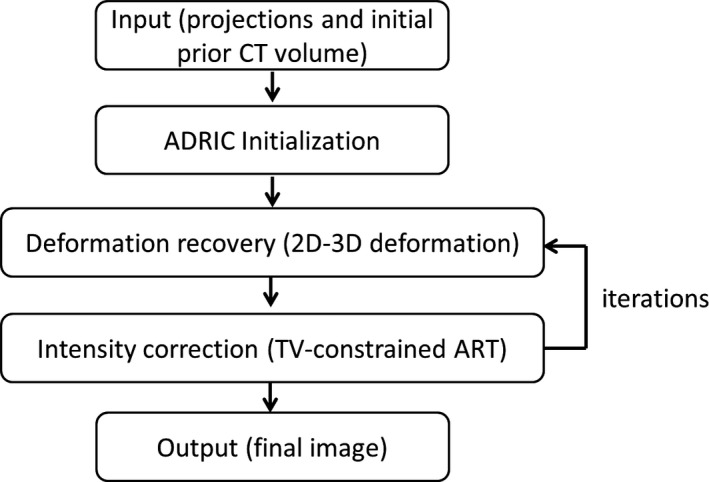
The general scheme of the ADRIC technique.
2.A. 2D‐3D deformation technique
For the 2D‐3D deformation technique, the new CT volume was deformed from the prior, already‐known CT volume using the deformation vector field (DVF, denoted by , ):
| (1) |
Using Eq. (1), the problem of solving turns into that of solving . The solution of was subject to the data fidelity constraint, which enforced the equality between the acquired projections and the projected ones from the deformed CT volume:
| (2) |
The symbol denotes the acquired projections. The symbol denotes the projecting matrices corresponding to . As shown in Eqs. (1) and (2), the deformation of the 3D CT volume (Eq. (1)) was constrained and guided by the 2D projection matching (Eq. (2)), from which the name “2D‐3D deformation” originates.
Enforcing the data fidelity constraint in Eq. (2) translated into minimizing an objective function to solve , as shown in Eq. (3):
| (3) |
The objective function was defined as the data fidelity error, a unitless quantity calculated as the sum of squared differences between the acquired projections and the projected ones from the deformed/reconstructed CT volume. The optimization of Eq. (3) was an ill‐posed problem for limited‐view projections . To regularize the DVF for a stable solution, an additional deformation energy term27, 28 was defined as:
| (4) |
The parameter separates into deformation fields along the three canonical directions , respectively. The and parameters denote the DVF size along and directions, respectively. The deformation energy works as a penalty term that applies large penalties for greater variations in the DVF. Minimization of the deformation energy not only preserves the DVF smoothness but also reduces the DVF solution space for faster convergence.
Adding the deformation energy term to the original objective function of Eq. (3) yields the final objective function for the 2D‐3D deformation technique:
| (5) |
The parameter denotes the weighting factor, which was applied to balance the data fidelity constraint and the deformation energy penalty. It was empirically set as 0.05 in this study based on previous trial‐and‐error studies.27, 39, 40 The gradient of the objective function in Eq. (5) can be explicitly computed,28 which enables the objective function to be conveniently minimized through the nonlinear conjugate gradient algorithm. For implementation details of the algorithm, please refer to our previous publication.27
The minimization of the objective function in Eq. (5), or in other words, the enforcement of the 2D‐3D deformation, output a DVF along with the deformed CT volume (Eq. (1)). The deformation assumption explicitly made in Eq. (1), however, failed to address the potential non‐deformation‐induced voxel intensity changes. Further intensity corrections were necessary to address this non‐deformation component. The output DVF after the 2D‐3D deformation was then viewed as an intermediate DVF . Correspondingly, the resulting CT volume was an intermediate deformation‐recovered CT volume , which was subject to further intensity corrections via the TV‐constrained ART technique.
2.B. TV‐constrained ART
Following the 2D‐3D deformation, the TV‐constrained ART updated the CT voxel intensities directly to minimize the mismatches between the acquired projections and the projected ones.14 Specifically, ART updated the intermediate deformation‐recovered CT volume passed down from the 2D‐3D deformation step via Eq. (6):
| (6) |
The parameter denotes the CT voxels. The parameter denotes the line integral at pixel of the acquired projections (Eq. (2)). The parameter denotes the intersection length of projection ray with CT voxels for the projection matrix (Eq. (2)). The parameter denotes the relaxation factor, which was empirically set as 0.05 in this study based on a parameterized study evaluating relaxation factors ranging from 0.005 to 0.5 (see details in Fig S1). The image was continuously updated after looping through each projection ray .
After ART updates, TV‐minimization‐based correction was further applied to regularize the image. Traditionally, TV was calculated on the ART‐updated CT ( in Eq. (6)). In this study we calculated the isotropic TV seminorm on the difference image . was calculated as the difference between the and the deformation‐recovered CT by the composite DVF :
| (7) |
Note that is different from . denotes the CT volume passed down from the 2D‐3D deformation step that proceeds the ART update. In contrast, denotes the pure deformation‐recovered CT volume without intensity correction. It was generated by deforming the very‐first, initial prior CT volume (to differentiate it from the in Eq. (1), we denoted it as ) using the composite DVF . was accumulated from all the solved by prior 2D‐3D deformation steps (Eq. (8)), representing the total deformation between the initial prior CT and the new CT solved thus far:
| (8) |
denotes the intermediate DVF solved by each prior 2D‐3D deformation step, indexed by . The parameter denotes the total number of precedent iterations. The symbol denotes the deformation field composition operator.
This TV regularization approach was mainly deployed to achieve two objectives. The first objective was to avoid the strong assumption that the whole was sparse in intensity gradient. Instead, only the intensity gradient sparsity of , the difference volume between the volume and the volume was assumed. The volume, which equaled the correction applied toward non‐deformation‐induced voxel intensity changes, was more likely to be sparse in the intensity gradient. Thus, the new TV term can better preserve the information of and reduce the effects of oversmoothing. The concept of using the difference image for TV regularization was first proposed by the PICCS technique13 and achieved encouraging results. The second objective of using this TV approach was to reduce the intensity corrections applied toward deformation‐induced voxel intensity changes. Some deformation‐induced voxel intensity changes might not be fully recovered through the previous 2D‐3D deformation steps. Reductions in intensity corrections applied toward these deformation‐induced changes would allow the following 2D‐3D deformation step to further update the composite DVF. In this study, we named the whole intensity correction approach “ART‐dTV”, to differentiate it from the traditional “ART‐TV” approach that regularizes the TV using . In general, the ART‐dTV algorithm is very similar to the PICCS algorithm, only without the conventional TV regularization term imposed on the intensity gradient of the full image. The conventional TV term, as explained in the PICCS reference,13 was introduced to mitigate the effects of potential artifacts in the prior image on the reconstructed new image. As we proposed to use high‐quality prior image with few artifacts in this study, we did not use this term to simplify the ADRIC workflow. However, such a term can still be implemented if prior image with lower quality is to be used. The ART‐dTV technique was employed using a constrained optimization approach. First, the ART update (Eq. (6)) was implemented. Second, the TV (Eq. (7)) minimization was enforced, by using the standard steepest descent method.14 The number of steepest descent iterations was set to 20 in this study. Only one ART update and 20 TV steepest descent updates were applied in the intensity correction step. The ART‐dTV generated an intermediate intensity‐corrected CT volume after each optimization, which was then fed back into the 2D‐3D deformation step for the next iteration (Fig. 1). The following 2D‐3D deformation step would continue to correct the deformation‐induced residual errors, and the reduction in false signals from non‐deformation intensity changes further benefits the correction and fine‐tuning of the composite DVF.
2.C. Detailed framework of the ADRIC technique
The detailed framework of the ADRIC technique was provided in Fig. 2. As shown, the ADRIC technique can be separated into two stages: the ADRIC‐initialization stage and the ADRIC‐main stage. Although a high‐quality initial prior CT image was incorporated into the 2D‐3D deformation algorithm, the optimization problem was still ill‐conditioned, as the number of unknown DVF variables far exceeded the information provided by limited‐view projections. The ADRIC‐initialization stage provided a rough DVF to feed into the initial implementation of the 2D‐3D deformation algorithm, to prevent it from being trapped at local optima during optimization. Using instead of zero‐valued initial DVF enables faster convergence and generates better final CT images for the 2D‐3D deformation algorithm, as evidenced in our previous publication.27 To generate , a coarse CT volume was first reconstructed from the limited‐view projections.14 Then it was registered with using the Demons registration algorithm41 to obtain the . After the ADRIC‐initialization stage, the implementation of the following ADRIC‐main stage was detailed below:
Feed the , the (used as in Eq. (5)) and the limited‐view projections simultaneously into the 2D‐3D deformation algorithm. The algorithm will generate and the corresponding according to Eq. (5);
Compose the with intermediate DVFs solved in previous iterations (if any) to , and deform using the to according to Eq. (8);
Feed the (as the starting volume), the , and the limited‐view projections simultaneously into the ART‐dTV algorithm to generate the intermediate intensity‐corrected volume after ART updates (Eq. (6)) and TV (Eq. (7)) minimization;
Evaluate the stopping criterion based on data fidelity of projections. If it is satisfied, exit the loop. If not, continue to step (5);
Feed a zero‐valued initial DVF, the (used as in Eq. (5)), and the limited‐view projections simultaneously into the 2D‐3D deformation algorithm. Similar to step (1), the algorithm will generate and the corresponding according to Eq. (5); Continue back to step (2).
Figure 2.
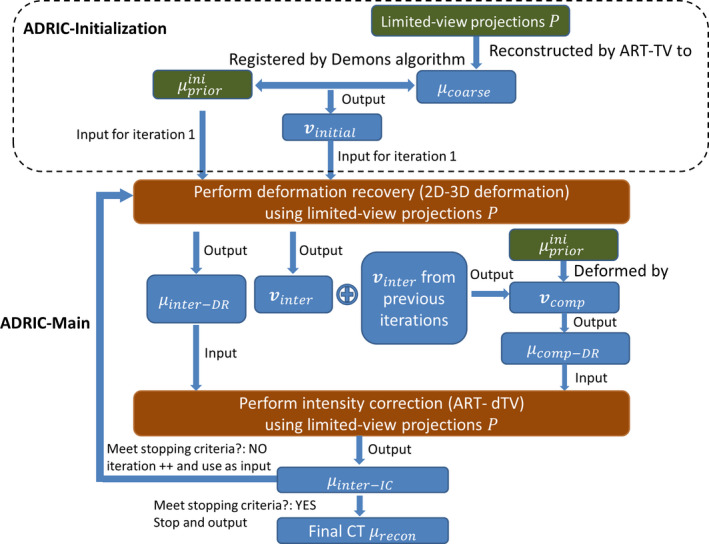
The detailed framework of the ADRIC technique. [Color figure can be viewed at wileyonlinelibrary.com]
In summary, starting from an intermediate intensity‐corrected CT volume (or the initial prior CT volume for the first iteration), the ADRIC technique used 2D‐3D deformation to generate an intermediate DVF, and accumulated it with previously solved ones into the composite DVF. The composite DVF represents the total deformation between the initial prior CT and the new CT. After implementing the 2D‐3D deformation step, ADRIC further applied ART‐dTV to adaptively correct the non‐deformation‐induced voxel intensity changes. The resulting intermediate intensity‐corrected CT volume was iteratively fed back into the 2D‐3D deformation step again, to generate a new intermediate DVF and further update the composite DVF. The cumulatively updated composite DVF and the adaptively updated nondeformation voxel intensity corrections were optimized separately and alternately to reconstruct the final CT volume. The reconstructed final CT volume could then be conveniently separated into two components: the final (ADRIC deformation‐recovered CT) and the additional, non‐deformation intensity correction based on it (ADRIC intensity correction, equal to the difference volume between the final reconstructed CT and the final ).
2.D. Simulation using the XCAT phantom
To evaluate the efficacy of the ADRIC algorithm, we used the anthropomorphic XCAT digital phantom to simulate a patient undergoing CT myocardial perfusion imaging. An initial prior CT volume covering the heart and part of the lung region was simulated to have 256 * 256 * 60 voxels, with each voxel measuring . The volume was simulated using a nominal imaging energy of 80 keV, to approach the clinically used polychromatic spectrum of 120 kV peak energy. Based on the initial prior CT volume, a new CT volume was simulated. Spatial misalignments were simulated between the initial prior CT and the new CT, including both respiratory‐motion‐ and cardiac‐motion‐induced deformation. Non‐deformation‐induced voxel intensity changes were also added to the new CT volume to simulate the transit of perfusion contrast agent in the new CT scan. The attenuation coefficient of the perfusion contrast was set to 0.0055/mm.
Limited‐view cone‐beam projections were simulated using the new CT volume and spread evenly across a 360° scan angle. The projections were simulated to have 300 * 100 pixels, with each pixel measuring . Different numbers of projections were simulated, ranging from 10, 20, 40, to 60, representing different angular sampling sparseness. In addition to the angular sampling sparseness, we also evaluated the effects of different projection exposure levels (in the forms of different noise levels) on image reconstruction accuracy. Different levels of noise were added to the noise‐free projection data through Eq. (9):
| (9) |
The parameter denotes the noise‐free line integral value at pixel . The parameter denotes simulated incident photon counts for each pixel. Different values of were used, ranging from to infinity (for the noise‐free scenario), to represent different exposure levels (higher exposure level corresponds to lower noise level). The Poisson term adds quantum noise with Poisson nature. The Normal term adds background electronic noise with Gaussian nature. The of Gaussian noise was set to 10 according to previous studies.42, 43 For the noise‐free scenario, the Gaussian noise was not added. Examples of simulated projections with different exposure levels are shown in Fig. 3.
Figure 3.

XCAT projections simulated with different exposure levels. The number under each subfigure shows the simulated incident photon counts for each pixel. The of Gaussian noise (Eq. (9)) was set to 10. For the noise‐free scenario, the Gaussian noise was not added.
2.E. Experimental evaluation using the porcine data
In addition to the XCAT study, we used experimentally acquired porcine myocardial perfusion imaging data to further evaluate the efficacy of the ADRIC algorithm. The porcine data acquisition was originally conducted for an unrelated study at the Tianjin Medical University General Hospital (Tianjin, China) and approved by the hospital animal care committee. As our animal study is a retrospective study using porcine images that are already available, it is exempt from the approval by the institutional animal care and use committee.
The porcine data were acquired using a 64‐slice GE Discovery CT750 HD scanner (GE Healthcare, Waukesha, Wisconsin). An initial prior CT volume of the pig was acquired using 120 kV peak energy, 100 mA tube current, and 0.4 s gantry rotation time. The CT was centered on the 75% R‐R phase of the cardiac cycle through electrocardiography (ECG) gating. Similar to the initial prior CT acquisition, a new CT of the 75% R‐R phase was later acquired on the same day with the same scanner following injection of an iodinated contrast agent. The new CT volume was acquired using 120 kV peak energy, 15 mA tube current, and 0.4 s gantry rotation time to reduce imaging dose. The difference in acquisition time and the administration of contrast agent introduced both spatial misalignments and non‐deformation‐induced voxel intensity changes between the initial prior CT and the new CT. Both CT volumes were acquired with a resolution of 0.6 mm * 0.6 mm * 5 mm. They were then both resampled to voxels, with each voxel measuring .
Similar to the XCAT study, limited‐view cone‐beam projections were simulated using the new CT volume and spread across a 360° scan angle. The projections were simulated to contain 300 * 100 pixels, with each pixel measuring . Different sparseness levels were evaluated with total numbers of simulated projections ranging from 10, 20, 40, to 60. As the CT image acquisition inherently contained noise and the new CT acquisition used a lower mA that added extra noise, no additional noise was introduced into the projections of the porcine study.
2.F. Experimental evaluation using a physical phantom
In addition to the XCAT and the porcine studies, we further evaluated the accuracy of ADRIC using acquired projections of a physical anthropomorphic lung phantom (Radiology Support Devices, Long Beach, CA, USA). In general, we inserted water‐filled balloons with different volumes and concentrations of iodinated contrasts into a cavity of the lung phantom, to create different scenarios that simulate both deformations (by balloon shape/volume differences) and intensity changes (by different concentrations of the iodinated contrast) for ADRIC reconstruction.
In detail, a balloon filled only with water was first inserted into the phantom, and scanned by the on‐board imager of a Varian LINAC (TrueBeam, Varian Medical Systems, Palo Alto, CA, USA) to obtain cone‐beam projections covering a whole 200° scan angle. The projections were subsequently reconstructed by the ART‐TV algorithm14 to serve as the initial prior image for ADRIC reconstruction. Based on this prior scenario, we added water into the balloon to change its shape/volume and added iodinated contrast to increase its intensity. A total of four different scenarios were created, including one scenario with only additional water and three scenarios with additional water and iodinated contrasts (three different levels). The contrast concentration increases gradually from level 1 to 3. For each scenario, we acquired 201 cone‐beam projections covering a whole 200° scan angle with 1° angular spacing. The reconstructed images by ART‐TV using the full projection sets were used as the “gold‐standard” for reference. We then down‐sampled the full projection sets by a factor of 10 to 21 projections, and used ADRIC to reconstruct CT images for each scenario. The ADRIC‐solved deformations and intensity changes were then evaluated against the “gold‐standard” CTs reconstructed from the full projection sets.
2.G. Evaluation metrics
Visual and quantitative comparisons were performed between the reconstructed CT volumes and the “gold‐standard” CT volumes. For the XCAT study, the “gold‐standard” volume was the simulated new CT volume. For the porcine study, the “gold‐standard” volume was the newly acquired CT volume. The quantitative comparisons used the relative error (RE) metric defined in Eq. (10) and the universal quality index (UQI)44 metric defined in Eq. (11):
| (10) |
| (11) |
denotes the voxel‐wise attenuation coefficient of the reconstructed volume and denotes the voxel‐wise attenuation coefficient of the “gold‐standard” volume. The symbol denotes the covariance calculator and the symbol denotes the variance calculator. The RE metric was calculated on the whole 3D image. It reflected the overall voxel value difference, which can measure the intensity distribution similarity of two images as a whole. The UQI metric was calculated on three 2D regions of interests (ROIs). The three ROIs are in axial, coronal, and sagittal views, respectively. UQI compared the luminance, contrast, and correlation (structure similarity) between two images, with the optimal value being 1. However, the UQI value is dependent on the selected ROI and the sliding window used for calculation.44 In this study, we selected the ROIs to cover contrast‐enhanced chest regions to evaluate the accuracy of solved deformation and intensity change. We set the sliding window to 20 for all the calculations for consistency and fair comparison. To evaluate the efficacy and advantages of the ADRIC technique more comprehensively, reconstructions were also performed using the standard 2D‐3D deformation technique and the ART‐dTV technique individually. The reconstruction accuracy of the three techniques was compared.
For the physical phantom measurement study, we contoured the balloon volume out from each image, and evaluated the shape/volume similarity using the DICE coefficient:45
| (12) |
The symbol denotes the prior balloon volume or the deformed balloon volume. The symbol denotes the “gold‐standard” balloon volume contoured from the “gold‐standard” reference image. The DICE coefficient ranges from 0 to 1, with a higher value indicating better volume match. By the DICE coefficient we can evaluate the accuracy of ADRIC deformation recovery. In addition, we calculated the average attenuation coefficient within the contoured balloon volume on each image, and defined the intensity difference metric as:
| (13) |
The symbol denotes the average attenuation coefficient calculated within the “gold‐standard” balloon volume. The symbol denotes the average attenuation coefficient calculated within the balloon contour on the initial prior image or the ADRIC image. The intensity difference metric evaluates the accuracy of ADRIC intensity correction.
3. Results
3.A. Simulation using the XCAT phantom
Figure 4 shows the projection data fidelity error versus iteration number for the three reconstruction techniques. Among the three methods, the ADRIC technique converged fast with the smallest data fidelity error. According to the definition of data fidelity error in Eq. (3), the smallest data fidelity error will correspond to the most accurately reconstructed CT image.
Figure 4.
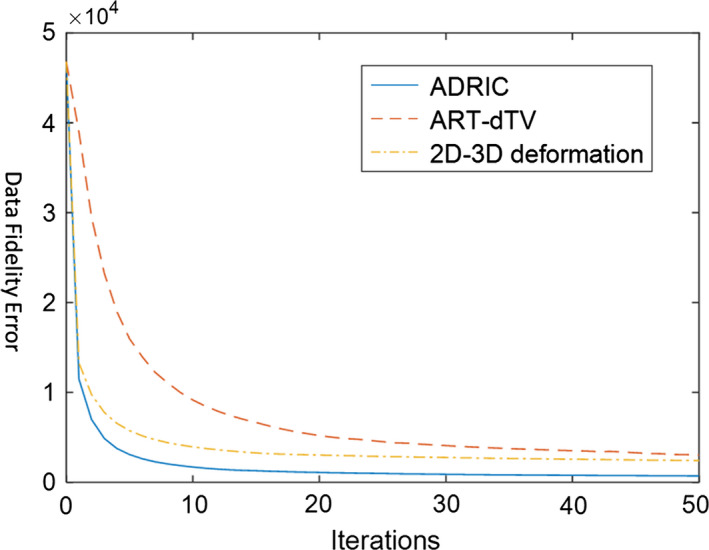
XCAT study: projection data fidelity errors (defined as the objective function in Eq. (3)) after different numbers of iterations, for different reconstruction methods. The reconstruction used 10 projections simulated with incident photon counts (Eq. (9)) for each pixel. [Color figure can be viewed at wileyonlinelibrary.com]
Figure 5 shows the ADRIC deformation‐recovered CT volume by the composite DVF (Eq. (8)) accumulated after different numbers of iterations. Most of the major deformations were solved in the first 10 iterations, with fine adjustments observed between the 10th iteration and the 50th iteration.
Figure 5.
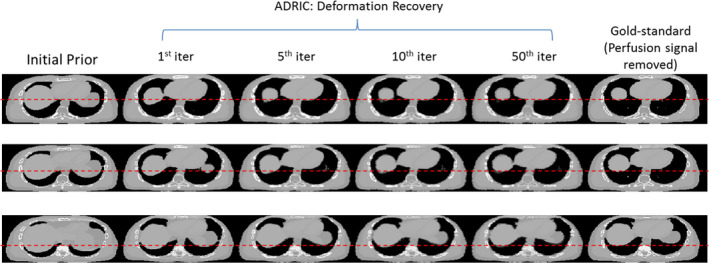
XCAT study: evolution of the ADRIC deformation‐recovered CT volume (μ comp‐DR ) with different iteration numbers. The reconstruction used 40 projections simulated with 105 incident photon counts for each pixel. The first column displays the axial slice cuts of the initial prior CT volume . The four columns in the middle show the axial slice cuts of the ADRIC deformation‐recovered CT volume after 1st, 5th, 10th, and 50th iterations, respectively. The last column displays the axial slice cuts of the “gold‐standard” new CT volume (note that the perfusion signal was removed from the images to facilitate comparisons). Different rows display axial slice cuts at different locations. The display window is [0.015, 0.05] mm−1. [Color figure can be viewed at wileyonlinelibrary.com]
Figure 6 shows a comparison between the initial prior CT volume (column 1), the “gold‐standard” new CT volume (column 2), and the ADRIC‐reconstructed CT volume (column 3) for the XCAT simulation study. The ADRIC‐reconstructed CT was also separated into two components—the ADRIC deformation‐recovered CT volume (column 4), and the intensity correction (column 5) besides the deformation recovery. The ADRIC deformation‐recovered CT volume matched the “gold‐standard” CT volume in regions deformed by respiratory motion and cardiac motion, as compared to the prior CT volume. The ADRIC intensity correction, on the other hand, was mostly confined to the cardiac region to correct the non‐deformation‐induced voxel intensity changes, although additional corrections were observed along structure boundaries and the bony regions.
Figure 6.

XCAT study: three‐view slice cuts of the initial prior CT volume, the “gold‐standard” new CT volume, the ADRIC‐reconstructed CT volume, the ADRIC deformation‐recovered CT volume (the final μ comp‐DR ), and the ADRIC intensity correction besides deformation recovery. The reconstruction used 40 projections simulated with 105 incident photon counts for each pixel. The display window for the initial prior CT volume, the “gold‐standard” new CT volume, the ADRIC‐reconstructed CT volume, and the ADRIC deformation‐recovered CT volume is [0.015, 0.05] mm−1. The display window for the ADRIC intensity correction is [−0.015, 0.015] mm−1. The dashed line was added to indicate the deformation from the initial prior image to the gold‐standard image. The boxes shown in the axial, coronal, and sagittal views of the “gold‐standard” new CT volume indicate the three ROIs used for UQI calculation and comparison. [Color figure can be viewed at wileyonlinelibrary.com]
As shown in Fig. 7, the ART‐dTV, the 2D‐3D deformation, and the ADRIC techniques successfully reconstructed CT volumes to better match with the “gold‐standard” new CT volume, as compared to the initial prior CT volume. However, the ART‐dTV technique failed to correct multiple remaining intensity mismatches (indicated by the arrows in the ART‐dTV column) caused by the deformation from the initial prior CT volume to the new CT volume. The 2D‐3D deformation technique successfully corrected major deformation‐induced mismatches. However, the non‐deformation‐induced voxel intensity changes in the cardiac region were not corrected (indicated by the arrow in the 2D‐3D deformation column: coronal view). There also existed intensity mismatches due to incorrect deformation fields (indicated by the arrows in the 2D‐3D deformation column: axial view and sagittal view). In comparison, the ADRIC technique not only corrected deformation‐induced mismatches but also corrected non‐deformation‐induced voxel intensity changes in the cardiac region.
Figure 7.
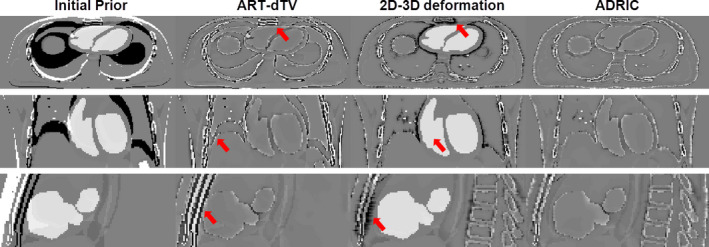
XCAT study: three‐view slice cuts of the difference images between the “gold‐standard” new CT volume and the initial prior CT/reconstructed CT volumes. The reconstruction used 40 projections simulated with 105 incident photon counts for each pixel. The first column shows the difference images between the “gold‐standard” new CT volume and the initial prior CT volume. The second, third, and fourth columns show the difference images between the “gold‐standard” new CT volume and the CT volumes reconstructed by the ART‐dTV, the 2D‐3D deformation, and the ADRIC techniques, respectively. The display window is [−0.015, 0.015] mm−1. [Color figure can be viewed at wileyonlinelibrary.com]
Table 1 shows reconstruction results using different levels of angular sampling sparseness for the XCAT study. As expected, increasing the number of acquired projections led to better reconstruction accuracy. The ADRIC technique consistently generated the smallest RE and the highest UQI values among the three techniques, showing the highest reconstruction accuracy.
Table 1.
XCAT study: RE and UQI values of different reconstruction techniques using different levels of angular sampling sparseness (varied by numbers of projections). The projections were simulated with 105 incident photon counts for each pixel. The “Initial Prior” column shows the RE and UQIs between the “gold‐standard” new CT volume and the initial prior CT volume. Other columns show the RE and UQI values between the “gold‐standard” new CT volume and the CT volumes reconstructed by different techniques. The UQI values were calculated based on the three 2D ROIs enclosed in the boxes of Fig. 6, evaluating axial, coronal, and sagittal views, respectively
| No. of projections | Initial prior | ART‐dTV | 2D‐3D Deformation | ADRIC |
|---|---|---|---|---|
| RE | ||||
| 10 | 39.75% | 25.45% | 18.85% | 17.32% |
| 20 | 19.21% | 14.64% | 11.90% | |
| 40 | 13.38% | 12.80% | 9.06% | |
| 60 | 11.04% | 12.33% | 7.92% | |
| UQI (axial ROI/coronal ROI/sagittal ROI) | ||||
| 10 | 0.15/ 0.13/ −0.09 | 0.54/ 0.65/ 0.44 | 0.34/ 0.32/ −0.04 | 0.62/ 0.68/ 0.66 |
| 20 | 0.75/ 0.79/ 0.71 | 0.37/ 0.31/ 0.03 | 0.82/ 0.84/ 0.83 | |
| 40 | 0.90/ 0.92/ 0.85 | 0.38/ 0.31/ 0.04 | 0.93/ 0.93/ 0.92 | |
| 60 | 0.93/ 0.95/ 0.87 | 0.38/ 0.31/ 0.03 | 0.95/ 0.96/ 0.93 | |
As shown in Fig. 8, the ADRIC‐reconstructed image by using 40 projections matches well with the “gold‐standard” image, which corresponds to a RE value of 9.06% and UQIs of 0.93/0.93/0.92 (Table 1). Reducing the projection number yields images of more blurred contrast‐enhancement area, especially for the case that used 10 projections for reconstruction.
Figure 8.
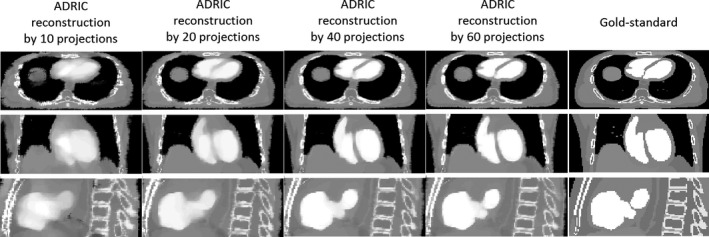
Visual comparison between reconstructed ADRIC images (by using different numbers of projections) and the “gold‐standard” image for the XCAT study. The projections used for reconstruction were simulated with 105 incident photon counts for each pixel.
Table 2 reports the XCAT reconstruction results using projections with different exposure levels. The ADRIC technique consistently outperformed the ART‐dTV and the 2D‐3D deformation techniques for all exposure levels. The reconstruction accuracy of the ADRIC technique was only slightly reduced when the exposure decreased, except for the incident photon counts case where the simulated projections were much noisier than real clinical projections (Fig. 3).
Table 2.
XCAT study: RE and UQI values of different reconstruction techniques with different exposure levels (varied by simulated incident photon counts for each pixel). Forty projections were used for reconstruction. The “Initial Prior” column shows the RE and UQIs between the “gold‐standard” new CT volume and the initial prior CT volume. Other columns show the RE and UQI values between the “gold‐standard” new CT volume and the CT volumes reconstructed by different techniques. The UQI values were calculated based on the three 2D ROIs enclosed in the boxes of Fig. 6, evaluating axial, coronal, and sagittal views, respectively
| Incident photon counts | Initial prior | ART‐dTV | 2D‐3D Deformation | ADRIC |
|---|---|---|---|---|
| RE | ||||
| 104 | 39.75% | 17.25% | 14.88% | 13.47% |
| 5 × 10⁴ | 13.71% | 13.03% | 9.50% | |
| 105 | 13.38% | 12.80% | 9.06% | |
| ∞ (Noise‐free) | 13.63% | 12.66% | 8.31% | |
| UQI (axial ROI/coronal ROI/sagittal ROI) | ||||
| 104 | 0.15/ 0.13/ −0.09 | 0.85/ 0.85/ 0.76 | 0.39/ 0.30/ 0.04 | 0.87/ 0.86/ 0.84 |
| 5 × 10⁴ | 0.90/ 0.92/ 0.84 | 0.38/ 0.31/ 0.04 | 0.92/ 0.93/ 0.91 | |
| 105 | 0.90/ 0.92/ 0.85 | 0.38/ 0.31/ 0.04 | 0.93/ 0.93/ 0.92 | |
| ∞ (Noise‐free) | 0.90/ 0.92/ 0.84 | 0.38/ 0.31/ 0.04 | 0.94/ 0.95/ 0.93 | |
3.B. Experimental evaluation using the porcine data
Figure 9 shows the ADRIC deformation‐recovered CT volume (column 4) and the ADRIC intensity correction (column 5) for the porcine study. Similar to the XCAT study, the ADRIC successfully recovered the deformation and corrected the intensity changes induced by the transit of the myocardial contrast agent. Using more projections for reconstruction revealed more fine details in the intensity correction image [Fig. 9(a) vs. Fig. 9(b)].
Figure 9.
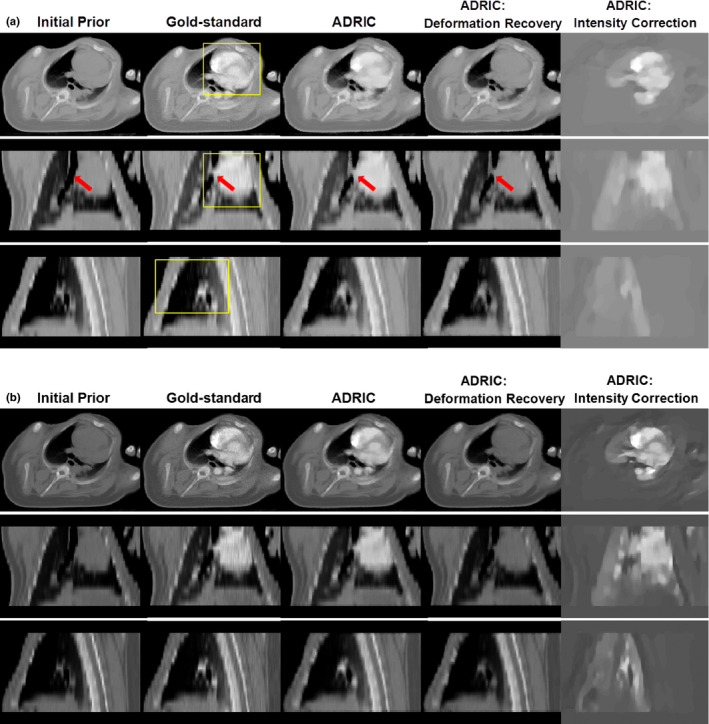
Porcine study: three‐view slice cuts of the initial prior CT volume, the “gold‐standard” new CT volume, the ADRIC‐reconstructed CT volume, the ADRIC deformation‐recovered CT volume, and the ADRIC intensity correction besides deformation recovery. The reconstruction used 20 projections for (A) and 60 projections for (B). The display window for the initial prior CT volume, the “gold‐standard” new CT volume, the ADRIC‐reconstructed CT volume, and the ADRIC deformation‐recovered CT volume is [0.015, 0.05] mm−1. The display window for the ADRIC intensity correction is [−0.015, 0.015] mm−1. The boxes shown in the axial, coronal, and sagittal views of the “gold‐standard” new CT volume indicate the three ROIs used for UQI calculation and comparison. [Color figure can be viewed at wileyonlinelibrary.com]
The difference image evaluation in Fig. 10 also shows that the ADRIC technique achieved the best reconstruction accuracy among the three techniques.
Figure 10.
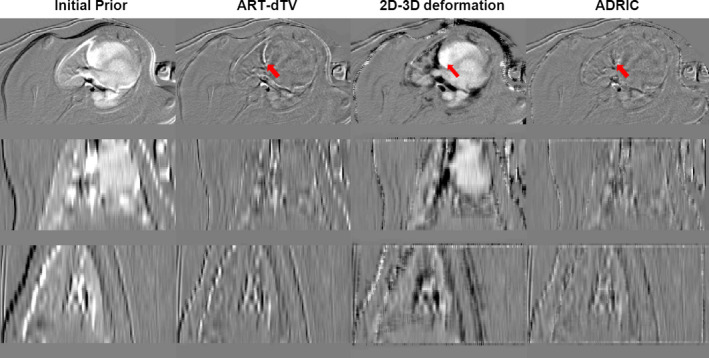
Porcine study: three‐view slice cuts of the difference images between the “gold‐standard” new CT volume and the initial prior CT/reconstructed CT volumes. The reconstruction used 20 projections. The first column shows the difference images between the “gold‐standard” new CT volume and the initial prior CT volume. The second, third, and fourth columns show the difference images between the “gold‐standard” new CT volume and the CT volumes reconstructed by the ART‐dTV, the 2D‐3D deformation, and the ADRIC techniques, respectively. The display window is [−0.015, 0.015] mm−1. [Color figure can be viewed at wileyonlinelibrary.com]
Table 3 shows the reconstruction results for the porcine study, by using different sparsity levels of projection view sampling. The ADRIC technique consistently outperformed the other two techniques in offering the lowest RE values and the highest UQI values, demonstrating the highest reconstruction accuracy. Note that for the porcine study, the deformation between the initial prior CT volume and the new CT volume was less significant as compared to the XCAT study (Fig. 7 vs. Fig. 10), which led to smaller differences between the ART‐dTV and the ADRIC results.
Table 3.
Porcine study: RE and UQI values of different reconstruction techniques with different levels of angular sampling sparseness (varied by numbers of projections). The “Initial Prior” column shows the RE and UQIs between the “gold‐standard” new CT volume and the initial prior CT volume. Other columns show the RE and UQI values between the “gold‐standard” new CT volume and the CT volumes reconstructed by different techniques. The UQI values were calculated based on the three 2D ROIs enclosed in the boxes of Fig. 9(a), evaluating axial, coronal, and sagittal views, respectively
| No. of projections | Initial prior | ART‐dTV | 2D‐3D Deformation | ADRIC |
|---|---|---|---|---|
| RE | ||||
| 10 | 15.66% | 10.70% | 14.91% | 8.98% |
| 20 | 8.78% | 13.61% | 6.80% | |
| 40 | 7.97% | 12.58% | 5.82% | |
| 60 | 6.91% | 12.14% | 5.29% | |
| UQI (axial ROI/coronal ROI/sagittal ROI) | ||||
| 10 | 0.37/ 0.65/ 0.69 | 0.65/ 0.78/ 0.78 | 0.13/ 0.39/ 0.69 | 0.68/ 0.82/ 0.84 |
| 20 | 0.82/ 0.90/ 0.86 | 0.19/ 0.47/ 0.78 | 0.84/ 0.91/ 0.91 | |
| 40 | 0.88/ 0.92/ 0.90 | 0.24/ 0.49/ 0.85 | 0.90/ 0.94/ 0.95 | |
| 60 | 0.91/ 0.95/ 0.94 | 0.25/ 0.50/ 0.85 | 0.93/ 0.96/ 0.96 | |
As shown in Fig. 11, the ADRIC‐reconstructed image by using 40 projections matches well with the “gold‐standard” image, which corresponds to a RE of 5.82% and UQIs of 0.90/0.94/0.95 (Table 3).
Figure 11.
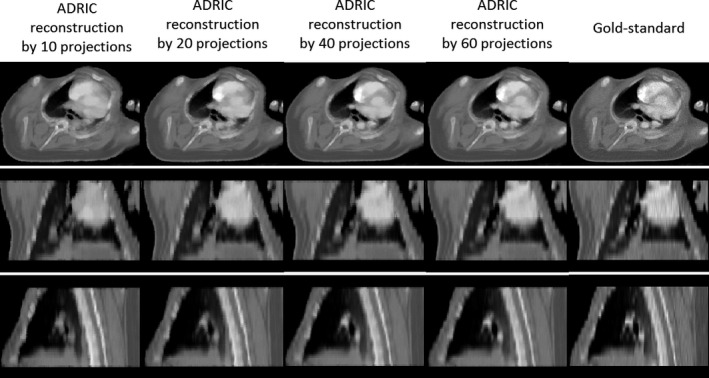
Visual comparison between reconstructed ADRIC images (by using different numbers of projections) and the “gold‐standard” image for the porcine study.
3.C. Experimental evaluation using the physical phantom
The reconstructed images for two scenarios were shown in Fig. 12. For Fig. 12(a), only deformation existed between the water‐filled balloons in the prior and the new images. For Fig. 12(b), both deformation and non‐deformation‐induced intensity changes (from added iodinated contrast) existed between the balloons in the prior and the new images. As shown, the deformations were successfully recovered for both scenarios by ADRIC. The non‐deformation‐induced intensity changes from the added iodinated contrast were also successfully solved by intensity correction in Fig. 12(b). Note that the ADRIC balloon boundary in Fig. 12(a) appears fuzzier than the ground‐truth, which is caused by a combined effect of the sparse‐view sampling and the smoothing/regularization from the deformation model.
Figure 12.
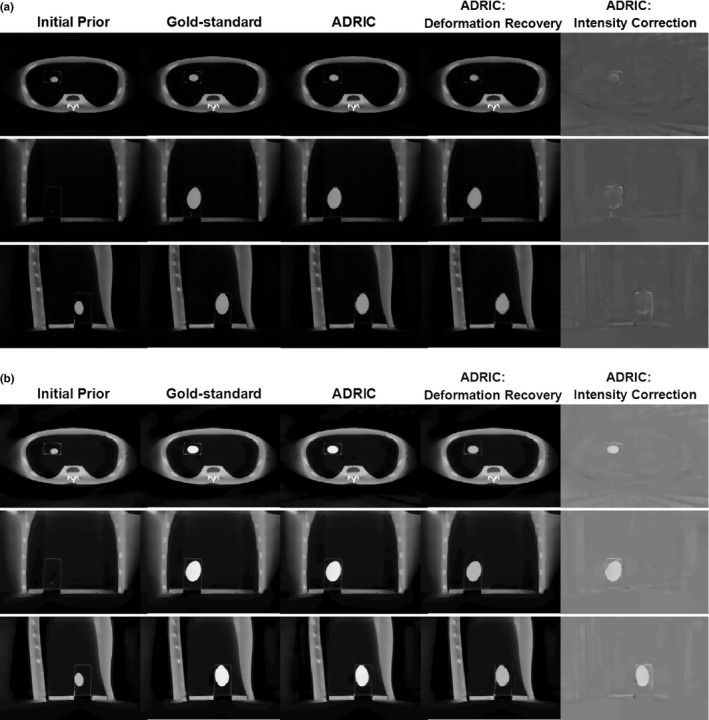
Physical phantom study: three‐view slice cuts of the initial prior CT volume, the “gold‐standard” new CT volume, the ADRIC‐reconstructed CT volume, the ADRIC deformation‐recovered CT volume, and the ADRIC intensity correction besides deformation recovery. The ADRIC reconstruction used 21 projections. The display window for the initial prior CT volume, the “gold‐standard” new CT volume, the ADRIC‐reconstructed CT volume, and the ADRIC deformation‐recovered CT volume is [0, 0.04] mm−1. The display window for the ADRIC intensity correction is [−0.015, 0.015] mm−1. For subfigure (a), more water was added to the balloon in the new image without adding iodinated contrast. For subfigure (b), both water and iodinated contrast were added to the balloon in the new image to introduce both deformation and non‐deformation‐induced intensity changes.
Table 4 shows the DICE coefficients and the intensity differences for both the initial prior balloon volume and the ADRIC‐reconstructed balloon volumes. As shown, ADRIC substantially improves the accuracy of the balloon volumes in the reconstructed image, for both the deformation (DICE coefficient) and the intensity correction (intensity difference).
Table 4.
Physical phantom study: DICE coefficients and intensity difference values for the four different scenarios described in 2.F. The “Initial Prior” section shows the DICE coefficients and the intensity differences between the “gold‐standard” new balloon volumes and the initial prior balloon volume. The “ADRIC” section shows the DICE coefficients and the intensity differences between the “gold‐standard” new balloon volumes and the balloon volumes reconstructed by the ADRIC technique
| Similarity metric | Without contrast | With contrast level 1 | With contrast level 2 | With contrast level 3 |
|---|---|---|---|---|
| Initial prior | ||||
| DICE coefficient | 0.421 | 0.411 | 0.509 | 0.497 |
| Intensity difference | 8.87% | 32.16% | 47.86% | 63.76% |
| ADRIC | ||||
| DICE coefficient | 0.951 | 0.966 | 0.945 | 0.955 |
| Intensity difference | 4.09% | 5.40% | 9.53% | 9.11% |
4. Discussion
4.A. Comparison among the ART‐dTV, the 2D‐3D deformation, and the ADRIC techniques
The ADRIC technique developed in this study outperformed both the ART‐dTV and the 2D‐3D deformation techniques, as evidenced by the XCAT simulation study (Fig. 7 and Tables 1 and 2) and the experimental porcine study (Fig. 10 and Table 3). Among the three techniques, the 2D‐3D deformation technique could only recover the deformation. The residual non‐deformation‐induced voxel intensity mismatches were not only uncorrected but also provided false signals that affected the accuracy of the solved DVFs (Figs. 7 and 10). A more illustrative example is shown in Fig. 13, where the 2D‐3D deformation algorithm deformed the high density bony region (indicated by the arrow) to cover the mismatches caused by the contrast agent. Such inadequate deformation not only failed to recover the true new CT intensities but also generated a DVF deviated from the truth. The application of this DVF for further clinical practices, including structure contour propagation and dose tracking/accumulation, would be error‐prone. The same issue applied to other variants of 2D‐3D deformation‐based techniques21, 22, 23, 24, 25, 26, 27, 28, 29, 31 as well.
Figure 13.
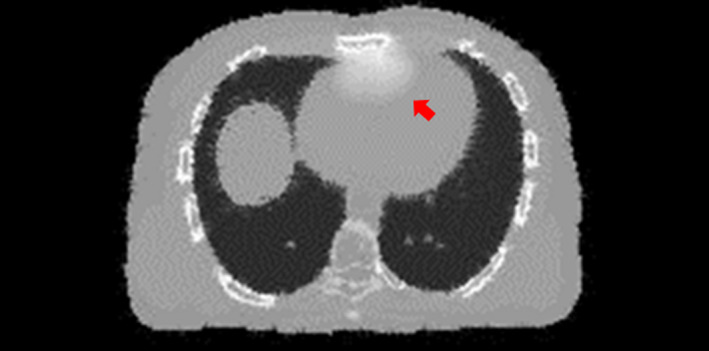
An axial slice cut of the CT volume reconstructed by the 2D‐3D deformation technique. The arrow points to an area where the bony structures were inadequately deformed to compensate for the voxel intensity mismatches caused by transit of the simulated iodinated contrast agent. [Color figure can be viewed at wileyonlinelibrary.com]
In contrast to the 2D‐3D deformation technique, the ART‐dTV technique viewed all voxel variations as intensity changes and did not explicitly consider the deformation that occurred in between the prior and new CT volumes. These pure intensity‐correction‐based reconstruction techniques12, 13, 15 thus cannot recover the DVF during the reconstruction. Although a subsequent 3D‐3D deformable registration can still be performed to solve the DVF, its accuracy can be potentially affected by the artifacts presented in the reconstructed image and mixed deformation‐induced and non‐deformation‐induced intensity variations. The dPIRPLE algorithm is an advanced technique different from the traditional 3D image reconstruction + 3D‐3D registration approach, as dPIRPLE also alternates between the image reconstruction and deformable registration steps, which gradually improves the reconstructed image's quality to help fine‐tune the deformation results. However, as being mentioned in the introduction, dPIRPLE always uses the same uncorrected prior to register to the reconstructed image. The non‐deformation‐induced intensity variations on the reconstructed image may introduce false signals that affect the accuracy of the resulting DVFs. In contrast, ADRIC adaptively updates the prior image to include these non‐deformation intensity variations to reduce their effects on the accuracy of deformable registration.
In this study, the ART‐dTV technique regularized the “dTV” instead of the traditional TV on the difference image between the initial prior CT volume and the new CT volume. This approach better preserved image features and fine structures that could be easily smoothed out during large‐scale TV regularization. However, when complex anatomical variations including deformation exist between initial prior and new CT images, the difference image may not be sufficiently sparse in terms of the intensity gradient. The TV regularization will smooth out the difference and blend the information from the initial prior CT image into the new CT image, leading to intensity mismatches (Figs. 7 and 10). Under this circumstance, deformation‐based correction became critical to correct the initial prior volume.
In contrast to the ART‐dTV and the 2D‐3D deformation techniques, the ADRIC technique successfully recovered deformation and corrected non‐deformation‐induced voxel intensity changes (Figs. 5, 6, 9, and 12). The deformation recovery component of ADRIC is unique from two features: first, it uses 2D‐3D deformation to directly compute the DVF by matching 2D projections. Compared with the traditional 3D‐3D deformation approach, which needs to reconstruct the projections to a 3D volume before registration, the 2D‐3D deformation approach is potentially less prone to the errors and artifacts originate from image reconstruction. It is also less affected by the errors associated with registering two 3D images of apparently different quality, i.e., the high‐quality prior image and the low‐quality new image reconstructed from limited‐view projections. Second, the DVF solved by ADRIC is cumulatively updated throughout the iterations to achieve higher accuracy. With the non‐deformation‐induced voxel intensity changes being gradually corrected, the cumulative DVF was simultaneously updated (Fig. 5) to correct its errors caused by the false signals from these intensity changes (Figs. 7 and 10). The intensity correction component of ADRIC, on the other hand, adopts the dTV approach to preserve the deformation recovery information, while at the same time regularizing the intensity correction signal and removing the intensity corrections applied toward deformation‐induced voxel changes.
Note that in this study, the intensity correction images solved by ADRIC for the XCAT study (Fig. 6) look patchy and piecewise constant. It is due to the inherent piecewise‐constant feature of the XCAT phantom, which is a simplified model of the human anatomy. For the porcine study, the intensity correction image looks patchy by using only 20 projections for reconstruction [Fig. 9(a)]. Increasing the number of projections to 60 introduces more fine details to the intensity correction image [Fig. 9(b)]. The patchiness of the intensity correction image in the coronal and sagittal views for the porcine study is also contributed by the low resolution in the slice‐to‐slice direction (5 mm) from the original image. Although we up‐sampled the original CT volumes to a 1.2 mm plane‐to‐plane resolution by interpolation, the image appearance is still patchy, as being limited by its natural resolution. Note that for the porcine study, the reference image used as “gold‐standard” was acquired with a reduced tube current (15 mA) as compared to the prior image (100 mA). The reconstructed images by ADRIC thus appear less noisy as compared to the “gold‐standard” image (Fig. 9).
In this study, we majorly focused on evaluating the reconstruction accuracy from projections acquired under different sparse‐view sampling scenarios. The sparse‐view reconstruction is most adequate for reconstructing projections binned from retrospective/prospective gating, especially for scenarios where the gantry rotation speed is limited in applications like cone‐beam CT used in radiotherapy,46 or cone‐beam C‐arm interventional x‐ray systems.47 In other scenarios, the dose reduction may be better achieved by using normal view sampling and reduced dose per projection. Our results shown in Table 1 (different sparsity levels of projection view sampling) versus Table 2 (different levels of dose per projection with the same projection view sampling) also suggest that the latter will be a better strategy when applicable, which generates more accurate reconstruction results. However, for this study, the two scenarios we investigated (heart: XCAT study and porcine study; lung: physical phantom study) are associated with anatomical sites both usually involve periodic motion, where phase gating/sorting is desired to reconstruct images with motion blurriness suppressed. The reconstructions are also based on cone‐beam projections, the acquisition of which may often be limited by the gantry rotation speed in current clinical practice. Thus, the sparse‐view reconstruction has its merit in the ADRIC application for these two scenarios. The ADRIC reconstruction, however, is not limited to the sparse‐view reconstruction. It is also readily applicable to reconstructions using projections of normal view sampling but low dose per projection (Table 2), which is a better dose reduction strategy than sparse‐view sampling.
4.B. Clinical applications of the ADRIC technique
Our newly developed ADRIC method can separate deformation from non‐deformation‐induced voxel intensity changes between sequential CT images, which may potentially benefit multiple clinical practices. The derived DVF can be used toward many clinical applications, including structure contour propagation, organ motion analysis, and disease progression monitoring. In addition, in CT myocardial perfusion imaging, the intensity corrections can be correlated with the transit of iodinated contrast agents to evaluate cardiac functions. For other imaging scenarios, intensity corrections can be correlated with case‐specific anatomical and physiological changes, including tissue inflammation, calcification, and fibrosis, to perform treatment outcome and side‐effect analysis.
Another promising application of the ADRIC algorithm is in radiation therapy. Cone‐beam CT imaging has become a routine image‐guidance tool in today's radiation therapy practice. High‐quality cone‐beam CT imaging in radiation therapy not only facilitates accurate tumor localization48 for patient setup correction but also enables treatment dose calculation,49 dose tracking,50 and adaptive radiation therapy.51 The DVF derived between prior and new cone‐beam CT volumes, on the other hand, could be used for fast tumor tracking, fast structure recontouring, and dose accumulation, which are all core components that facilitate adaptive radiation therapy.
4.C. Limitations of the current ADRIC technique
The developed ADRIC technique achieved encouraging results in the XCAT simulation study, the porcine study, and the physical phantom measurement study. Nonetheless, future investigations are warranted for further improvement. One remaining issue of the current ADRIC technique is that the solved intensity corrections may not be fully confined to the voxels with non‐deformation‐induced intensity changes (Figs. 6 and 12). In Fig. 6, the intensity correction signals not only appeared in the heart region but also along some structure boundaries, especially around the bony region. In Fig. 12, the intensity correction signals appeared along the phantom cavity edge, in addition to the balloon region. These additional corrections were introduced to compensate for the inaccuracy occurred in 2D‐3D deformation. Inaccurate deformation, especially around the bony regions or structure boundaries with sharp intensity gradients, has been widely observed in the reconstructed images of different 2D‐3D deformation‐based techniques.27, 28 The discrepancy is introduced by three factors:
The deformation energy penalty (smoothness regularization) enforced on the DVFs (Eq. (4)) usually does not apply to structure boundaries, where sliding motion prevails.52, 53
In this study, the deformation of images was performed by trilinear interpolation, which has limited accuracy. Interpolation inaccuracy in high gradient regions like bony areas and structure boundaries may result in significant voxel intensity mismatches.
The intensity‐driven 2D‐3D deformation model is potentially limited in accuracy, as it fails to consider the biomechanical properties of different tissues,54 including elasticity differences between soft tissues and bones.
To further verify the potential sources of the deformation error, we directly registered the XCAT initial prior CT volume to the XCAT “gold‐standard” new CT volume using the Demons registration algorithm. The difference image between the “gold‐standard” new CT volume and the deformed CT volume was computed and is shown in Fig. 14. Similarly, prominent residual differences were observed around the boundaries and bony areas (the residual intensity difference in the heart region was due to contrast agent). The intensity‐based Demons registration algorithm41 applies a similar global DVF smoothing regime (whole‐field Gaussian smoothing without considering regional differences like the sliding motion and the rigidity variation) as our 2D‐3D deformation technique. It also uses the trilinear interpolation for image deformation. The similar results (Figs. 6 and 14) further suggest the deformation model as the origin of inaccuracies.
Figure 14.
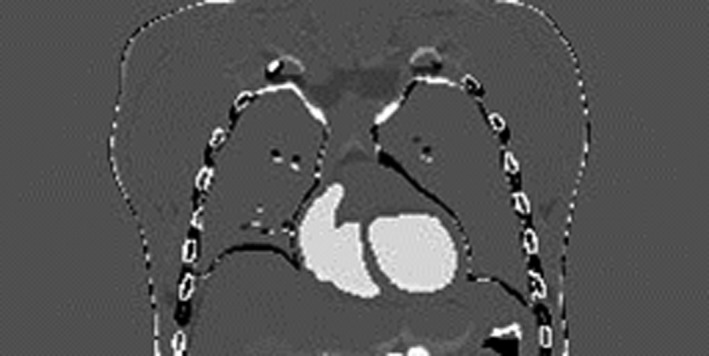
Difference image between the XCAT “gold‐standard” new CT volume and the deformed CT volume using the Demons registration algorithm.
Although the inaccurate deformation of the structure boundaries and the bony regions was partially compensated by ADRIC intensity correction to generate a better final image (Fig. 6), it affected the interpretations of the intensity correction signals, which were not expected in these regions. To confine the intensity correction to voxels with true non‐deformation‐induced intensity changes, we can introduce a region‐based mask into the ART update step to avoid updating voxel values outside the regions of potential non‐deformation intensity changes. Postprocessing techniques including the removal of the ADRIC intensity correction in these regions can also be helpful. However, both methods should be implemented cautiously to avoid removing true intensity correction signals. Therefore, improving the accuracy of the 2D‐3D deformation algorithm may fundamentally solve the problem through: (a) applying patch‐based smoothness regularization to better fit the sliding motion; (b) applying a more accurate voxel interpolation model to avoid mismatches in high gradient boundaries; (c) applying biomechanical deformation models like those based on finite‐element analysis30, 55 to obtain a better, more realistic deformation field. Future studies will be conducted to explore these options to further improve the accuracy of the ADRIC algorithm.
4.D. Future prospects
In this study, the efficacy of the ADRIC technique was evaluated using simulated XCAT phantom data, acquired porcine data, and acquired lung phantom data. For the XCAT and the porcine studies, the myocardial perfusion scenarios under investigation served as good examples combining both deformation and non‐deformation‐induced voxel intensity changes. The physical lung phantom study simulates a lung case with both deformation and intensity changes. Although only presenting a simplified scenario featuring an isolated, uniform, and high‐contrast object with local deformation. The efficacy of the ADRIC technique needs to be further evaluated in future studies with more complicated real patient scenarios, including the follow‐up lung imaging after radiotherapy treatments where lung‐motion‐induced deformation and radiation‐induced tissue inflammation are commonly observed. In addition to reconstructing different clinical scenarios, ADRIC reconstructions of the same clinical scenario but different ranges and degrees of deformation/intensity changes should also be investigated to further evaluate its robustness.
In this study, the scatter and beam‐hardening effects are not simulated in the projections generated for the XCAT CT and porcine CT reconstruction. The prior and new projections of the physical phantom study were both scanned on the same LINAC system, which features similar scatter and beam hardening components that cancel out when calculating the difference. In clinical applications where the prior and new images are acquired at different systems (such as the conventional CT system vs. the LINAC), their intensity level mismatches caused by factors including different scatter ratios, beam energy spectra, and imager lags may affect the accuracy of the deformation recovery in ADRIC. In the current ADRIC implementation, the projection similarity metric used in deformation recovery is based on the sum of squared intensity differences (Eq. (3)). Recently we have developed a 2D‐3D deformation technique that uses normalized cross correlation (NCC) as the similarity metric between the projection sets,29 which is proved more robust to the intensity‐level mismatches. The robustness of the current ADRIC technique and a potential NCC‐based ADRIC technique will be investigated and compared in future when more clinical imaging data become available for evaluation.
In this study, the intensity correction step of ADRIC was implemented through the ART technique. We selected ART as it was easy to incorporate the prior information and fast in convergence speed. Other intensity correction candidates, including the simultaneous algebraic reconstruction technique (SART)11 and the simultaneous iterative reconstruction technique (SIRT),56 will be evaluated in the future for their potentials in further improving the noise feature and image quality.
Currently, the ADRIC reconstruction takes around 2–3 hr for 20–60 projections on a desktop with a 3.6 GHz Intel Core i7‐4790 CPU and an NVIDIA Quadro K4200 GPU. The ADRIC initialization step takes ~1 hr and the ADRIC main framework takes 1–2 hr. The 2D‐3D deformation step and the ART‐dTV step both take ~ 1 min for each iteration of ADRIC, which generally converges within 40–60 iterations. Currently we are implementing a GPU‐based parallelization in the Demons registration algorithm, which takes less than 1 min.41 The incorporation of GPU‐based parallel computing in other components, especially the 2D‐3D deformation step,39 is currently in progress and expected to greatly accelerate the computation speed to facilitate clinical applications.
5. Conclusions
An adaptive deformation recovery and intensity correction method was developed in this study. Using limited‐view projections, the ADRIC technique reconstructed new CT volumes through alternating between deforming prior CT volumes and correcting non‐deformation‐induced voxel intensity changes. Myocardial perfusion imaging scenarios using XCAT‐simulated phantom data and experimentally acquired porcine data were evaluated, which validated the efficacy of the ADRIC technique. A physical phantom study was also conducted and validated the accuracy of ADRIC for projections acquired on a real system. Additional patient studies in different clinical scenarios are warranted to further evaluate the ADRIC technique in the future.
Supporting information
Fig. S1: Relative errors of the reconstructed images by using different relaxation factors for the ART update in the ADRIC reconstruction, for both the XCAT data and the porcine data. The relaxation factors used for each data point from left to right are 0.005, 0.01, 0.05, 0.1, and 0.5, correspondingly. The reconstruction uses 40 projections for the XCAT study and 20 projections for the porcine study.
Acknowledgments
The authors would like to thank Dr. Dong Li at the Tianjin Medical University General Hospital for sharing the porcine data. And we would like to thank Dr. Xuejun Gu and Dr. Jun Dang for their help with the implementation of the Demons registration algorithm. The authors would also like to thank Dr. Damiana Chiavolini for editing the article. We would also like to thank Dr. Paul Segars for providing the XCAT digital phantom for simulation.
We acknowledge funding support from the American Cancer Society (RSG‐13‐326‐01‐CCE), US National Institutes of Health (R01 EB020366), and Cancer Prevention and Research Institute of Texas (RP130109).
References
- 1. Rathbun SW, Raskob GE, Whitsett TL. Sensitivity and specificity of helical computed tomography in the diagnosis of pulmonary embolism: A systematic review. Ann Intern Med. 2000;132:227–232. [DOI] [PubMed] [Google Scholar]
- 2. Schneider U, Pedroni E, Lomax A. The calibration of CT Hounsfield units for radiotherapy treatment planning. Phys Med Biol. 1996;41:111–124. [DOI] [PubMed] [Google Scholar]
- 3. Girard EE, Al‐Ahmad A, Rosenberg J, et al. Contrast‐enhanced C‐arm CT evaluation of radiofrequency ablation lesions in the left ventricle. JACC. Cardiovas Imaging. 2011;4:259–268. [DOI] [PMC free article] [PubMed] [Google Scholar]
- 4. Purdie TG, Bissonnette JP, Franks K, et al. Cone‐beam computed tomography for on‐line image guidance of lung stereotactic radiotherapy: Localization, verification, and intrafraction tumor position. Int J Radiat Oncol Biol Phys. 2007;68:243–252. [DOI] [PubMed] [Google Scholar]
- 5. Dromain C, De Baere T, Elias D, et al. Hepatic tumors treated with percutaneous radio‐frequency ablation: CT and MR imaging follow‐up. Radiology. 2002;223:255–262. [DOI] [PubMed] [Google Scholar]
- 6. Hsiao EM, Rybicki FJ, Steigner M. CT coronary angiography: 256‐slice and 320‐detector row scanners. Curr Cardiol Rep. 2010;12:68–75. [DOI] [PMC free article] [PubMed] [Google Scholar]
- 7. Smith‐Bindman R, Lipson J, Marcus R, et al. Radiation dose associated with common computed tomography examinations and the associated lifetime attributable risk of cancer. Arch Intern Med. 2009;169:2078–2086. [DOI] [PMC free article] [PubMed] [Google Scholar]
- 8. Rossi A, Merkus D, Klotz E, Mollet N, De Feyter PJ, Krestin GP. Stress myocardial perfusion: Imaging with multidetector CT. Radiology. 2014;270:25–46. [DOI] [PubMed] [Google Scholar]
- 9. Ziegler A, Kohler T, Proksa R. Noise and resolution in images reconstructed with FBP and OSC algorithms for CT. Med Phys. 2007;34:585–598. [DOI] [PubMed] [Google Scholar]
- 10. Gordon R, Bender R, Herman GT. Algebraic reconstruction techniques (ART) for three‐dimensional electron microscopy and x‐ray photography. J Theor Biol. 1970;29:471–481. [DOI] [PubMed] [Google Scholar]
- 11. Andersen AH, Kak AC. Simultaneous algebraic reconstruction technique (SART): A superior implementation of the art algorithm. Ultrason Imaging. 1984;6:81–94. [DOI] [PubMed] [Google Scholar]
- 12. Sidky EY, Pan X. Image reconstruction in circular cone‐beam computed tomography by constrained, total‐variation minimization. Phys Med Biol. 2008;53:4777–4807. [DOI] [PMC free article] [PubMed] [Google Scholar]
- 13. Chen GH, Tang J, Leng S. Prior image constrained compressed sensing (PICCS): A method to accurately reconstruct dynamic CT images from highly undersampled projection data sets. Med Phys. 2008;35:660–663. [DOI] [PMC free article] [PubMed] [Google Scholar]
- 14. Wang J, Mao W, Solberg T. Scatter correction for cone‐beam computed tomography using moving blocker strips: A preliminary study. Med Phys. 2010;37:5792–5800. [DOI] [PubMed] [Google Scholar]
- 15. Jia X, Tian Z, Lou Y, Sonke JJ, Jiang SB. Four‐dimensional cone beam CT reconstruction and enhancement using a temporal nonlocal means method. Med Phys. 2012;39:5592–5602. [DOI] [PMC free article] [PubMed] [Google Scholar]
- 16. Chen B, Barnhart H, Richard S, Robins M, Colsher J, Samei E. Volumetric quantification of lung nodules in CT with iterative reconstruction (ASiR and MBIR). Med Phys. 2013;40:111902. [DOI] [PubMed] [Google Scholar]
- 17. Stayman JW, Dang H, Ding Y, Siewerdsen JH. PIRPLE: A penalized‐likelihood framework for incorporation of prior images in CT reconstruction. Phys Med Biol. 2013;58:7563–7582. [DOI] [PMC free article] [PubMed] [Google Scholar]
- 18. Chen GH, Li Y. Synchronized multiartifact reduction with tomographic reconstruction (SMART‐RECON): A statistical model based iterative image reconstruction method to eliminate limited‐view artifacts and to mitigate the temporal‐average artifacts in time‐resolved CT. Med Phys. 2015;42:4698–4707. [DOI] [PMC free article] [PubMed] [Google Scholar]
- 19. Jia X, Lou Y, Li R, Song WY, Jiang SB. GPU‐based fast cone beam CT reconstruction from undersampled and noisy projection data via total variation. Med Phys. 2010;37:1757–1760. [DOI] [PubMed] [Google Scholar]
- 20. Niu S, Gao Y, Bian Z, et al. Sparse‐view x‐ray CT reconstruction via total generalized variation regularization. Phys Med Biol. 2014;59:2997–3017. [DOI] [PMC free article] [PubMed] [Google Scholar]
- 21. Docef A, Murphy MJ, Keall P, Siebers J, Williamson J. Forward CT reconstruction from limited projection data. In proceedings of the 19th conference on computer‐assisted radiology and surgery, 2005;104–108.
- 22. Staub D, Docef A, Brock RS, Vaman C, Murphy MJ. 4D Cone‐beam CT reconstruction using a motion model based on principal component analysis. Med Phys. 2011;38:6697–6709. [DOI] [PMC free article] [PubMed] [Google Scholar]
- 23. Brock RS, Docef A, Murphy MJ. Reconstruction of a cone‐beam CT image via forward iterative projection matching. Med Phys. 2010;37:6212–6220. [DOI] [PMC free article] [PubMed] [Google Scholar]
- 24. Zeng R, Fessler JA, Balter JM. Estimating 3‐D respiratory motion from orbiting views by tomographic image registration. IEEE Trans Med Imaging. 2007;26:153–163. [DOI] [PMC free article] [PubMed] [Google Scholar]
- 25. Ren L, Zhang J, Thongphiew D, et al. A novel digital tomosynthesis (DTS) reconstruction method using a deformation field map. Med Phys. 2008;35:3110–3115. [DOI] [PMC free article] [PubMed] [Google Scholar]
- 26. Li R, Jia X, Lewis JH, et al. Real‐time volumetric image reconstruction and 3D tumor localization based on a single x‐ray projection image for lung cancer radiotherapy. Med Phys. 2010;37:2822–2826. [DOI] [PubMed] [Google Scholar]
- 27. Wang J, Gu X. High‐quality four‐dimensional cone‐beam CT by deforming prior images. Phys Med Biol. 2013;58:231–246. [DOI] [PubMed] [Google Scholar]
- 28. Zhang Y, Yin FF, Segars WP, Ren L. A technique for estimating 4D‐CBCT using prior knowledge and limited‐angle projections. Med Phys. 2013;40:121701. [DOI] [PubMed] [Google Scholar]
- 29. Zhang Y, Yin FF, Pan T, Vergalasova I, Ren L. Preliminary clinical evaluation of a 4D‐CBCT estimation technique using prior information and limited‐angle projections. Radiother Oncol. 2015;115:22–29. [DOI] [PMC free article] [PubMed] [Google Scholar]
- 30. Zhang Y, Tehrani JN, Wang J. A biomechanical modeling guided CBCT estimation technique. IEEE Trans Med Imaging. 2017;36:641–652. [DOI] [PMC free article] [PubMed] [Google Scholar]
- 31. Ren L, Chetty IJ, Zhang J, et al. Development and clinical evaluation of a three‐dimensional cone‐beam computed tomography estimation method using a deformation field map. Int J Radiat Oncol Biol Phys. 2012;82:1584–1593. [DOI] [PubMed] [Google Scholar]
- 32. Zhang Y, Yin FF, Ren L. Dosimetric verification of lung cancer treatment using the CBCTs estimated from limited‐angle on‐board projections. Med Phys. 2015;42:4783–4795. [DOI] [PMC free article] [PubMed] [Google Scholar]
- 33. Harwood‐Nash DC, Reilly BJ. Calcification of the basal ganglia following radiation therapy. Am J Roentgenol. 1970;108:392–395. [DOI] [PubMed] [Google Scholar]
- 34. Zhao W, Robbins ME. Inflammation and chronic oxidative stress in radiation‐induced late normal tissue injury: Therapeutic implications. Curr Med Chem. 2009;16:130–143. [DOI] [PubMed] [Google Scholar]
- 35. Kumar AJ, Leeds NE, Fuller GN, et al. Malignant gliomas: MR imaging spectrum of radiation therapy‐ and chemotherapy‐induced necrosis of the brain after treatment. Radiology. 2000;217:377–384. [DOI] [PubMed] [Google Scholar]
- 36. Nett B, Tang J, Aagaard‐Kienitz B, Rowley H, Chen GH. Low radiation dose C‐arm cone‐beam CT based on prior image constrained compressed sensing (PICCS): including compensation for image volume mismatch between multiple data acquisitions. Proc. SPIE 7258, Medical Imaging 2009: Physics of Medical Imaging, 2009;725803.
- 37. Dang H, Wang AS, Sussman MS, Siewerdsen JH, Stayman JW. dPIRPLE: A joint estimation framework for deformable registration and penalized‐likelihood CT image reconstruction using prior images. Phys Med Biol. 2014;59:4799–4826. [DOI] [PMC free article] [PubMed] [Google Scholar]
- 38. Segars WP, Mahesh M, Beck TJ, Frey EC, Tsui BM. Realistic CT simulation using the 4D XCAT phantom. Med Phys. 2008;35:3800–3808. [DOI] [PMC free article] [PubMed] [Google Scholar]
- 39. Dang J, Gu X, Pan T, Wang J. A pilot evaluation of a 4‐dimensional cone‐beam computed tomographic scheme based on simultaneous motion estimation and image reconstruction. Int J Radiat Oncol Biol Phys. 2015;91:410–418. [DOI] [PubMed] [Google Scholar]
- 40. Wang J, Gu X. Simultaneous motion estimation and image reconstruction (SMEIR) for 4D cone‐beam CT. Med Phys. 2013;40:101912. [DOI] [PubMed] [Google Scholar]
- 41. Gu X, Pan H, Liang Y, et al. Implementation and evaluation of various demons deformable image registration algorithms on a GPU. Phys Med Biol. 2010;55:207–219. [DOI] [PMC free article] [PubMed] [Google Scholar]
- 42. La Riviere PJ, Billmire DM. Reduction of noise‐induced streak artifacts in x‐ray computed tomography through spline‐based penalized‐likelihood sinogram smoothing. IEEE Trans Med Imaging. 2005;24:105–111. [DOI] [PubMed] [Google Scholar]
- 43. Wang J, Li T, Lu H, Liang Z. Penalized weighted least‐squares approach to sinogram noise reduction and image reconstruction for low‐dose x‐ray computed tomography. IEEE Trans Med Imaging. 2006;25:1272–1283. [DOI] [PMC free article] [PubMed] [Google Scholar]
- 44. Wang Z, Bovik AC. A universal image quality index. IEEE Signal Proc Let. 2002;9:81–84. [Google Scholar]
- 45. Fotina I, Lütgendorf‐Caucig C, Stock M, Pötter R, Georg D. Critical discussion of evaluation parameters for inter‐observer variability in target definition for radiation therapy. Strahlenther Onkol. 2012;188:160–167. [DOI] [PubMed] [Google Scholar]
- 46. Jaffray DA, Siewerdsen JH. Cone‐beam computed tomography with a flat‐panel imager: Initial performance characterization. Med Phys. 2000;27:1311–1323. [DOI] [PubMed] [Google Scholar]
- 47. Chen GH, Theriault‐Lauzier P, Tang J, et al. Time‐resolved interventional cardiac C‐arm cone‐beam CT: An application of the PICCS algorithm. IEEE Trans Med Imaging. 2012;31:907–923. [DOI] [PMC free article] [PubMed] [Google Scholar]
- 48. Bissonnette JP, Purdie TG, Higgins JA, Li W, Bezjak A. Cone‐beam computed tomographic image guidance for lung cancer radiation therapy. Int J Radiat Oncol Biol Phys. 2009;73:927–934. [DOI] [PubMed] [Google Scholar]
- 49. Yang Y, Schreibmann E, Li T, Wang C, Xing L. Evaluation of on‐board kV cone beam CT (CBCT)‐based dose calculation. Phys Med Biol. 2007;52:685–705. [DOI] [PubMed] [Google Scholar]
- 50. Schaly B, Kempe JA, Bauman GS, Battista JJ, Van Dyk J. Tracking the dose distribution in radiation therapy by accounting for variable anatomy. Phys Med Biol. 2004;49:791–805. [DOI] [PubMed] [Google Scholar]
- 51. Li T, Zhu X, Thongphiew D, et al. On‐line adaptive radiation therapy: Feasibility and clinical study. Journal of oncology. 2010;2010:407236. [DOI] [PMC free article] [PubMed] [Google Scholar]
- 52. Wu Z, Rietzel E, Boldea V, Sarrut D, Sharp GC. Evaluation of deformable registration of patient lung 4DCT with subanatomical region segmentations. Med Phys. 2008;35:775–781. [DOI] [PubMed] [Google Scholar]
- 53. Vandemeulebroucke J, Bernard O, Rit S, Kybic J, Clarysse P, Sarrut D. Automated segmentation of a motion mask to preserve sliding motion in deformable registration of thoracic CT. Med Phys. 2012;39:1006–1015. [DOI] [PubMed] [Google Scholar]
- 54. Li M, Castillo E, Zheng XL, et al. Modeling lung deformation: A combined deformable image registration method with spatially varying Young's modulus estimates. Med Phys. 2013;40:081902. [DOI] [PMC free article] [PubMed] [Google Scholar]
- 55. Brock KK, Sharpe MB, Dawson LA, Kim SM, Jaffray DA. Accuracy of finite element model‐based multi‐organ deformable image registration. Med Phys. 2005;32:1647–1659. [DOI] [PubMed] [Google Scholar]
- 56. Spitzbarth M, Drescher M. Simultaneous iterative reconstruction technique software for spectral‐spatial EPR imaging. J Magn Reson. 2015;257:79–88. [DOI] [PubMed] [Google Scholar]
Associated Data
This section collects any data citations, data availability statements, or supplementary materials included in this article.
Supplementary Materials
Fig. S1: Relative errors of the reconstructed images by using different relaxation factors for the ART update in the ADRIC reconstruction, for both the XCAT data and the porcine data. The relaxation factors used for each data point from left to right are 0.005, 0.01, 0.05, 0.1, and 0.5, correspondingly. The reconstruction uses 40 projections for the XCAT study and 20 projections for the porcine study.


