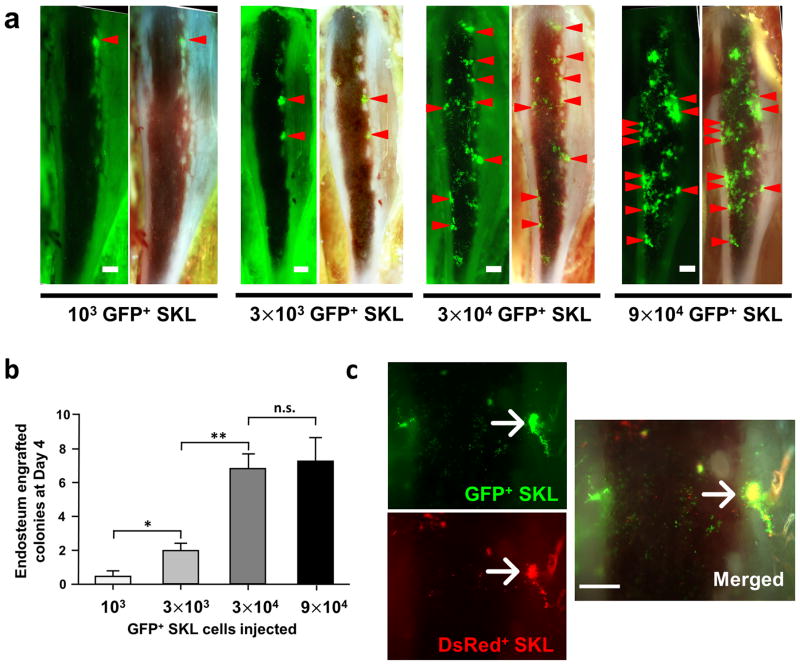
Figure 5. SKL cells tend to engraft on the specific niche with the limited number.
(a) Representative images of tibia window with different number of GFP+ SKL cell injection at day 4. Endosteum-engrafted colonies above 3500μm2 were marked with red arrowheads to speculate possible osteoblastic niche locations. (b) The average number of observed colonies in each group was shown in graph (n=5–10). Data analyzed by ANOVA and Tukey’s post test, *, P<0.05; **, P<0.01; n.s.= not significant (c) The same number of SKL cells from GFP and DsRed mice (3×10⁴ cells) were injected into the same recipient to show the niche preference of SKL cells (n=3). Scale bars = 500μm for a, 300μm for c.

