

Abstract
Background
Drug-Induced Liver Injury (DILI) changes, occur post exposure to natural or chemical compounds including apoptosis.
Aim
To assess the H1N1 vaccine-caused DILI by histochemical and immunohistochemical methods.
Methods
This 2014’s experimental study was conducted on 70 albino rats. They were given ArepanrixTM H1N1 vaccine and were divided into 7 groups; 10 mice each, as control (non-vaccinated), vac2 and vac4 injected with 1st and 2nd doses of vaccine (suspension only) and euthanized after 3 weeks each, vac5 euthanized 6 weeks after 2nd dose, mix2 and mix4 injected with 1st and 2nd doses of vaccine (mixture of suspension and adjuvant) and euthanized after 3 weeks each, mix5 and euthanized 6 weeks after 2nd dose. Histopathological evaluation and histochemical assessment of metabolic protein, glycogen and collagen changes using PAS, bromophenol blue, Mallory’s trichrome and immunohistochemistry for caspase 3 on liver tissue paraffin sections were done. Image analysis system Leica QIIN 500 was used. Data were analyzed by SPSS software, using descriptive statistics and ANOVA.
Results
Histopathological changes ranging from subtle up to necrosis were noticed, mainly in mix groups. Metabolic protein and glycogen changes were the maximum in mix5 group (p<0.01). Collagen deposition in sinusoids was higher in mix groups, and maximally in vac5 and mix5. Apoptotic hepatocytes expressing diffuse strong nuclear and cytoplasmic caspase 3 were the highest in mix5.
Conclusion
H1N1 vaccine can cause DILI by either direct toxic or idiosyncratic metabolic type reactions rather than immunologic hypersensitivity type. It ranges from subtle changes up to necrosis. Caspase 3 is pivotal in liver damage etiology, apoptosis induction and processing. Follow up for at least 2 months after the 2nd dose of H1N1 vaccine is recommended to rule out H1N1-induced DILI.
Keywords: H1N1 vaccine, DILI, Caspase3, Apoptosis, Liver
1. Introduction
Drug-Induced Liver Injury (DILI) is a group of diverse responses that occur post exposure to natural or chemical compounds (1). Usually DILI appears within the first three months of starting the drug (2). It tends to subside after the offending drug is stopped, although in rare cases it may progress to require liver transplantation (3). Hence, withdrawal of the suspected drug is indicated at the first sign of an adverse reaction (3). Nevertheless, the latency period can vary from a few hours to up to a year (4). Moreover, delayed reactions were mentioned 3 to 4 weeks post drug withdrawal (4). In general, hepatotoxicity induced by drugs results from either direct toxic or idiosyncratic reaction (3). While the direct toxic reaction tends to be short, the idiosyncratic reaction often shows unpredictable course with variable latency periods (1). Moreover, idiosyncratic DILIs are broadly divided into hypersensitivity (immunologic) and metabolic by the mechanism of injury (1). Hypersensitivity type reactions are characterized by fever, rash, granulomas, and eosinophilia in the peripheral blood or tissue biopsy and represent up to 37% of idiosyncratic DILIs (1, 5, 6). In contrast, the metabolic type reactions, by definition, lack the evidence of hypersensitivity (1). Furthermore, most idiosyncratic DILIs occur at higher drug concentrations. Threshold levels of the parent drug, metabolite, and/or adducts are determined by drug solubility and hepatic metabolism, which are prerequisites for the DILI (1, 7). Pathologically, DILI was classified into six injury patterns: zonal injury (necrosis), uncomplicated cholestasis, non-specific hepatitis with or without cholestasis, acute viral hepatitis-like, including progression to massive necrosis, non-specific reactive hepatitis and steatosis (1, 8, 9). Steatosis is considered as a prototypical type of drug-induced liver injury as it reflects the impairment of normal synthesis and elimination of triglycerides (10). In this regard, microvesicular steatosis represents a special entity of steatotic DILI and is almost always associated with mitochondrial toxicity in which severe hepatic failure can occur without widespread hepatic necrosis (9, 11, 12). However, the distribution of steatosis in steatotic DILI may differ from the typical zone 3 injury pattern of non-alcoholic steatohepatitis (9). It occurs due to interaction of drugs with hepatic nuclear receptors that leads to induction of transcription of genes encoding cholesterol and lipid metabolism, increased influx of fatty acids from peripheral tissues into the liver, do novo synthesis of fatty acids and accumulation of triglycerides in hepatocytes, thus provoking mitochondrial toxicity and dysfunction (10), with subsequent Reactive Oxygen Species (ROS) formation, endoplasmic reticulum stress, inflammation induction, cell death and eventually fibrosis. Furthermore, ROS cause nuclear translocation of Nuclear Factor Kappa B (NF-κβ) translocation into the nucleus that promotes apoptotic cell death by inducing transcriptional expression of the normally repressed Fatty Acid Synthetase (FAS) ligand. FAS ligand binds to FAS on adjacent hepatocytes and leads to caspase 9 activation with subsequent other caspases -including caspase3- activation, thus promoting apoptotic hepatocyte cell death (13, 14). More importantly, a common feature of these insults is activation of apoptotic and/or necrotic cell death (15). Cell death in the liver occurs mainly by apoptosis or necrosis (15). Apoptosis represents the physiologic route to eliminate damaged or infected cells in order to maintain tissue homeostasis (15) while avoiding inflammation and damage to the surrounding cells (16). Death receptor induced apoptosis is mediated by increased both mitochondrial lysosomal permeability and generation of ROS, thus promotes hepatocytes apoptosis in response to toxic materials (15). Nevertheless, hepatocyte apoptosis, necrosis, formation of ROS and mitochondrial dysfunction occur also in liver toxicity (15). The gold standard for apoptosis evaluation is the morphology (17) in the form of cell shrinkage, chromatin condensation and margination, and formation of apoptotic bodies, DNA fragmentation and membrane blebbing (16, 17). On the other hand, loss of the plasma membrane permeability barrier due to rupture of large plasma membrane blebs is a cardinal morphologic feature of necrosis (15, 18). Necrosis is an unregulated form of cell death. Since hepatocytes have no lumen to be shed into when apoptosis occurs - unlike other epithelial organs where apoptotic cells can be rapidly shed into a lumen -, the liver is uniquely susceptible to secondary necrosis during apoptotic injury (15). Moreover, if apoptotic hepatocytes are not rapidly engulfed, their membranes break down resulting in secondary necrosis (15, 19). Therefore, when hepatocytes apoptosis is rapid and extensive and when not all the apoptotic bodies are rapidly and efficiently engulfed by phagocytic cells, secondary necrosis occurs (15). Furthermore, distinguishing necrosis from apoptosis in vivo is difficult and it is impossible to differentiate necrosis, necroptosis, and secondary necrosis in functional and morphological analysis (15). Nevertheless, necrosis can elicit a significant inflammatory response in cell death in contrast to apoptosis that simulates inflammatory liver diseases (15, 20). In these regards, it was also reported that when the number of damaged mitochondria in the hepatocyte is relatively low, the cellular ATP level is preserved and leads to apoptosis rather than necrosis Conversely, when the majority of mitochondria in the cells are dysfunctional, the normal ATP production can no longer be maintained, resulting in cell death by necrosis (15). Activation of apoptosis occurs through extrinsic or death receptor associated pathways, as well as through the intrinsic or organelle mediated pathways by either caspase dependent or caspase independent manners (15). Caspases are classified by their mechanism of action into initiator caspases (caspases 8 and 9) and executioner caspases (caspases 3, 6, and 7) (16). Caspases chew up the cellular constituents in apoptosis into non-inflammatory molecules (15, 21). Hypoxic insult of liver induces activation of caspase 3 in hepatocytes (22). Apoptotic cells are characterized by intense caspase 3 activation and processing through Fas or Tumor Necrosis Factor (TNF) receptors stimulation (17). The liver is extremely sensitive to Fas mediated apoptosis because Fas antigen is expressed constitutively on hepatocytes which activates caspase 3 via caspase 8 activation (22). Influenza virus is life threatening. Due to seasonal strain variation, annual vaccination is recommended. Since vaccines are the milestone of public health, several strategies are used to promote their immunogenicity (23). Vaccines often contain adjuvants (e.g., squalene) to enhance antigen specific immune responses, together with preservatives (e.g., Thimerosal) to prevent bacterial or fungal contamination (24–26), which are important for vaccine delivery (27). It was reported that squalene causes pathologic reactions at the injection site, together with mild erythema, muscle aches and swelling (25, 28), followed by tissue necrosis, intense inflammation and granulomatous lesions (25, 29), as well as Guillain Barre Syndrome (25, 30). Moreover, when thimerosal is degraded or metabolized, ethyl mercury is formed (25, 31) leading to reactive oxygen species (ROS) production, depletion of intracellular glutathione with subsequent mercury induced cytotoxicity (25, 32). Since mitochondria play a crucial role in regulation of apoptosis (27, 33, 34), thimerosal induces loss of mitochondrial membrane in T cells which is strongly associated with enhanced intracellular reactive oxygen species, release of cytochrome c and caspase 3 activation (27). Studies showed poor prognostic implication of necrosis in biopsy (1, 35, 36). Additionally, it was reported that a degree of necrosis, fibrosis stage, microvesicular steatosis, panacinar steatosis, cholangiolar cholestasis, ductular reaction, neutrophils, and portal venopathy are associated with a higher degree of DILI’s severity (1, 35). Moreover, histologic evidences of a hypersensitivity type reaction predominantly in the form of presence of eosinophils and/or granulomas, have a greater survival potential and show relatively mild course of liver damage, as well as better chance of recovery (1, 5, 35). Thus, when DILI is suspected, patterns of injury should be determined with careful evaluation of the central veins, bile ducts and the character of the inflammation. Special stains can be extremely helpful (9). Since caspases activation is considered as apoptosis marker (15), we used Caspase 3 immunohistochemistry to assess the apoptosis in DILI induced by H1N1 vaccine, together with other special stains e.g.; Periodic Acid Schiff (PAS), Mercuric Bromophenol blue and Mallory’s Trichrome stains to evaluate the associated metabolic changes in glycogen, protein and collagen.
2. Material and Methods
2.1. Experimental Animals
This experimental study was conducted in 2014. Seventy immature male albino rats; Rattus albinus strain were obtained from The Nile Company for Pharmaceutical and Chemical Industries by the Zoology Department, Faculty of Science, Azhar University. Body weight of rats ranged from 65 gm to 70 gm. After an acclimatization period of one week, the animals were housed in metallic cages. All rats were kept under standard conditions of light and temperature, they were provided with water and a balanced diet.
2.2. Animals rights
All animals received care in compliance with the Egyptian rules for animal protection and approved by the Zoology Department, Faculty of Science, Azhar University committee.
2.3. Vaccine
ArepanrixTM H1N1 vaccine (GlaxoSmithKline, Uxbridge, UK) was used in our study. It is composed of a suspension (antigen; A/California/7/2009(H1N1) v-like virus, propagated in eggs, haemagglutinin, thiomersal, sodium chloride, disodium hydrogen phosphate, potassium dihydrogen phosphate, potassium chloride and water for injection) and an emulsion (adjuvant; squalene as adjuvant, DL-a-tocopherol and polysorbate 80, sodium chloride, disodium hydrogen phosphate, potassium dihydrogen phosphate, potassium chloride and water for injection). The recommended dose for humans is 0.25 ml of vaccine (i.e. half of adult dose) at an elected date and a second dose administrated in at least three weeks. The recommended dose of rats equals the human dose multiplied by conversation factor (0.018)/200 gm of body weight of rat (25, 38).
2.4. Study groups
Rats were divided into 7 groups as follows:
Ten rats acted as the negative control group.
Vac 2: Ten rats were intramuscularly vaccinated with the 1st dose of influenza vaccine (suspension only) and euthanized after three weeks.
Vac 4: Ten rats vaccinated with the 2nd dose of the suspension only form and euthanized after three weeks.
Vac 5: Ten rats vaccinated with the 2nd dose of the suspension only form at interval of three weeks between the 1st dose and 2nd dose, then euthanized after 6 weeks (one month and half from the 2nd dose).
Mix 2: Ten rats were intramuscularly vaccinated with the 1st dose of H1N1 vaccine (mixture of suspension and adjuvant) and euthanized after three weeks.
Mix 4: Ten rats vaccinated with the 2nd dose of H1N1 vaccine (mixture of suspension and adjuvant) and euthanized after three weeks.
Mix 5: Ten rats vaccinated with the 2nd dose of H1N1 vaccine (mixture of suspension and adjuvant), then euthanized after 6 weeks (one month and half from the 2nd dose).
2.5. Pathological and histochemical studies
Livers from the control and vaccinated groups were fixed in 10% buffered formalin. Paraffin sections were prepared and cut at 4μ thickness, then stained with Hematoxylin and Eosin (H&E), Mallory’s trichrome stain for collagen, Periodic Acid Schiff (PAS) for glycogen, Mercuric Bromophenol blue (BP) for protein evaluation.
2.6. Caspase 3 immunohistochemistry
Immunohistochemical staining performed on 4-μm, formalin-fixed, paraffin-embedded sections using caspase 3 antibodies at 1:50 dilution (DAKO, Carpinteria, CA). Antigen retrieval was performed in all cases by steam heating the slides in a 1-mmol/L solution of EDTA (pH 8.0) for 30 minutes. After blocking of endogenous biotin, staining was performed using an automated immunostainer (DAKO) followed by detection by using a streptavidin-biotin detection system (DAKO). Positive and negative control sections used for each assay.
2.7. Evaluation of the stains
Caspase 3 expression in hepatocytes was evaluated according to H score (39, 40) in fields distant from necrotic areas (40). Semiquantitative analysis was performed as follows: (−): negative, (+): weak staining, (++): moderate staining, (+++): strong staining (41). Assessment of metabolic changes of protein and glycogen density in tissue, as well as collagen deposition per surface area percentage were evaluated and calculated using image analysis system Leica QIIN 500.
2.8. Statistical Analysis
The statistical analysis was carried out using analysis of variances (one way ANOVA) using the SPSS (SPSS Inc., Chicago, Illinois, USA). A difference was considered significant at p< 0.05.
3. Results
DILI’s microscopic pathological and metabolic changes were seen after 3 weeks of the vaccine’s 1st dose (in vac2 and mix2 groups) and after 3 weeks of the 2nd vaccine’s dose (i.e. at one and half months after vaccine’s 1st dose in vac4 and mix4 groups). Surprisingly, DILI’s pathological and metabolic changes persisted and showed the highest values in vac5 and mix5 groups (i.e.; at 6 weeks / one and half months after vaccine’s 2nd dose) instead of regression and healing.
3.1. H&E examination (Figure 1)
Figure 1.

H&E features of H1N1 vaccine induced DILI. A-Vac2: Patchy central vein congestion with no pericentral necrosis (arrow). H&E × 200. B-Vac2: Microvesicular steatosis (arrow tips). H&E × 400. C-Vac4: Non-necrotizing micro epithelioid granulomas (arrows) formation and occluded central veins (stars). H&E × 200. D-Vac5: Apoptotic fragmented nuclei (arrows) and hepatocytes necrosis. H&E × 400. E-Vac5: Microvesicular steatosis (stars), apoptotic (arrows) and lost nuclei. H&E × 1000. F-Mix2: Shrunk deep eosinophilic preapoptotic hepatocytes with portal vessels congestion (arrows). Normal portal tract with no inflammation or fibrosis. H&E × 400. G-Mix4: Ischemic zones 3 & 2 (stars). H&E × 200. H-Mix4: Moderate lobular mononuclear inflammatory exudation with non-necrotizing micro epithelioid granulomas formation (arrows). H&E × 400. I-Mix4: Moderate lobular inflammation (arrows). H&E × 200. J-Mix5: Parenchymal non- necrotizing micro epithelioid granuloma (arrow) with degenerated hepatocytes show cytoplasmic clearing due to increase glycogen content. H&E × 400. K-Mix5: Moderate portal inflammation with portal venulopathy (star) and focal interface hepatitis (arrows). H&E × 400. L-Mix5: Microvesicular steatosis, apoptotic (arrows) and other lost nuclei. H&E × 1000.
On H&E examination, apoptotic hepatocytes showed nuclear membrane irregularities, nuclear fragmentation, and even nuclear loss. Vac2 (at one end of a chronological spectrum) showed the least changes with only congested - likely occluded - central veins and some portal vessels and foci of mild microvesicular steatosis with unremarkable lobular inflammation, absent necrosis, lobular granulomas and cholestasis. In contrast, mix5 (at the other end of the spectrum) showed the maximal changes among all the examined groups in the form of prominent occluded central and portal veins, wide foci of necrosis in zones 3, 2, and 1, surrounded by apoptotic hepatocytes, conspicuous lobular inflammation, epithelioid non-necrotizing lobular granulomas, foci of mild portal inflammation with focal interface hepatitis-like lesions, and noticeable microvesicular steatosis. However no encountered cholestasis, confluent necrosis, or portal ductular proliferation or eosinophils or neutrophils exudation or fibrosis in these groups. Between the two ends of the spectrum, our study showed variable degrees of necrosis, microvesicular steatosis, portal venular changes, lobular inflammation and non-necrotizing epithelioid granulomas; predominantly in mix groups, particularly in mix4 and mix5 groups, and in vac4 and vac5 groups, in comparison with vac2 group (Figure 1). Necrosis foci started to appear in mix4 group in contrast to vac4 group. All groups showed neither eosinophils, neutrophils exudation, cholangiolar cholestasis, ductular reaction nor fibrosis.
3.2. Metabolic evaluation of glycogen, protein and collagen
Regarding glycogen, overall, there was a significant increase in glycogen content in hepatocytes in all mix groups and in vac4 & 5 groups compared to vac2 group (p<0.01). Furthermore, mix5 showed significant increase in glycogen content in hepatocytes in contrast to other groups (p<0.01) (Table 1, Figures 2, 3, 4). However, there was no significant variation between either vac4 and mix4, or between vac5 and mix5 groups (Table 1, Figure 2). Regarding protein, mix5 showed significant increase in protein content in hepatocytes in contrast to other groups (p<0.01) (Table 1, Figures 2, 3, 4). However, there was no significant variation between either vac2 and mix2, or between vac2 and mix4, or between vac5 and mix5 (Table 1, Figure 2). Overall, findings showed coinciding dense glycogen and protein in hepatocytes surrounding the areas of necrosis; mainly in zones 2 and 1, with pale pericentral necrotic hepatocytes in zones 3, less in zones 2, and in zones 1 if portal vessels are occluded (Figures 3, 4). Conversely, all mix groups showed higher collagen deposition predominantly in sinusoids in comparison to vac only groups, and particularly in vac4 and vac5 compared to vac2 group (Table 1, Figures 2, 5). Furthermore, vac4, vac5, mix4 & mix5 groups showed remarkable fibrinoid necrosis and disruption of the endothelium of occluded central and portal veins in comparison to vac2 and mix2 groups.
Table 1.
Image analysis results and statistical evaluation of mean density of glycogen by PAS, protein by Bromophenol blue (BP), and the mean percentage of collagen deposition per surface area by Mallory’s trichrome among the examined groups.
| Glycogen | p-value | Protein | p-value | Collagen density in sinusoids | p-value | |
|---|---|---|---|---|---|---|
| Control | 0.26 | <0.01 | 0.164 | <0.01 | 5.01% | <0.01 |
| Vac-2 | 0.32 | 0.37 | 24.07 % | |||
| Mix-2 | 0.46** | 0.36 | 39.35% | |||
| Vac-4 | 0.42 | 0.34 | 35.53% | |||
| Mix-4 | 0.40 | 0.31 | 49.64%** | |||
| Vac-5 | 0.38 | 0.73** | 45.35%** | |||
| Mix-5 | 0.54** | 0.70** | 58.48%** |
Correlation is significant at 0.01 level (2-tailed) compared to control & vac2.
Figure 2.

Evaluation of image analysis results of mean density of carbohydrates by PAS, protein by Bromophenol blue (BP), and mean percentage of collagen deposition per surface area by Mallory’s trichrome among the examined groups.
Figure 3.
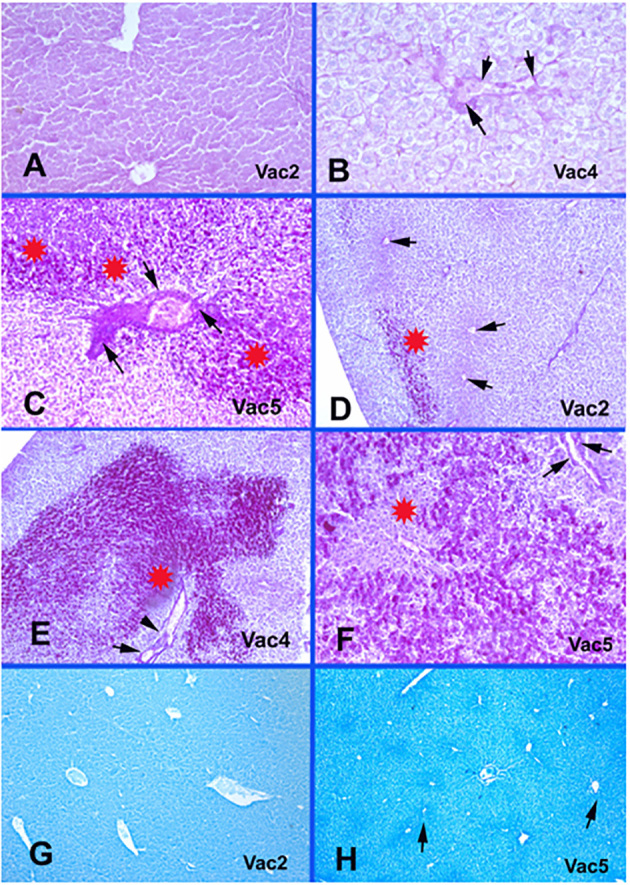
Vaccine only groups metabolic glycogen and protein changes. A-Vac2: Normal endothelial lining of central veins with no fibrinoid necrosis or disruption. PAS × 400. B-Vac4: Fibrinoid necrosis and disruption of endothelial lining of occluded central veins. PAS × 400. C-Vac5: Portal vein occlusion with fibrinoid necrosis (arrows), disruption of the endothelial lining and increased glycogen contents in hepatocytes (stars). PAS × 400. D-Vac2: Patchy increase in glycogen contents (star) with no fibrinoid necrosis of central veins’ endothelium (arrows). PAS × 40. E-Vac4: Prominent increase in glycogen content (star) and fibrinoid necrosis of endothelium of occluded portal vessels (arrows). PAS × 100. F-Vac5: Marked increase in glycogen content in zone 2 around the necrotic hepatocytes in the pericentral area in zone 3 (star) and fibrinoid necrosis of the endothelium of a portal vein (arrows). PAS × 100. G-Vac2: Unremarkable protein condensation around the central veins in zones 3. Bromophenol blue × 40. H-Vac5: Protein condensation in the ischemic zones 3 (arrows). bromophenol blue × 40.
Figure 4.
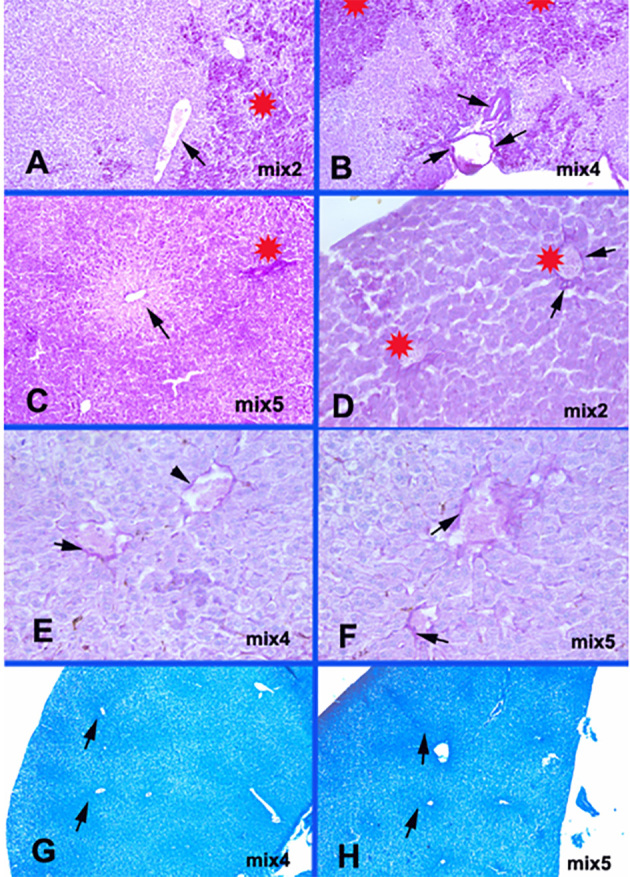
Mix groups metabolic glycogen and protein changes. A-Mix2: Patchy increase in glycogen contents (star) with no fibrinoid necrosis of congested central veins’ endothelium (arrows). PAS × 100. B-Mix4: Patchy increase in glycogen contents (stars) and fibrinoid necrosis of vessel’s endothelium (arrows). PAS × 100. C-Mix5: Marked increase in glycogen content of hepatocytes (star) in zone 2 around the pericentral necrotic hepatocytes in zone 3 (arrow). PAS × 40. D-Mix2: Occluded central veins (stars) with focal fibrinoid changes (arrows) in the endothelial lining. PAS × 400. E-Mix4: Milder fibrinoid necrosis and disruption of endothelial lining of occluded central veins (arrows). PAS × 400. F-Mix5: Prominent fibrinoid necrosis in the occluded central veins’ endothelium (arrows). PAS × 400. G-Mix4: Protein condensation pericentral in the ischemic zones 3 (arrows). bromophenol blue × 40. H-Mix5: Protein condensation in the ischemic zones 3 (arrows). bromophenol blue × 40.
Figure 5.
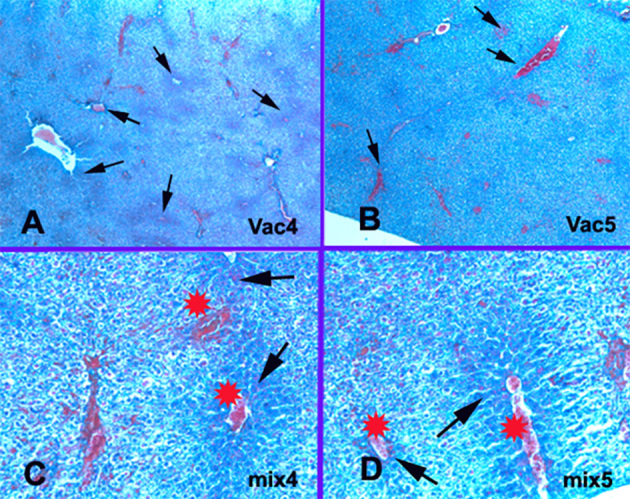
Collagen changes. A-Vac4: Central veins occlusion with perivascular collagen condensation in the ischemic zones 3 (arrows). Mallory’s trichrome × 40. B-Vac5: Central veins occlusion with perivascular collagen condensation in the ischemic zones 3 and 2. Mallory’s trichrome × 40. C-Mix4: Collagen condensation in the ischemic zones 3 (arrows) around the occluded central veins (stars) and sinusoid. Mallory’s trichrome × 200. D-Mix 5: Collagen condensation in the ischemic zones 3 around the occluded central veins (stars) and sinusoids (arrows). Mallory’s trichrome × 200.
3.3. Caspase 3 immunohistochemistry
Vac2 group showed very occasional weak nuclear and cytoplasmic expression (Figure 6a). Mix2 group showed near similar expression pattern with rather cytoplasmic condensation in the apoptotic hepatocytes around the congested vessels (Figures 6b, 6c). On the other hand, vac4 exhibited patchy however more diffuse cytoplasmic and weak nuclear Caspase 3 expression in the apoptotic hepatocytes around occluded blood vessels (Figure 6d), in contrast to vac and mix2 groups. Moreover, mix4 group showed more prominent and diffuse mild to moderate nuclear and cytoplasmic expression pattern, with noticeable condensation in the apoptotic hepatocytes around the congested central and portal veins, compared to vac4 group (Figures 6e, 6f). Furthermore, vac5 showed patchy nuclear and near diffuse moderate to strong cytoplasmic Caspase 3 expression in the apoptotic hepatocytes (Figure 6g). Mix5 group showed the strongest and the most diffuse nuclear and cytoplasmic positivity in the apoptotic hepatocytes (Figure 6h).
Figure 6.
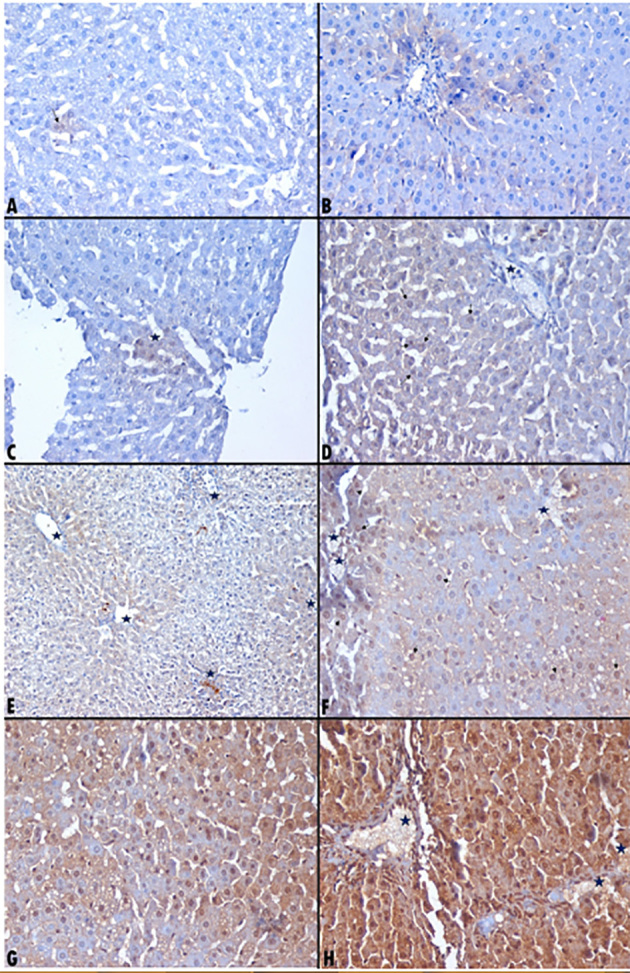
Caspase 3 immunohistochemistry expression among the examined groups. A-Vac2: Very occasional weak nuclear and cytoplasmic foci expressing caspase 3. Immunohistochemistry × 400. B-Mix2: Apoptotic hepatocytes condensation perivascular (around portal vessels) showing weak cytoplasmic caspase 3. Immunohistochemistry × 400. C-Mix2: Apoptotic hepatocytes show focal nuclear and weak cytoplasmic caspase 3. Immunohistochemistry × 400. D-Vac4: Weak cytoplasmic and patchy weak nuclear (arrows) caspase 3 expression in the apoptotic hepatocytes around an occluded blood vessel (star). Immunohistochemistry × 400. E-Mix4: Apoptotic hepatocytes condensation perivascular around central veins and in apoptotic necrotic hepatocytes (stars). Immunohistochemistry × 200. F-Mix4: Apoptotic hepatocytes condensation perivascular around thrombosed vessel (stars) with plenty of nuclear (arrows) and patchy cytoplasmic caspase 3. Immunohistochemistry × 400. G-Vac5: Patchy nuclear and near diffuse moderate cytoplasmic caspase 3 expression in the apoptotic hepatocytes. Immunohistochemistry × 400. H-Mix5: Near diffuse moderate to strong nuclear and cytoplasmic caspase 3 around occluded central and portal vessels. Immunohistochemistry × 400.
4. Discussion
H1N1 vaccine can show adverse effects due to mixing the vaccine with adjuvants (e.g., squalene) in order to enhance antigen specific immune responses, as well as with preservatives (e.g., thimerosal) in order to prevent bacterial or fungal contamination (25). This leads to mercury induced cytotoxicity through its degradation and metabolism with ethyl mercury formation (25), and subsequently, according to Sanfeliuet al. (25, 32), production of reactive oxygen species. This results in apoptosis through induction of mitochondrial permeability transition, S phase arrest, and caspase 3 activation (27). Cell death in the liver occurs mainly by apoptosis or necrosis. Apoptosis is a physiologic route to eliminate the damaged and infected cells in order to maintain tissue homeostasis. However apoptosis and necrosis also occur in liver toxicity (15). In our study, DILI’s microscopic pathological and metabolic changes were seen 3 weeks after the vaccine’s 1st dose (in vac2 and mix2 groups) and 3 weeks after the 2nd vaccine’s dose (i.e. at one and a half months’ post vaccine’s 1st dose in vac4 and mix4 groups), thus occurred within the expected period of having DILI; i.e., within the first three months of starting the drug as reported by Aithal GP, et al. (2). However, surprisingly we showed that DILI’s pathological and metabolic changes persisted and exhibited the highest values in vac5 and mix5 groups (i.e.; at 6 weeks / 1 and half months’ post vaccine’s 2nd dose) instead of regression and healing. This came along with Kaplowitz’s (4) results who reported that DILI’s latency period can vary from a few hours up to a year. Also delayed reactions were reported 3 to 4 weeks after the drug’s withdrawal (4). In the same context, Braunwald et al. (3) reported that in rare cases DILIs may progress to require liver transplantation. Moreover, our study showed that changes ranged from very subtle as in vac2 group (3 weeks after 1st dose) up to maximal effect with zones 3, 2 and 1 necrosis in mix5 group after 9 weeks/2.5 months from the 1st dose. Thus, fall within the scope of acute form of DILI, which came in accordance with David E Kleiner (9) as well. It was also reported that milder forms of either patterns sometimes can be difficult to be classified as acute or chronic (9). According to Fisher et al. (1), it was also reported that acute hepatitis pattern of DILI is characterized by lobular dominant inflammation that ranges from subtle changes up to numerous and confluent lobular inflammation, and often is associated with areas of necrosis. In contrast, chronic hepatitis pattern is mainly centered in portal areas similar to hepatitis B or C, can persist up to 6 months from the beginning of confirmed liver damage depending on the pattern of liver injury, and shows persistent changes up to cirrhosis (1, 32). Furthermore, our study showed variable degrees of necrosis, microvesicular steatosis, portal venular changes, lobular inflammation and epithelioid granulomas. They were noticed predominantly in mix groups (particularly mix4 and mix5), and in vac5 group, compared with vac2 (Figure 1). There were no eosinophils, cholangiolar cholestasis, ductular reaction or neutrophils exudation in all groups. In this regard, it was mentioned that necrosis (1, 32, 36), fibrosis stage, microvesicular steatosis, panacinar steatosis, cholangiolar cholestasis, ductular reaction, neutrophils exudation, and portal venopathy are associated with a higher degree of DILI’s severity and indicate poor prognosis (1, 11). On the other hand, hypersensitivity type reactions in the form of eosinophils exudation and/or granulomas indicate better survival, milder course and easier recovery (1, 5, 35). Pathologically, Popper et al., in 1965 (8), classified DILI into six injury patterns: zonal injury (necrosis), uncomplicated cholestasis, non-specific hepatitis with or without cholestasis, acute viral hepatitis-like (including progression to massive necrosis), non-specific reactive hepatitis and steatosis (8, 9). Our study showed prominent occluded central and portal veins in vac5 and mix4 & 5 groups with zonal hepatocytes necrosis that was predominantly noticed pericentral in zone 3. It started to appear in mix4 rather than vac4 and involved foci of zones 2 and 1 particularly in vac5, mix 4 and mix5 groups. Moreover, fibrinoid necrosis of the endothelium of some central veins was noticed mainly in mix4 and mix5 groups, as well as in vac5 group as elaborated by PAS stain in Figures 3 and 4. This may be due to endothelial damage with subsequent veno-occlusive central veins lesions and necrosis, similar to what stated in Fisher et al. (1). In addition, it was reported that both necrosis and apoptosis target primarily hepatocytes and Liver Sinusoidal Endothelial Cells (LSEC) in which LSEC apoptosis precedes hepatocytes’ apoptosis (15, 42, 43). Furthermore, all mix groups showed higher collagen deposition predominantly in sinusoids in comparison to vac only groups (p<0.01) (Table 1, Figures 2b, 5). These findings were similar to David E Kleiner (9), in which vascular endothelial injury can vary from subtle to severe, leading to sinusoidal obstruction in zone 3 and gradual occlusion of the hepatic venules, with subsequent ischemic hepatocytes necrosis. This came also along with Fisher et al. (1) who explained that the zonal necrosis pattern of DILI is due to involvement of zonally distributed enzymes. Similarly, Maha et al. (26) showed highly elevated collagen fibers in squalene treated groups after the vaccine’s second dose leading to ischemia. In this regard, it was reported that ischemia produces toxins that stimulate the TNF-like weak inducer of apoptosis (TWEAK) death ligand, leading to hepatocytes death (15, 44). In addition, Vandenabeele P et al. (45) reported that necroptosis; a form of programmed and regulated necrosis is best triggered by TNF-α (46) leading to either caspase 8-dependent apoptosis or caspase 8-independent necroptosis (15). Caspases 8 activates effector caspases including caspase 3 that cleaves and degrades cellular proteins with subsequent cell death (15). Furthermore, necrosis causes cell swelling and activation of proteases and phospholipases with loss of mitochondrial integrity (15, 47), formation of ROS, mitochondrial dysfunction and activation of the stress kinases as a result to liver toxicity (15). In the same context, it was reported that distinguishing necrosis of liver injury from apoptosis is sometimes difficult, with impossible differentiation between necrosis, necroptosis, and secondary necrosis functionally (15). In our study on H&E examination, the apoptotic changes were mostly noticed in hepatocytes with unremarkable biliary lesions similar to that reported by Yang et al. (17), despite that the cholangiocytes are particularly susceptible to death receptor-mediated apoptosis as mentioned by Maria et al. (15). The apoptotic hepatocytes exhibited shrinkage, irregular nuclear membranes, chromatin condensation, margination and fragmentation similar to morphological findings reported by Yang et al. (17) (Figures 1d, 1e, 1f ). Also, vac4, vac5, mix4 and mix5 groups showed foci of lobular inflammation compared to vac and mix2 groups, mainly around apoptotic / necrotic areas. This is due to promotion of Fas agonists that induce hepatic chemokines and liver inflammation by the apoptotic hepatocytes (48), since the intense caspase 3 activity and processing through Fas or TNF receptors stimulation characterize the apoptotic cells (17, 22). In addition, according to Fatma et al. (25) and Viera 2001 (29), squalene as an adjuvant component of the H1N1 vaccine was reported to induce pathologic reactions including tissue necrosis, intense inflammation and granulomatous lesion. Against that, Martin et al., 2012 (21) mentioned that death receptor-mediated apoptosis is a non-inflammatory condition. Nevertheless, Maria et al., 2013 (15) reported that death receptor mediated apoptosis was described also in various inflammatory liver diseases (49), thus explaining the link between apoptosis and inflammation in the affected liver (15). Since steatosis is a prototypical type of DILI (10), microvesicular steatosis was detected in all groups including vac2 group, in contrast to control. It increased predominantly with the duration, and across the groups, with the other DILI morphological features to be the most obvious in mix5 and vac5 groups. This came along with Fisher et al. (1) and David E Kleiner (9) in which it was thought to be due to partial but chronic impairment of mitochondrial function indicating mitochondrial toxicity (9). Also similarly in our study, microvesicular steatosis did not show a distinguishable pattern or zone in its distribution (9). There was no macro-vesicular steatosis in our study as well. Non-necrotizing parenchymal epithelioid micro granulomas were detected in our study -similar to that of David E Kleiner (9)- in almost all groups but particularly in vac4 and vac5, as well as in mix4 and mix5, in comparison to vac2 and mix2 groups. Despite of absence of eosinophils, drug-induced granulomas was considered as a form of hypersensitivity type reaction that indicates better survival, milder course and easier recovery (1, 5, 35) as formerly mentioned. Metabolically, our study showed significant increase of glycogen and protein contents in mix5 group, where dense eosinophilic accumulation in hepatocytes around the necrotic apoptotic hepatocytes in zones 2 and 1 were exhibited (Figures 3, 4), in contrast to pale hepatocytes in necrotic areas mainly in zone 3. This may be due to protein degradation by caspase 3 in the necrotic area according to Maria et al. (15). Additionally, hepatocytes glycogenosis was reported in the damaged hepatocytes and characterized by swollen pale stained cytoplasm. It may be due to shifts in glycogen metabolism induced by drugs (9, 50). This came similar to our findings (Table 1, Figures 2a, 3, 4), thus supporting the evidence of metabolic type reaction in DILI-induced H1N1 vaccine. Nevertheless, our study showed non-significant increase in glycogen and protein when comparing vac4 to mix4, or mix4 to mix2. In the same context it was reported that in normal human and rat livers, apoptotic cells were identified preferentially in the pericentral area (zone 3) (15, 51, 52), thus explaining the higher rates of apoptosis in zone 3 (15, 53). Surprisingly, glycogen’s pattern of distribution contradicts the pattern of caspase 3 distribution (Figure 6e); in which there was cytoplasmic condensation of caspase 3 in the apoptotic hepatocytes predominantly in zone 3 around the congested vessels in mix2 group, and around the occluded central and portal vessels in vac4, mix4, vac5 and mix5 groups (Figure 6). Moreover, caspase 3 showed patchy more diffuse cytoplasmic and nuclear expression in vac and mix4 and vac5 groups. This is due to the fact that caspase cleavage of substrates is not a uniform process due to differences in pathophysiologic and biochemical processes during hepatocytes apoptosis, thus making the apoptosis a uniform process (15, 54). Furthermore, mix5 group exhibited the strongest and the most diffused nuclear and cytoplasmic positivity in the apoptotic hepatocytes (Figure 6h). This is due to activation of caspase 3 in apoptotic liver cells by the hypoxia as reported by Michitaka et al. (22), and also due to Fas and / or TNF-receptor activation that induces apoptosis resulting in extensive increase in caspase 3 activity and processing (17). In summary, DILI is induced by either direct toxic or idiosyncratic reactions (3). Direct toxic reaction is short, while the idiosyncratic reaction is often unpredictable and shows variable latency periods (3). Idiosyncratic DILIs are divided into hypersensitivity (immunologic) and metabolic type reactions. Hypersensitivity type reactions are characterized by fever, rash, granulomas, and eosinophilia in the peripheral blood or tissue biopsy, in contrast to the metabolic type reactions which lack evidences of hypersensitivity (1). Therefore, since our study showed only non-necrotizing micro-granulomas that are considered by some as hypersensitivity reaction, and since there were no other evidences of eosinophilia in the studied liver tissue, induction of DILI by H1N1 vaccine in our study can be due to direct toxic effect to liver or due to idiosyncratic (metabolic) type reaction rather than hypersensitivity (immunologic) type.
5. Conclusions
H1N1 vaccine can cause DILI by either direct toxic or idiosyncratic metabolic type reactions, rather than immunologic hypersensitivity type reaction. It ranges from very subtle changes up to necrosis (zonal or non-zonal). Caspase 3 plays a pivotal role in liver damage etiology, apoptosis induction and processing. Follow up for at least 2 months after the 2nd dose of H1N1 vaccine is recommended to rule out any possibility of H1N1-induced DILI.
Acknowledgments
Authors acknowledge and thank the assistant lecturer Alya Mohamed Aly at the Zoology Department, Al Azhar University, for her great efforts and help in animals and slides preparation and handling. This work was funded and financially supported on the expenses of the authors.
Footnotes
iThenticate screening: April 15, 2017, English editing: May 05, 2017, Quality control: May 15, 2017
Conflict of Interest:
There is no conflict of interest to be declared.
Authors’ contributions:
Both authors contributed to this project and article equally. Both authors read and approved the final manuscript.
References
- 1.Fisher Kurt, Vuppalanchi Raj, Saxena Romil. Drug-Induced Liver Injury. Archives of Pathology & Laboratory Medicine. 2015 Jul;139(7):876–87. doi: 10.5858/arpa.2014-0214-RA. [DOI] [PubMed] [Google Scholar]
- 2.Aithal GP, Watkins PB, Andradr RJ, et al. Case definition and phenotype standardisation in drug-induced liver injury. Nature. 2011;89(6):806–15. doi: 10.1038/clpt.2011.58. [DOI] [PubMed] [Google Scholar]
- 3.Braunwald E, Fauci AS, Kasper DL, et al. Harrison’s Principles of Internal Medicine. 15th Edition. McGraw Hill; 2003. [Google Scholar]
- 4.Kaplowitz Drug-induced liver injury. Clin Infect Dis. 2004;38(Suppl 2):S44–S48. doi: 10.1086/381446. [DOI] [PubMed] [Google Scholar]
- 5.Bjornsson E, Kalaitzakis E, Olsson R. The impact of eosinophilia and hepatic necrosis on prognosis in patients with drug-induced liver injury. Aliment Pharmacol Ther. 2007;25(12):1411–1421. doi: 10.1111/j.1365-2036.2007.03330.x. [DOI] [PubMed] [Google Scholar]
- 6.Ibanez L, Perez E, Vidal X, Laporte JR Grup d’Estudi Multicenteric d’Hepatotoxicitat Aguda de Barcelona. Prospective surveillance of acute serious liver disease unrelated to infectious, obstructive, or metabolic diseases: epidemiological and clinical features, and exposure to drugs. J Hepatol. 2002;37(5):592–600. doi: 10.1016/S0168-8278(02)00231-3. [DOI] [PubMed] [Google Scholar]
- 7.Vuppalanchi R, Gotur R, Reddy KR, et al. Relationship between characteristics of medications and drug-induced liver disease phenotype and outcome [published online ahead of print December 20 2013] Clin Gastroenterol Hepatol. doi: 10.1016/j.cgh.2013.12.016. [DOI] [PMC free article] [PubMed] [Google Scholar]
- 8.Popper H, Rubin E, Cardiol D, Schaffner F, Paronetto F. Drug-induced liver disease: a penalty for progress. Arch Intern Med. 1965;115:128–36. doi: 10.1001/archinte.1965.03860140008003. [DOI] [PubMed] [Google Scholar]
- 9.Kleiner David E. The histopathological evaluation of drug-induced liver injury. Histopathology. 2017;70(1):81–93. doi: 10.1111/his.13082.. [DOI] [PubMed] [Google Scholar]
- 10.Vinken Mathieu. Adverse outcome pathways and drug-induced liver injury testing. Chem Res Toxicol. 2015 Oct 7; doi: 10.1021/acs.chemrestox.5b00208. [DOI] [PMC free article] [PubMed] [Google Scholar]
- 11.McKenzie R, Fried MW, Sallie R, et al. Hepatic failure and lactic acidosis due to fialuridine (FIAU), an investigational nucleoside analogue for chronic hepatitis B. N Engl J Med. 1995;333:1099–105. doi: 10.1056/NEJM199510263331702. [DOI] [PubMed] [Google Scholar]
- 12.Kleiner DE, Gaffey MJ, Sallie R, et al. Histopathologic changes associated with fialuridine hepatotoxicity. Mod Pathol. 1997;10:192–199. [PubMed] [Google Scholar]
- 13.Koek GH, Liedorp PR, Bast A. The role of oxidative stress in non-alcoholic steatohepatitis. Clin Chim Acta. 2011;412:1297–305. doi: 10.1016/j.cca.2011.04.013. [DOI] [PubMed] [Google Scholar]
- 14.Patel Vaishali, Sanyal Arun J. Drug-Induced Steatohepatitis. Clin Liver Dis. 2013 Nov;17(4):533–7. doi: 10.1016/j.cld.2013.07.012. [DOI] [PMC free article] [PubMed] [Google Scholar]
- 15.Guicciardi Maria Eugenia, Malhi Harmeet, Mott Justin L, Gores Gregory J. Apoptosis and Necrosis in the Liver. Compr Physiol. 2013 Apr;3(2) doi: 10.1002/cphy.c120020.. [DOI] [PMC free article] [PubMed] [Google Scholar]
- 16.McIlwain David R, Berger Thorsten, Mak Tak W. Caspase Functions in Cell Death and Disease. Caspase functions in cell death and disease. Cold Spring Harb Perspect Biol. 2013 Apr 1;5(4):a008656. doi: 10.1101/cshperspect.a008656. [DOI] [PMC free article] [PubMed] [Google Scholar]
- 17.Yang Min, Antoine Daniel J, Weemhoff James L, Jenkins Rosalind E, Farhood Anwar, Kevin Park B, Jaeschke Hartmut. Biomarkers Distinguish Apoptotic And Necrotic Cell Death During Hepatic Ischemia-Reperfusion Injury In Mice. Liver Transpl. 2014;20(11):1372–82. doi: 10.1002/lt.23958. [DOI] [PMC free article] [PubMed] [Google Scholar]
- 18.Gores GJ, Herman B, Lemasters JJ. Plasma membrane bleb formation and rupture: A common feature of hepatocellular injury. Hepatology. 1990;11:690–8. doi: 10.1002/hep.1840110425. [DOI] [PubMed] [Google Scholar]
- 19.Silva MT. Secondary necrosis: The natural outcome of the complete apoptotic program. FEBS Lett. 2010;584:4491–9. doi: 10.1016/j.febslet.2010.10.046. [DOI] [PubMed] [Google Scholar]
- 20.Hotchkiss RS, Strasser A, McDunn JE, Swanson PE. Cell death. N Engl J Med. 2009;361:1570–83. doi: 10.1056/NEJMra0901217. [DOI] [PMC free article] [PubMed] [Google Scholar]
- 21.Martin SJ, Henry CM, Cullen SP. A perspective on mammalian caspases as positive and negative regulators of inflammation. Mol Cell. 2012;46:387–97. doi: 10.1016/j.molcel.2012.04.026. [DOI] [PubMed] [Google Scholar]
- 22.Ozaki Michitaka, Haga Sanae, Ozawa Takeaki. In Vivo Monitoring of Liver Damage Using Caspase-3 Probe. Theranostics. 2012;2(2):207–14. doi: 10.7150/thno.3806. [DOI] [PMC free article] [PubMed] [Google Scholar]
- 23.Sobolev Olga, Binda Elisa, O’Farrell Sean, Lorenc Anna, Pradines Joel, Huang Yongqing, et al. Adjuvanted influenza-H1N1 vaccination reveals lymphoid signatures of age-dependent early responses and of clinical adverse events. Nature Immunology. 2016;(17):204–13. doi: 10.1038/ni.3328. [DOI] [PMC free article] [PubMed] [Google Scholar]
- 24.Asa B, Cao Y, Garry F. Antibodies to squalene in Gulf War Syndrome. Exp Mol Pathol. 2000;68(1):55–64. doi: 10.1006/exmp.1999.2295. [DOI] [PubMed] [Google Scholar]
- 25.Eid Fatma Ahmed, Mohamed Aly Fahmy, Aly Alya Mohammed, Ibrahim Nadia Fathy. Effects of swine flu (H1N1) vaccine on albino rats. Journal of Bioscience and Applied Research. 2015;1(3):113–26. [Google Scholar]
- 26.Soliman Maha G, Eid Fatma A, Aly Alya M. Squalene Immunogenicity Determination As An Adjuvant. Int J Adv Res. 2016;4(10):49–59. [Google Scholar]
- 27.Loison Emily, Poirier-Beaudouin Béatrice, Seffer Valérie, Paoletti Audrey, Abitbol Vered, Tartour Eric, Launay Odile, Gougeon Marie-Lise. Suppression by Thimerosal of Ex-Vivo CD4+ T Cell Response to Influenza Vaccine and Induction of Apoptosis in Primary Memory T Cells. PLoS One. 2014;9(4):e92705. doi: 10.1371/journal.pone.0092705. [DOI] [PMC free article] [PubMed] [Google Scholar]
- 28.Ho M. Fast-tracked swine flu vaccine under fire. Science in Society. 2009b;43:4–6. [Google Scholar]
- 29.Viera Scheibner. Adverse effects of adjuvants in vaccines. Whale. 2001;8(2):1–11. [Google Scholar]
- 30.Roan Shari. Los Angeles Times (latimes) 2009. Swine flu debacle of 1976 is recalled. [Google Scholar]
- 31.National Institute of Allergy and Infectious Diseases (NIAID) Thimerosal in Vaccines. 2009. [Google Scholar]
- 32.Sanfeliu C, Sebastia J, Ki SU. Methylmercury neurotoxicity in cultures of human neurons, astrocytes, neuroblastoma cells. Neurotoxicology. 2001;22:317–27. doi: 10.1016/S0161-813X(01)00015-8. [DOI] [PubMed] [Google Scholar]
- 33.Makani S, Gollapudi S, Yel L, Chiplunkar S, Gupta S. Biochemical and molecular basis of thimerosal-induced apoptosis in T cells: a major role of mitochondrial pathway. Genes and immunity. 2002;3:270–8. doi: 10.1038/sj.gene.6363854. [DOI] [PubMed] [Google Scholar]
- 34.Kroemer G, Reed JC. Mitochondrial control of cell death. Nature medicine. 2000;6:513–9. doi: 10.1038/74994. [DOI] [PubMed] [Google Scholar]
- 35.Kleiner DE, Chalasani NP, Lee WM, et al. Hepatic histological findings in suspected drug-induced liver injury: systematic evaluation and clinical associations. Hepatology. 2014;59(2):661–70. doi: 10.1002/hep.26709. [DOI] [PMC free article] [PubMed] [Google Scholar]
- 36.Andrade RJ, Lucena MI, Kaplowitz N, et al. Outcome of acute idiosyncratic drug-induced liver injury: long-term follow-up in a hepatotoxicity registry. Hepatology. 2006;44(6):1581–8. doi: 10.1002/hep.21424. [DOI] [PubMed] [Google Scholar]
- 37.Bjornsson E, Kalaitzakis E, Olsson R. The impact of eosinophilia and hepatic necrosis on prognosis in patients with drug-induced liver injury. Aliment Pharmacol Ther. 2007;25(12):1411–21. doi: 10.1111/j.1365-2036.2007.03330.x. [DOI] [PubMed] [Google Scholar]
- 38.Paget GE, Barnes JM. Interspecies dosage conversion scheme in evaluation of results and quantitative application in different species. Evaluation of Drug Activities, 1964: Pharmacometric. 1:160–162. [Google Scholar]
- 39.Jin Z, El-Deiry WS. Overview of cell death signaling pathways. Cancer Biol Ther. 2005;4:139–163. doi: 10.4161/cbt.4.2.1508. [DOI] [PubMed] [Google Scholar]
- 40.Bressenot Aude, Marchal Sophie, Bezdetnaya Lina, Garrier Julie, Guillemin François, Plénat François. Assessment of Apoptosis by Immunohistochemistry to Active Caspase-3, Active Caspase-7, or Cleaved PARP in Monolayer Cells and Spheroid and Subcutaneous Xenografts of Human Carcinoma. J Histochem Cytochem. 2009 Apr;57(4):289–300. doi: 10.1369/jhc.2008.952044. [DOI] [PMC free article] [PubMed] [Google Scholar]
- 41.Aydogan, Haligur M, Ozmen O. The expression of caspase-3, caspase-7, caspase-9 and cytokeratin AE1/AE3 in goats with enzootic nasal adenocarcinoma: an immunohistochemical study. Veterinarni Medicina. 2013;58(8):417–421. [Google Scholar]
- 42.Kohli V, Selzner M, Madden JF, Bentley RC, Clavien PA. Endothelial cell and hepatocyte deaths occur by apoptosis after ischemia-reperfusion injuryin the rat liver. Transplantation. 1999;67:1099–105. doi: 10.1097/00007890-199904270-00003. [DOI] [PubMed] [Google Scholar]
- 43.Sindram D, Porte RJ, Hoffman MR, Bentley RC, Clavien PA. Platelets induce sinusoidal endothelial cell apoptosis upon reperfusion of the cold ischemic rat liver. Gastroenterology. 2000;118:183–91. doi: 10.1016/S0016-5085(00)70427-6. [DOI] [PubMed] [Google Scholar]
- 44.Ikner A, Ashkenazi A. TWEAK induces apoptosis through a death-signaling complex comprising receptor-interacting protein 1 (RIP1), Fas-associated death domain (FADD), and caspase-8. J Biol Chem. 2011;286:21546–54. doi: 10.1074/jbc.M110.203745. [DOI] [PMC free article] [PubMed] [Google Scholar]
- 45.Vandenabeele P, Galluzzi L, Vanden Berghe T, Kroemer G. Molecular mechanisms of necroptosis: An ordered cellular explosion. Nat Rev Mol Cell Biol. 2010;11:700–14. doi: 10.1038/nrm2970. [DOI] [PubMed] [Google Scholar]
- 46.Galluzzi L, Kroemer G. Necroptosis: A specialized pathway of programmed necrosis. Cell. 2008;135:1161–3. doi: 10.1016/j.cell.2008.12.004. [DOI] [PubMed] [Google Scholar]
- 47.Malhi H, Gores GJ, Lemasters JJ. Apoptosis and necrosis in the liver: A tale of two deaths? Hepatology. 2006;43:S31–S44. doi: 10.1002/hep.21062. [DOI] [PubMed] [Google Scholar]
- 48.Faouzi S, Burckhardt BE, Hanson JC, Campe CB, Schrum LW, Rippe RA, Maher JJ. Anti-Fas induces hepatic chemokines and promotes inflammation by an NF-kappa B-independent, caspase-3-dependent pathway. J Biol Chem. 2001;276:49077–82. doi: 10.1074/jbc.M109791200. [DOI] [PubMed] [Google Scholar]
- 49.Yoon JH, Gores GJ. Death receptor-mediated apoptosis and the liver. llll J Hepatol. 2002;37:400–10. doi: 10.1016/S0168-8278(02)00209-X. [DOI] [PubMed] [Google Scholar]
- 50.Torbenson M, Chen YY, Brunt E, et al. Glycogenic hepatopathy: an underrecognized hepatic complication of diabetes mellitus. Am J Surg Pathol. 2006;30:508–513. doi: 10.1097/00000478-200604000-00012. [DOI] [PubMed] [Google Scholar]
- 51.Benedetti A, Jezequel AM, Orlandi F. Preferential distribution of apoptotic bodies in acinar zone 3 of normal human and rat liver. J Hepatol. 1988;7:319–24. doi: 10.1016/S0168-8278(88)80004-7. [DOI] [PubMed] [Google Scholar]
- 52.Benedetti A, Jezequel AM, Orlandi F. A quantitative evaluation of apoptotic bodies in rat liver. Liver. 1988;8:172–7. doi: 10.1111/j.1600-0676.1988.tb00987.x. [DOI] [PubMed] [Google Scholar]
- 53.Zajicek G, Oren R, Weinreb M., Jr The streaming liver. Liver. 1985;5:293–300. doi: 10.1111/j.1600-0676.1985.tb00252.x. [DOI] [PubMed] [Google Scholar]
- 54.Shimbo K, Hsu GW, Nguyen H, Mahrus S, Trinidad JC, Burlingame AL, Wells JA. Quantitative profiling of caspase-cleaved substrates reveals different drug-induced and cell-type patterns in apoptosis. Proc Natl Acad Sci U S A. 2012;109:12432–7. doi: 10.1073/pnas.1208616109. [DOI] [PMC free article] [PubMed] [Google Scholar]