

Abstract
Background
The use of oral implants has been growing, and cone beam computerized tomography (CBCT) has become the method of choice for oral and maxillofacial radiology.
Objective
To assess the accuracy of bone densitometry in two different CBCT devices in comparison with MDCT (multi-detector CT).
Methods
Different concentrations of urografin, including 2.5%, 5%, 7.5%, 10%, 12.5%, were prepared, and the Hounsfield unit of these solution was measured by two CBCT devices (SORDEX CRANEX 3D and NEWTOM 5G) and one spiral CT device (SOMATOM SENSATION). Difference of output Hounsfield units in each concentration was compared in three devices. Correlation of devices with increase of urografin dose also was evaluated. Statistical analyses of the data were performed using SPSS18 and Kruskal–Wallis and Mann–Whitney U tests, along with Spearman’s correlation coefficient.
Results
The range of gray density for NEWTOM 5G CBCT, SORDEX 3D CBCT, and SOMATOM CT imaging systems was from 781 to 2311, 427 to 1464, and 222 to 994, respectively. There was significant difference between devices in the Hounsfield unit in all urografin concentrations (p<0.001). Also there was a significant correlation between three devices with increasing the urografin dose (p<0.05; r>0.95)
Conclusion
Our findings indicated a high correlation and linear relationship between different studied imaging systems. Although utilizing CBCT in the assessment of bone density is useful according to its lower emitted dose and less cost, clinicians should be aware of the issue that the voxel value in CBCT is not as perfect as CT.
Keywords: Cone-beam computed tomography, Spiral computed tomography, Urografin, Densitometry
1. Introduction
As the use of oral implants has been growing over past two decades, the need for more specialized radiographic techniques is rising for preoperative planning of oral implant treatments (1) such as radiographic modalities utilized for different stages of implanting treatment, and various imaging techniques are available for the perioperative evaluation of the implant sites. It is obvious that conventional dental imaging procedures and systems have limited capability for preoperative planning and implant surgeries (2). The quality, quantity, and density of the jaw are important factors in implant treatment (3). Besides, mechanical characteristics are an important factor in Osseo integration and primary stability of the implant (4–8). Accurate information of bone structure will help the clinician to select the proper site, treatment plan, and surgical procedure for implant surgery (9). In the past decades, studies have demonstrated that computed tomography (CT) has become the method of choice in treatment by dental implants and provide useful information for evaluating the mandibular and maxillary anatomy (10–12). Despite the introduction of various modalities for assessing bone density (13, 14), in recent years CT has been used extensively for the assessment of the density and dimension of bone by the quantity and quality assay of medullary and cortical bone (15, 16). However, CT imaging systems are expensive and emit a relatively high radiation dose to the patient (17). Cone beam computed tomography (CBCT) is another modality for evaluation of bone density with increasing utilization (9). CBCT as a diagnostic imaging tool for dental use is now playing a pivotal role for preoperative planning and provides 3D and cross-sectional views of the jaws (18, 19). To determine the density of scanned tissues or objects evaluated by CT and CBCT devices, X-ray attenuation information provides specific sized image pixels/voxels by definition of Hounsfield units (18), based on the gray scale. CBCT produces good spatial resolution, gray density range, and contrast. Reduction of emitted dose and cost beneficence and small footprint are advantages of CBCT in contrast with CT. Dimensional accuracy of the CBCT is comparable with CT imaging systems, but the gray density of CBCT is not as complete as CT (20, 21). Also, CBCT provides more scatter radiation that affect intensity value in a CBCT imaging system, which is the weak point of this technique (15). Therefore, a distinctive method for bone density assessment has not yet been introduced (9). Limited studies have assessed the densitometry in CBCT and CT imaging systems. Nomura et al. compared bone density value in CT and CBCT and demonstrated a high correlation between voxel value of CBCT and CT number in MSCT (16). But the findings of Nackaerts et al. declined the reliability of the intensity value of CBCT (15). Altogether, according to the contradictory findings of recent studies, we aimed to assess the accuracy of bone densitometry in two different CBCT devices in comparison with MDCT (multi-detector CT).
2. Material and Methods
In this experimental study, we evaluate densitometry by utilizing a 76% concentration of urografin solution, which has a homogenous characteristic. To prepare five concentrations of urografin including 2.5%, 5%, 7.5%, 10%, and 12.5%, 2.5, 5, 7.5, 10, and 12.5 ml of urografin 76% solution were added to distilled water in order to reach a volume up to 76 ml. After that, these solutions were poured by exclusive syringes into Plexiglas cubic containers (Figure 1).
Figure 1.
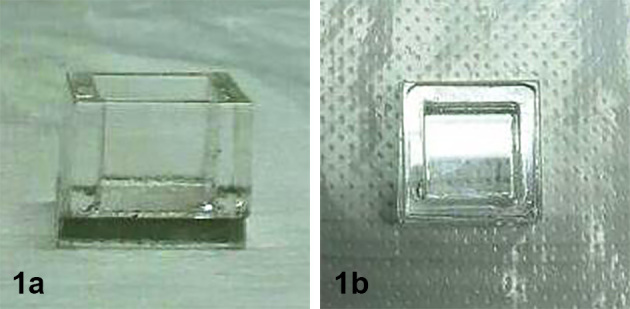
Plexiglas cubic containers used in the study.
Then images were taken by radiographic systems from each concentration. A CBCT (SORDEX CRANEX 3D, Tuusula, Finland) radiographic system with a flat panel and high resolution and 6×7 mm field of view at 89Kv tube voltage and 6 mA current with 12.6 s exposure time was conducted for imaging of mentioned urografin concentrations. Then, three coronal cuts with 0.5 mm diameter and 1 mm interval were taken. In middle areas, each segment was evaluated on the base of HU by 3D ON DEMAND software (Figure 2-A). A CBCT (NEWTOM 5G, Verona, Italy) radiographic system with a flat panel detector and high resolution and 18×16 mm field of view at 110Kv tube voltage and 1.44mA current with 4.8s exposure time was conducted for imaging of mentioned urografin concentrations. Then, three coronal cuts with 0.5 mm diameter and 1 mm interval were taken. In middle areas, each segment was evaluated on the base of gray density by NNT viewer software (Figure 2-B). An MSCT (16 slice SOMATOM SENSATION, Siemense, Germany) radiographic system with 0.28 pixel resolution, 0.6 collimation, and 600 ms rotation with 0.75 pitch at 120Kv tube voltage with 20s exposure time was conducted for imaging of mentioned urografin concentrations. Then, three coronal cuts with 0.75 mm diameter and 0.5 mm intervals were taken. In middle areas, each segment was evaluated on the base of HU by Signora Software. Quantitative analysis was conducted by SPSS 18. Kruskal–Wallis test was used to compare means in three systems. Then, a Mann–Whitney U test was used for comparing means between each two systems. Correlation between gray density of different systems was tested using the Spearman’s correlation coefficient. Scatter plot figures also were designed for determining the linear relationship of gray density in imaging systems. A p-value less than 0.05 was considered significant for the statistical tests.
Figure 2.

Measurement method of Hounsfield unit in SORDEX CRANEX 3D device (A) and vv in NEWTOM 5G device (B).
3. Results
Quantitative data of density for various sections of five urografin concentrations (2.5 %, 5%, 7.5%, 10%, and 12.5%) for three imaging systems (NEWTOM 5G CBCT, SORDEX 3D CBCT, SOMATOM CT) were described by mean values and standard deviation (SD), median, minimum, and maximum (Table 1).
Table 1.
Bone density values (Hounsfield unit) according to three imaging systems
| Concentration | Imaging system | Mean | SD | Median | Minimum | Maximum | p-value |
|---|---|---|---|---|---|---|---|
| 2.5% | Newtome5G | 781 | 10 | 780 | 763 | 801 | <0.001 |
| Somatom | 222.07 | 7 | 225 | 210 | 231 | ||
| Sordex 3D | 427 | 87 | 408 | 312 | 626 | ||
| 5% | Newtome5G | 1317.05 | 37.04 | 1325 | 1220 | 1338 | <0.001 |
| Somatom | 473 | 1 | 474 | 470 | 475 | ||
| Sordex 3D | 818 | 38.05 | 813.05 | 755 | 887 | ||
| 7.5% | Newtome5G | 1746 | 18 | 1753 | 1753 | 1775 | <0.001 |
| Somatom | 659 | 1 | 659 | 656 | 662 | ||
| Sordex 3D | 1026 | 99 | 1002 | 891 | 1241 | ||
| 10% | Newtome5G | 2050 | 13 | 2050 | 2022 | 2064 | <0.001 |
| Somatom | 833 | 2 | 833 | 828 | 837 | ||
| Sordex 3D | 1288 | 47 | 1283 | 1206 | 1376 | ||
| 12.5% | Newtome5G | 2311 | 16 | 2311 | 2287 | 2347 | <0.001 |
| Somatom | 994 | 3 | 995 | 989 | 999 | ||
| Sordex 3D | 1464 | 85.04 | 1472 | 1286 | 1577 |
The range of gray density for NEWTOM 5G CBCT, SORDEX 3D CBCT, and SOMATOM CT imaging systems were from 781 to 2311, 427 to 1464, and 222 to 994, respectively (Figure 3). As indicated in Table 1, according to the Kruskal–Wallis test, the difference between the gray density of three imaging systems in five studied concentrations were statistically significant (p<0.001). The one-by-one analysis using Mann–Whitney U test between imaging systems also revealed significant differences (p<0.001). According to Figure 1, by increasing the urografin concentrations, the gray density of imaging systems is increased significantly in different systems (p<0.001). The Spearman’s correlation coefficients revealed a statistically significant correlation between the compared systems. The data collected from different imaging systems were plotted against their objects’ known densities. The scatter plots visually identify the relationships between the studied devices and presence of a close linear association between the density from the objects between systems with R2 values more than 0.90 were demonstrated (Figure 4–6).
Figure 3.

Comparison of gray density in various doses among imaging systems
Figure 4.

Scatter plot for Somatom and Newtome5G
Figure 5.

Scatter plot for Sordex 3D and Newtome5G imaging systems
Figure 6.

Scatter plot for Sordex 3D and Somatom imaging systems
4. Discussion
In this study, we analyzed the relationship between gray density and voxel value (VV) of two CBCT imaging systems and CT. According to our results, there was a high correlation and linear relationship between different studied imaging systems. Arisan et al. in a recent study aimed at detecting the relationship between CT and CBCT-based gray density; the authors demonstrated gray density ranging from 167 to 989 HU and from 229 to 1042 vv. In the present study aimed at detecting the relationship between CT and CBCT-based gray density and demonstrated gray density in Newtom 5G CBCT ranging from 781 to 2311, gray density in Sordex 3D CBCT ranged from 427 HU to 1464 HU and gray density in Somatom CT ranged from 222 HU to 994 HU. According to their findings, the gray density in CBCT is higher than in CT (22). This phenomenon appeared due to various technical factors such as scatter radiation, X-ray beam hardening, and “projection data discontinuity-related effect”—all of which caused reduction in the dynamic contrast of the CBCT scanners in contrast with multi-slice CT. The present study demonstrated that, by increasing the concentration of urografin solution, the gray density of each system is proportionally increased. This finding seemed to be reasonable because if concentration of the urografin solution is increased, the attenuation of X-ray beam is increased, too, which resulted in the increase of gray density. In an in-vitro study, Nomura et al. investigated the possibility of the evaluation the bone marrow density (BMD) using vv from CBCT for dental use and concluded a high correlation between the vv of CBCT and the numbers of MSCT. Their study was based on various concentrations of iodine solution, which were maged by multi-slice CT and CBCT. The authors demonstrated that, by increasing the concentration of iodine solution, the gray density is increased in contrast with our findings; the gray density in CBCT ranged from 63.8 to 254.6, gray density in CT ranged from 6.4 to 1935.7; thus gray density in CT was higher than in CBCT. The authors determined the conversion formula of gray density for CBCT and CT imaging systems in order to provide a more accurate ascertainment of bone density with CBCT (16). In another study, Cassetta et al. aimed to evaluate gray density of CT and CBCT and the relationship in human mandibles. They demonstrated gray density in CBCT ranging from 816vv to 1505vv and gray density in CT ranging from 572 HU 1354 HU. According to their results, gray density of CBCT is higher than in CT. However, there is an excellent correlation between CT and CBCT (3). There are similar studies consistent with our findings, which demonstrated positive correlation. Isoda et al. aimed to determine the correlation between bone density measured by CBCT and primary stability of dental implants. The authors indicated that CBCT was an appropriate system for preoperative bone density estimation for clinicians to predict implant stability (23). But a 2011 study by Nackaerts and colleagues revealed that the use of intensity value in CBCT image was not reliable, despite wide utilization of CBCT in pre- or post -oral and maxillofacial interventions (15). Although the accuracy of CBCT in dental densitometry was the target of various research, the strong points and limitations of CBCT utilization and accuracy remain matters of controversy. Therefore, further investigations with good quality study designs are required for achieving more reliable results.
5. Conclusions
Our findings indicate a high correlation and linear relationship between different studied imaging systems. Although utilizing CBCT in the assessment of the bone density is useful according to its lower emitted dose and less cost, clinicians should be aware of the issue that the vv in CBCT is not as accurate as CT. Thus, by using the characterized conversion formula, we are able to convert the gray density into CT.
Acknowledgments
Financial support of this research project was granted (#9237313) by the vice chancellor for research and technology of Babol University of Medical Sciences.
Footnotes
iThenticate screening: November 29, 2016, English editing: February 08, 2017, Quality control: March 17, 2017
Conflict of Interest:
There is no conflict of interest to be declared.
Authors’ contributions:
All authors contributed to this project and article equally. All authors read and approved the final manuscript.
References
- 1.BouSerhal C, Jacobs R, Quirynen M, van Steenberghe D. Imaging technique selection for the preoperative planning of oral implants: a review of the literature. Clin Implant Dent Relat Res. 2002;4(3):156–72. doi: 10.1111/j.1708-8208.2002.tb00167.x. [DOI] [PubMed] [Google Scholar]
- 2.Garg AK, Vicari A. Radiographic modalities for diagnosis and treatment planning in implant dentistry. Implant Soc. 1995;5(5):7–11. [PubMed] [Google Scholar]
- 3.Cassetta M, Stefanelli LV, Pacifici A, Pacifici L, Barbato E. How Accurate Is CBCT in Measuring Bone Density? A Comparative CBCT-CT In Vitro Study. Clin Implant Dent Relat Res. 2014;16(4):471–8. doi: 10.1111/cid.12027. [DOI] [PubMed] [Google Scholar]
- 4.Cassetta M, Di Mambro A, Giansanti M, Stefanelli LV, Cavallini C. The intrinsic error of a stereolithographic surgical template in implant guided surgery. Int J Oral Maxillofac Surg. 2013;42(2):264–75. doi: 10.1016/j.ijom.2012.06.010. [DOI] [PubMed] [Google Scholar]
- 5.Cassetta M, Giansanti M, Di Mambro A, Calasso S, Barbato E. Accuracy of two stereolithographic surgical templates: a retrospective study. Clin Implant Dent Relat Res. 2013;15(3):448–59. doi: 10.1111/j.1708-8208.2011.00369.x. [DOI] [PubMed] [Google Scholar]
- 6.Cassetta M, Stefanelli LV, Di Carlo S, Pompa G, Barbato E. The accuracy of CBCT in measuring jaws bone density. Eur Rev Med Pharmacol Sci. 2012;16(10):1425–9. [PubMed] [Google Scholar]
- 7.Cassetta M, Stefanelli LV, Giansanti M, Calasso S. Accuracy of implant placement with a stereolithographic surgical template. Int J Oral Maxillofac Implants. 2012;27(3):655–63. [PubMed] [Google Scholar]
- 8.Cassetta M, Stefanelli LV, Giansanti M, Di Mambro A, Calasso S. Depth deviation and occurrence of early surgical complications or unexpected events using a single stereolithographic surgi-guide. Int J Oral Maxillofac Surg. 2011;40(12):1377–87. doi: 10.1016/j.ijom.2011.09.009. [DOI] [PubMed] [Google Scholar]
- 9.Shapurian T, Damoulis PD, Reiser GM, Griffin TJ, Rand WM. Quantitative evaluation of bone density using the Hounsfield index. Int J Oral Maxillofac Implants. 2006;21(2):290–7. [PubMed] [Google Scholar]
- 10.Bernaerts A, Vanhoenacker FM, Chapelle K, Hintjens J, Parizel PM. The role of dental CT imaging in dental implantology. JBR-BTR. 2006;89(1):32–42. [PubMed] [Google Scholar]
- 11.Reddy MS, Mayfield-Donahoo T, Vanderven FJ, Jeffcoat MK. A comparison of the diagnostic advantages of panoramic radiography and computed tomography scanning for placement of root form dental implants. Clin Oral Implants Res. 1994;5(4):229–38. doi: 10.1034/j.1600-0501.1994.050406.x. [DOI] [PubMed] [Google Scholar]
- 12.Sato S, Arai Y, Shinoda K, Ito K. Clinical application of a new cone-beam computerized tomography system to assess multiple two-dimensional images for the preoperative treatment planning of maxillary implants: case reports. Quintessence Int. 2004;35(7):525–8. [PubMed] [Google Scholar]
- 13.Cassetta M, Della’quila D, Dolci A. Healing times after bone grafts. Dental Cadmos. 2008;76(4):27–36. [Google Scholar]
- 14.Cassetta M, Della’quila D, Dolci A. Reconstruction of atrophic alveolar ridge. Dental Cadmos. 2008;76(6):17–27. [Google Scholar]
- 15.Nackaerts O, Maes F, Yan H, Couto Souza P, Pauwels R, Jacobs R. Analysis of intensity variability in multislice and cone beam computed tomography. Clin Oral Implants Res. 2011;22(8):873–9. doi: 10.1111/j.1600-0501.2010.02076.x. [DOI] [PubMed] [Google Scholar]
- 16.Nomura Y, Watanabe H, Honda E, Kurabayashi T. Reliability of voxel values from cone-beam computed tomography for dental use in evaluating bone mineral density. Clin Oral Implants Res. 2010;21(5):558–62. doi: 10.1111/j.1600-0501.2009.01896.x. [DOI] [PubMed] [Google Scholar]
- 17.Monsour PA, Dudhia R. Implant radiography and radiology. Aust Dent J. 2008;53(Suppl 1):S11–25. doi: 10.1111/j.1834-7819.2008.00037.x. [DOI] [PubMed] [Google Scholar]
- 18.Guerrero ME, Jacobs R, Loubele M, Schutyser F, Suetens P, van Steenberghe D. State-of-the-art on cone beam CT imaging for preoperative planning of implant placement. Clin Oral Investig. 2006;10(1):1–7. doi: 10.1007/s00784-005-0031-2. [DOI] [PubMed] [Google Scholar]
- 19.Ito K, Gomi Y, Sato S, Arai Y, Shinoda K. Clinical application of a new compact CT system to assess 3-D images for the preoperative treatment planning of implants in the posterior mandible A case report. Clin Oral Implants Res. 2001;12(5):539–42. doi: 10.1034/j.1600-0501.2001.120516.x. [DOI] [PubMed] [Google Scholar]
- 20.Yajima A, Otonari-Yamamoto M, Sano T, Hayakawa Y, Otonari T, Tanabe K, et al. Cone-beam CT (CB Throne) applied to dentomaxillofacial region. Bull Tokyo Dent Coll. 2006;47(3):133–41. doi: 10.2209/tdcpublication.47.133. [DOI] [PubMed] [Google Scholar]
- 21.Casseta M, Tarantino F, Classo S. CAD-CAM systems in titanium customized abutment construction. Dental Cadmos. 2010;78(4):27–44. [Google Scholar]
- 22.Arisan V, Karabuda ZC, Avsever H, Ozdemir T. Conventional multi-slice computed tomography (CT) and cone-beam CT (CBCT) for computer-assisted implant placement. Part I: relationship of radiographic gray density and implant stability. Clin Implant Dent Relat Res. 2013;15(6):893–906. doi: 10.1111/j.1708-8208.2011.00436.x. [DOI] [PubMed] [Google Scholar]
- 23.Isoda K, Ayukawa Y, Tsukiyama Y, Sogo M, Matsushita Y, Koyano K. Relationship between the bone density estimated by cone-beam computed tomography and the primary stability of dental implants. Clin Oral Implants Res. 2012;23(7):832–6. doi: 10.1111/j.1600-0501.2011.02203.x. [DOI] [PubMed] [Google Scholar]