

Abstract
Expression of the nucleolar chaperones nucleolin (NCL) and nucleophosmin (NPM1), upstream binding transcription factor (UBTF), rRNA18S, rRNA28S, and several genes encoding ribosomal proteins (RPs) is decreased in frontal cortex area 8 at advanced stages of Alzheimer’s disease (AD). This is accompanied by reduced protein levels of elongation factors eEF1A and eEF2. Changes are more marked in AD cases with rapid course (rpAD), as initiation factor eIF3η is significantly down-regulated and several RP genes up-regulated in rpAD when compared with typical AD. These changes contrast with those seen in APP/PS1 transgenic mice used as a model of AD-like β-amyloidopathy; Ncl mRNA, rRNA18S, rRNA28S and seven out of fifteen assessed RP genes are up-regulated in APP/PS1 mice aged 20 months; only eEF2 protein levels are reduced in transgenic mice. Our findings show marked altered expression of molecules linked to the protein synthesis machinery from the nucleolus to the ribosome in frontal cortex at terminal stages of AD which differs from that seen in APP/PS1 transgenic mice, thus further suggesting that molecular signals in mouse models do not apply to real human disease counterparts.
Keywords: Alzheimer’s disease, protein synthesis, nucleolar chaperones, rRNAs, transcription, translation, APP/PS1 transgenic mouse
Introduction
Brain atrophy in Alzheimer’s disease (AD) and other neurodegenerative diseases is commonly considered the result of a combination of factors including nerve cell atrophy, nerve cell loss and reduced myelin fibers in the white matter. Since nerve cell loss is produced as a consequence of neuron death whatever the mechanism involved, neuron atrophy implies increased catabolism, reduced protein and other biomolecule/substrate synthesis, or a mixed scenario. In certain settings, reduced protein synthesis may lead to neuronal atrophy but also to cell death. Despite the importance of altered protein synthesis in AD, most data come from individual observations which focus on the nucleolus and the ribosome. The surface of nuclear organizer region (NOR)/total nucleus surface is reduced [1,2], the rRNA gene promoter is hyper-methylated, suggesting epigenetic rRNA silencing [3], rRNA levels are reduced, there is increased RNA oxidation [4-10], the expression of certain transcription factors is reduced [11-13], and incorporation of S35 methionine into AD brain ribosomes is decreased [9,14].
Here we report a detailed study of the dentate gyrus and hippocampus at different stages of AD showing altered mRNA and protein expression of nucleolar chaperones nucleolin (NCL), nucleophosmin (NPM1) and nucleoplasmin 3 (NPM3), and upstream binding transcription factor RNA polymerase I (UBTF); altered 28SRNA; decreased expression of genes encoding ribosomal proteins; and altered protein expression of several initiation and elongation translation factors [15]. Since these alterations are region-dependent (they differ in CA1 and dentate gyrus), we decided to analyze frontal cortex area 8 at terminal stages of AD using the same probes and methods. We also compared AD cases with the typical clinical course of cases with rapid clinical course (rpAD) [16] to learn whether differences in disease progression are associated with particular changes in the protein synthesis machinery. Finally, we compared changes in AD with those seen in the somatosensory cortex of APP/PS1 transgenic mice used as a model of AD-like β-amyloidopathy.
Material and methods
Subjects
Brain tissue was obtained from the Institute of Neuropathology HUB-ICO-IDIBELL Biobank and the Hospital Clinic-IDIBAPS Biobank following the guidelines of Spanish legislation on this matter and the approval of the local ethics committee. Processing of brain tissue has been detailed elsewhere [17]. The post-mortem interval between death and tissue processing was from 3 to 18 hours. One hemisphere was immediately cut in coronal sections, 1 cm thick, and selected areas of the encephalon were rapidly dissected, frozen on metal plates over dry ice, placed in individual air-tight plastic bags and stored at -80°C until use for biochemical studies. The other hemisphere was fixed by immersion in 4% buffered formalin for 3 weeks for morphological studies. Neuropathological diagnosis in all cases was based on the routine study of 20 selected de-waxed paraffin sections comprising different regions of the cerebral cortex, diencephalon, thalamus, brain stem and cerebellum, which were stained with haematoxylin and eosin, and Klüver-Barrera, and for immunohistochemistry for microglia, glial fibrillary acidic protein, β-amyloid, phosphorylated tau (clone AT8), α-synuclein, TDP-43, ubiquitin and p62. Stages of neurofibrillary tangle pathology [18,19], phases of AD-related β-amyloid plaques [20] and ABC score were assigned according to current consensus guidelines [21]. All AD cases were sporadic. Neuropathological data were assessed by two independent observers. AD cases were 5 men and 3 women, mean age 85 ± 5.7 years; rpAD cases were 4 men and 4 women, mean age 79.2 ± 5.1 years. AD and rpAD cases had similar degrees of AD-related pathology. We used as controls middle-aged cases (MA, n = 12: 7 men, 5 women; mean age 59.9 ± 15.5 years) who had not suffered from neurologic, psychiatric, or metabolic diseases (including metabolic syndrome), and did not have abnormalities in the neuropathological examination excepting Braak stage I-II of NFT pathology with no β-amyloid deposition. A summary of human cases is shown in Table 1.
Table 1.
Summary of human cases used in the present study
| Case | Diagnosis | Gender | Age | PM delay | RIN | WB |
|---|---|---|---|---|---|---|
| 1 | MA | M | 64 | 8 h 30 | 7.7 | X |
| 2 | MA | M | 56 | 5 h | 7.1 | X |
| 3 | MA | M | 67 | 5 h | 7 | X |
| 4 | MA | M | 62 | 3 h | 7.2 | X |
| 5 | MA | M | 52 | 4 h 40 m | 7.9 | X |
| 6 | MA | M | 30 | 4 h 10 m | 8.4 | X |
| 7 | MA | M | 53 | 3 h | 7.7 | X |
| 8 | MA | F | 49 | 7 h | 8.2 | X |
| 9 | MA | F | 75 | 3 h | 6.5 | X |
| 10 | MA | F | 46 | 9 h 35 m | 7.2 | X |
| 11 | MA | F | 86 | 4 h 15 m | 8.4 | X |
| 12 | MA | F | 79 | 3 h 35 m | 8 | X |
| 13 | AD | F | 89 | 8 h 50 m | 6.5 | X |
| 14 | AD | M | 81 | 7 h 30 m | 6.1 | X |
| 15 | AD | M | 91 | 7 h | 7.3 | X |
| 16 | AD | F | 86 | 9 h | 7.3 | X |
| 17 | AD | M | 92 | 7 h 45 m | 6.5 | X |
| 18 | AD | F | 84 | 7 h 45 m | 7.1 | X |
| 19 | AD | M | 82 | 5 h | 7.1 | X |
| 20 | AD | M | 75 | 8 h 15 m | 6.5 | X |
| 21 | rpAD | M | 69 | 18 h | 7.2 | X |
| 22 | rpAD | F | 85 | 6 h | 6.4 | X |
| 23 | rpAD | F | 76 | 18 h | 6 | X |
| 24 | rpAD | F | 79 | 5 h 30 m | 6.9 | X |
| 25 | rpAD | M | 83 | 5 h 30 m | 6.4 | X |
| 26 | rpAD | M | 83 | 8 h 20 m | 6.6 | X |
| 27 | rpAD | F | 81 | 6 h | 6.8 | X |
| 28 | rpAD | M | 78 | 3 h 30 m | 7 | X |
MA: middle-aged individuals with no neurological symptoms and no brain lesions on neuropathological study. AD: Alzheimer’s disease cases with typical prolonged advanced dementia, Braak stage V-VI of neurofibrillary tangle pathology, Thal phase of β-amyloid and CERAD score C; rpAD: cases with clinical and neuropathological characteristics similar to AD but with a rapid course equal to or less than 2 years. M: male; F: female; PM delay: post-mortem delay; RIN: RNA integrity number (cases assessed with RT-qPCR); WB: cases used for western blotting.
APP/PS1 mice
APP/PS1 mice and wild-type (WT) littermates aged 3, 12 and 20 months (n = 7 for each phenotype and time-period; total number of animals = 42) were used. Mice expressing human mutated forms APPswe and PS1dE9 [22] show the first β-amyloid deposits at the age of 3 months and altered memory and learning capacities by the age of six months [23]. Animals were maintained under standard animal housing conditions in a 12-hour dark-light cycle with free access to food and water. Transgenic mice were characterized by genotyping from genomic DNA isolated from tail clips using the polymerase chain reaction (PCR) conditions proposed. Animals were kept under the same conditions as stated above. All animal procedures were conducted according to ethical guidelines (European Communities Council Directive 86/609/EEC) and were approved by the local ethics committee.
RNA purification
Purification of RNA from right frontal cortex area 8 in human cases and somatosensory cortex in mice aged 3, 12 and 20 months (n = 7 per age and phenotype) was carried out using RNeasy Lipid Tissue Mini Kit (Qiagen, Hilden, Germany) following the protocol provided by the manufacturer, and performing the optional DNase digest to avoid extraction and subsequent amplification of genomic DNA. The concentration of each sample was obtained from A260 measurements with a NanoDrop 2000 spectrophotometer (Thermo Scientific, Waltham, MA, USA). RNA integrity was tested using the Agilent 2100 BioAnalyzer (Agilent, Santa Clara, CA, USA). Values for RNA integrity number (RIN) varied from 6.1 to 8.4 in human cases (Table 1). Post-mortem delay had no effect on RIN values in the present series (Table 1). RIN values in mice were greater than 8.
Retrotranscription reaction
Retrotranscription reaction of RNA samples selected based on their RIN values was carried out with the High-Capacity cDNA Archive kit (Applied Biosystems, Foster City, California, USA) following the guidelines provided by the manufacturer, and using Gene Amp® 9700 PCR System thermocycler (Applied Biosystems). A parallel reaction for one RNA sample was processed in the absence of reverse transcriptase to rule out DNA contamination.
Real time PCR
Real Time quantitative PCR (RT-qPCR) assays were conducted in duplicate on 1,000 ng of cDNA samples obtained from the retrotranscription reaction, diluted 1:20 in 384-well optical plates (Kisker Biotech, Steinfurt, GE) utilizing the ABI Prism 7900 HT Sequence Detection System (Applied Biosystems). Parallel amplification reactions were carried out using 20× TaqMan Gene Expression Assays and 2× TaqMan Universal PCR Master Mix (Applied Biosystems). Human and mouse TaqMan probes are shown in Table 2A and 2B, respectively.
Table 2A.
Probes used for RT-qPCR analysis in human cases
| Gene | Full name | Reference |
|---|---|---|
| Housekeeping genes | ||
| GUS-B | β-glucuronidase | Hs00939627_m1 |
| XPNPEP1 | X-prolylaminopeptidase (aminopeptidase P) 1 | Hs00958026_m1 |
| AARS | Alanyl-tRNA synthetase | Hs00609836_m1 |
| HPRT | Hypoxanthine phosphoribosyltransferase 1 | Hs_02800695_m1 |
| Nucleolar, rRNAs and genes encoding ribosomal protein | ||
| NCL | Nucleolin | Hs01066668_m1 |
| NPM1 | Nucleophosmin (nucleolar phospho-protein B23, numatrin) | Hs02339479_m1 |
| rRNA 28S | RNA, 28S ribosomal 5 | Hs03654441_s1 |
| rRNA 18S | Eukaryotic 18S rRNA | Hs99999901_s1 |
| UBTF | Upstream binding transcription factor, RNA polymerase I | Hs01115792_g1 |
| RPL5 | Ribosomal protein L5 | Hs_03044958_g1 |
| RPL7 | Ribosomal protein L7 | Hs_02596927_g1 |
| RPL21 | Ribosomal protein L21 | Hs_00823333_s1 |
| RPL22 | Ribosomal protein L22 | Hs_01865331_s1 |
| RPL23A | Ribosomal protein L23A | Hs_01921329_g1 |
| RPL26 | Ribosomal protein L26 | Hs_00864008_m1 |
| RPL27 | Ribosomal protein L27 | Hs_03044961_g1 |
| RPL30 | Ribosomal protein L30 | Hs_00265497_m1 |
| RPL31 | Ribosomal protein L31 | Hs_0101549_g1 |
| RPS3A | Ribosomal protein S3A | Hs_00832893_sH |
| RPS5 | Ribosomal protein S5 | Hs_00734849_g1 |
| RPS6 | Ribosomal protein S6 | Hs_04195024_g1 |
| RPS10 | Ribosomal protein S10 | Hs_01652370_gH |
| RPS13 | Ribosomal protein S13 | Hs_01011487_g1 |
| RPS16 | Ribosomal protein S16 | Hs_01598516_g1 |
| RPS17 | Ribosomal protein S17 | Hs_00734303_g1 |
Table 2B.
Probes used for RT-qPCR analysis in mice
| Gene | Full name | Reference |
|---|---|---|
| Housekeeping genes | ||
| Gus-B | β-glucuronidase | Mm01197698_m1 |
| Xpnpep11 | X-prolylaminopeptidase (aminopeptidase P) 1 | Mm00460040_m1 |
| Aars | Alanyl-tRNA synthetase | Mm00507627_m1 |
| Hprt | Hypoxanthine phosphoribosyltransferase 1 | Mm01545399_m1 |
| Nucleolar, rRNAs and genes encoding ribosomal protein | ||
| Ncl | Nucleolin | Mm01290591_m1 |
| Npm3 | Nucleophosmin/nucleoplasmin 3 | Mm00784254_s1 |
| rRNA 28S | RNA, 28S ribosomal 5 | Mm03682676_s1 |
| rRNA 18S | Eukaryotic 18S rRNA | Mm03928990_g1 |
| Ubtf | Upstream binding transcription factor, RNA polymerase I | Mm00456972_m1 |
| Rpl5 | Ribosomal protein L5 | Mm00847026_g1 |
| Rpl7 | Ribosomal protein L7 | Mm02342562_gH |
| Rpl21 | Ribosomal protein L21 | Mm01216752_m1 |
| Rpl22 | Ribosomal protein L22 | Mm04410429_m1 |
| Rpl23a | Ribosomal protein L23A | Mm01614208_gH |
| Rpl26 | Ribosomal protein L26 | Mm02343715_g1 |
| Rpl27 | Ribosomal protein L27 | Mm01245874_g1 |
| Rpl30 | Ribosomal protein L30 | Mm01611464_g1 |
| Rps3A | Ribosomal protein S3A | Mm00656272_m1 |
| Rps5 | Ribosomal protein S5 | Mm00501433_m1 |
| Rps6 | Ribosomal protein S6 | Mm01263489_m1 |
| Rps10 | Ribosomal protein S10 | Mm02391992_g1 |
| Rps13 | Ribosomal protein S13 | Mm01731324_g1 |
| Rps16 | Ribosomal protein S16 | Mm01617542_g1 |
| Rps17 | Ribosomal protein S17 | Mm01314921_g1 |
Parallel assays for each sample were carried out using probes for β-glucuronidase (GUS-β), X-prolyl aminopeptidase (aminopeptidase P) 1 (XPNPEP1), alanyl-transfer RNA synthase (AARS) and hypoxanthine-guanine phosphoribosyltranferase (HPRT) for normalization. Housekeeping genes were selected because they show no modifications in several neurodegenerative diseases in human post-mortem brain tissue [24,25]. The reactions were performed using the following parameters: 50°C for 2 min, 95°C for 10 min, 40 cycles at 95°C for 15 s and 60°C for 1 min. TaqMan PCR data were captured using the Sequence Detection Software (SDS version 2.2, Applied Biosystems). Subsequently, threshold cycle (CT) data for each sample were analyzed with the double delta CT (ΔΔCT) method. First, delta CT (ΔCT) values were calculated as the normalized CT values for each target gene in relation to the mean of endogenous controls GUS-β, XPNPEP1, AARS and HPRT in humans, whereas in mice hprt was the housekeeping gene selected for normalization. Second, ΔΔCT values were obtained with the ΔCT of each sample minus the mean ΔCT of the population of control samples (calibrator samples). The fold-change was determined using the equation 2-ΔΔCT.
Gel electrophoresis and western blotting from total homogenate
0.1 g of sample tissue (n = 28) from frontal cortex area 8 in human cases and 0.1 g of somatosensory cortex in mice aged 3, 12 and 20 months (n = 7 per age and phenotype) were lysed with a glass homogenizer in Mila lysis buffer (0.5 M Tris at pH 7.4 containing 0.5 methylenediaminetetraacetic acid at pH 8.0, 5 M NaCl, 0.5% Na doxicholic, 0.5% Nonidet P-40, 1 mM phenylmethylsulfonyl fluoride, bi-distilled water, protease and phosphatase inhibitor cocktails (Roche Molecular Systems, Pleasanton, CA, USA), and then centrifuged for 15 min at 13,000 g in human cases and for 10 min at 5,000 g in mice, at 4°C (Ultracentrifuge Beckman with 70Ti rotor, CA, USA). Protein concentration was measured with a SmartspectTMplus spectrophotometer (Bio-Rad, CA, USA) using the Bradford method (Merck, Darmstadt, Germany). Samples containing 15μg of protein and the standard Precision Plus ProteinTM Dual Color (Bio-Rad) were loaded onto 10-15% w/v acrylamide gels. Proteins were separated in sodium dodecylsulfate-polyacrylamide gel electrophoresis (SDS-PAGE) and electrophoretically transferred to nitrocellulose membranes using the Trans-Blot®TurboTM transfer system (Bio-Rad) at 200 mA/membrane for 40 min for human samples and at 50 mA/membrane overnight for mouse samples. Non-specific bindings were blocked by incubation in 5 w/v% dry milk in Tris-buffered saline (TBS) containing 0.1% v/v Tween for 1 hour at room temperature. After washing, the membranes were incubated at 4°C overnight with one of the primary antibodies in TBS containing 3% w/v albumin and 0.1% v/v Tween. Primary antibodies are detailed in Table 3. Monoclonal antibody anti-β-actin diluted 1:30,000 (β-actin, A5316; Sigma-Aldrich, St. Louis, MO, USA) was blotted for the control of protein loading in human samples and monoclonal anti-GAPDH (glyceraldehydes 3-phosphate dehydrogenase, ADI-CSA-335-E; Enzo Life Sciences, Inc., Farmingdale, NY, USA) diluted 1:5,000 for mouse samples. Following incubation with one of the primary antibodies, membranes were incubated for 1 hour with the appropriate HRP-conjugated secondary antibody (1:2,000, Dako, Glostrup, Denmark), and the immune complexes were revealed with a chemiluminescence reagent (ECL, Amersham, GE Healthcare, Buckinghamshire, UK).
Table 3.
Primary antibodies used in the present study including reference, supplier, host and dilution
| Antibody (anti-) | Reference | Supplier | Host | Dilution |
|---|---|---|---|---|
| β-actin | A5316 | Sigma-Aldrich, St Louis, MO, USA | Ms | 1/30000 |
| eIF2α (eukaryotic initiation factor 2α) | 5A5 | Thermo Fisher Sci, Waltham, MA, USA | Ms | 1/50 |
| eIF3η (eukaryotic initiation factor 3η) | sc 2887 | Santa Cruz, Dallas, TX, USA | Rb | 1/200 |
| eIF5 (eukaryotic initiation factor 5) | sc.282 | Santa Cruz, Dallas, TX, USA | Rb | 1/400 |
| eEF1A (eukaryotic elongation factor 1A) | 2551 | Cell Signaling, Danvers, MA, USA | Rb | 1/100 |
| eEF2 (eukaryotic elongation factor 2) | 2332 | Cell Signaling, Danvers, MA, USA | Ms | 1/1,000 |
| GAPDH (glyceraldehyde 3-phosphate dehydrogenase) | ADI-CSA-335-E | Enzo Life Sciences, Incl., Farmingdale, NY, USA | Ms | 1/5000 |
| P-eIF2α (phospho-eukaryotic initiation factor 2α pSer51) | S.674.5 | Thermo Fisher Sci, Waltham, MA, USA | Rb | 1/50 |
Statistical analysis
The normality of distribution of the mean fold-change values obtained by RT-qPCR for every region and stage between controls and pathological cases was analyzed with the Kolmogorov-Smirnov test. The non-parametric Mann-Whitney test was performed to compare each group when the samples did not follow a normal distribution whereas the unpaired t test was used for normal variables. Statistical analysis was performed with GraphPad Prism version 5.01 (La Jolla, CA, USA) and Statgraphics Statistical Analysis and Data Visualization Software version 5.1 (Warrenton, VA, USA). Differences between groups were considered statistically significant at p-values: *P<0.05, **P<0.01 and ***P<0.001.
Densitometry of western blot bands was assessed with the TotalLab program (TotalLab Quant, Newcastle, UK) and subsequently analyzed with GraphPad Prism and Statgraphics Statistical Analysis, and Data Visualization Software version 5.1 (VA, USA), with one-way ANOVA with post-hoc Tukey’s range test for multiple comparisons; differences were considered statistically significant with p-values: *P<0.05; **P<0.01; ***P<0.001.
Results
Human cases: AD and rpAD
mRNA expression levels of nucleolar proteins, 18S and 28S rRNA and ribosomal proteins in frontal cortex area 8 in MA, AD and rpAD
Genes encoding nucleolar proteins nucleophosmin 1 (NPM1) and nucleolin (NCL), and upstream binding transcription factor (UBTF) were significantly down-regulated in AD (p values ranged from <0.05 to <0.01) and in rpAD (p values from <0.05 to <0.01) compared with MA. rRNA18S and rRNA28S expression levels were reduced in AD and rpAD (p values from <0.001 to <0.001). No significant differences were observed when comparing AD with rpAD (Table 4).
Table 4.
mRNA expression of genes coding for selected nucleolar and ribosomal proteins, rRNA18S and rRNA28S in frontal cortex area 8 in MA, AD and rpAD
| MA | AD | rpAD | MA vs AD | MA vs rpAD | AD vs rpAD | |
|---|---|---|---|---|---|---|
| UBTF | 1.069 ± 0.444 | 0.602 ± 0.124 | 0.574 ± 0.085 | *↓ | **↓ | - |
| NPM1 | 1.078 ± 0.476 | 0.531 ± 0.077 | 0.593 ± 0.144 | **↓ | *↓ | - |
| NCL | 1.083 ± 0.472 | 0.646 ± 0.098 | 0.673 ± 0.123 | *↓ | *↓ | - |
| rRNA18S | 1.038 ± 0.270 | 0.702 ± 0.303 | 0.578 ± 0.126 | *↓ | ***↓ | - |
| rRNA28S | 1.113 ± 0.617 | 0.423 ± 0.230 | 0.385 ± 0.085 | **↓ | *↓ | - |
| RPL5 | 1.008 ± 0.130 | 1.010 ± 0.165 | 1.039 ± 0.155 | - | - | - |
| RPL7 | 1.007 ± 0.120 | 1.029 ± 0.183 | 1.091 ± 0.051 | - | - | - |
| RPL21 | 1.085 ± 0.492 | 1.606 ± 0.559 | 1.606 ± 0.545 | *↑ | *↑ | - |
| RPL22 | 1.013 ± 0.165 | 0.835 ± 0.139 | 0.855 ± 0.083 | *↓ | *↓ | - |
| RPL23A | 1.044 ± 0.318 | 1.140 ± 0.179 | 1.482 ± 0.363 | - | *↑ | *↑ |
| RPL26 | 1.020 ± 0.195 | 0.992 ± 0.295 | 0.947 ± 0.237 | - | - | - |
| RPL27 | 1.009 ± 0.141 | 1.007 ± 0.129 | 0.746 ± 0.630 | - | - | - |
| RPL30 | 1.032 ± 0.266 | 1.097 ± 0.547 | 0.921 ± 0.404 | - | - | - |
| RPL31 | 1.010 ± 0.148 | 1.002 ± 0.115 | 1.170 ± 0.161 | - | *↑ | *↑ |
| RPS3A | 1.031 ± 0.271 | 1.119 ± 0.423 | 0.919 ± 0.310 | - | - | - |
| RPS5 | 1.006 ± 0.110 | 1.071 ± 0.209 | 1.261 ± 0.155 | - | ***↑ | - |
| RPS6 | 1.009 ± 0.134 | 1.255 ± 0.375 | 1.430 ± 0.373 | *↑ | **↑ | - |
| RPS10 | 1.017 ± 0.191 | 1.223 ± 0.131 | 1.324 ± 0.242 | *↑ | **↑ | - |
| RPS13 | 1.002 ± 0.072 | 1.031 ± 0.069 | 1.255 ± 0.217 | - | **↑ | *↑ |
| RPS16 | 1.019 ± 0.205 | 1.020 ± 0.243 | 0.845 ± 0.283 | - | - | - |
| RPS17 | 1.004 ± 0.091 | 1.035 ± 0.133 | 1.252 ± 0.192 | - | **↑ | *↑ |
| RPS20 | 1.008 ± 0.140 | 0.819 ± 0.132 | 0.674 ± 0.234 | **↓ | **↓ | - |
The non-parametric Mann-Whitney test was performed to compare each group when the samples did not follow a normal distribution whereas the unpaired t test was used for normal variables. Data are represented as the mean ± SD: *P<0.05, **P<0.01 and ***P<0.001. ↓, ↑ indicate gene up-regulation and down-regulation, respectively.
Three genes encoding ribosomal proteins RPL21, RPS6 and RPS10 were up-regulated, and two encoding RPL22 and RPS20 down-regulated in AD when compared with MA (p values between <0.05 and <0.01). However, ten of seventeen genes encoding ribosomal proteins were deregulated in rpAD when compared with MA. The expression of most of these genes, including RPL21, RPL23A, RPL31, RPS5, RPS6, RPS10, RPS13 and RPS17, was significantly increased, but RPL22 and RPS20 were down-regulated (p values between <0.05 and <0.001). Four genes, including RPL23A, RPL31, RPS13 and RPS17, were differentially up-regulated in AD when compared with rpAD (P<0.05) (Table 4).
Expression levels of initiation and elongation factors of protein synthesis in frontal cortex area 8 in MA, AD and rpAD
Four eukaryotic initiation factors eIF2α, phospho-eIF2α, eIF3η and eIF5, and two eukaryotic elongation factors, eEF1A and eEF2, were assessed with western blotting.
eEF1A and eEF2 were significantly decreased in AD when compared with MA (P<0.01); eIF3η, eEF1A and eEF2 were significantly decreased in rpAD when compared with MA (p values from <0.01 to <0.001); eIF3η was significantly down-regulated in rpAD when compared with AD (P<0.05) (Figure 1).
Figure 1.
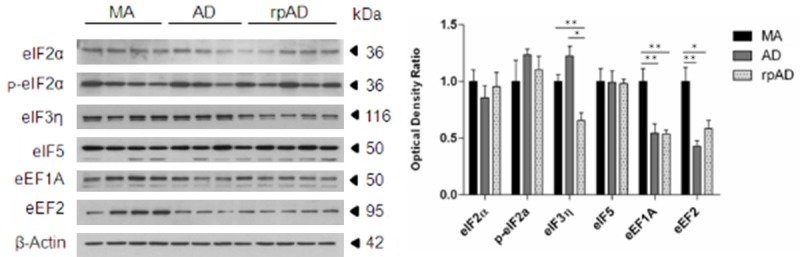
Protein expression levels of eukaryotic initiation factors eIF2α, phospho-eIF2α, eIF3η and eIF5, and eukaryotic elongation factors, eEF1A and eEF2 as revealed with gel electrophoresis and western blotting in frontal cortex area 8 in MA, AD and rpAD, and corrected with β-actin. Densitometry of western blot bands was assessed with the TotalLab program and subsequently analyzed with GraphPad Prism and Statgraphics Statistical Analysis, and Data Visualization Software version 5.1 with one-way ANOVA with post-hoc Tukey’s range test for multiple comparisons: *P<0.05; **P<0.01; ***P<0.001.
mRNA expression levels of nucleolar proteins, rRNA18S and rRNA28S, and ribosomal proteins in somatosensory cortex of APP/PS1 mice at 3, 12 and 20 months
Expression levels of rRNAs and several genes coding for ribosomal proteins varied with age in WT and APP/PS1 mice, although no significant differences were seen between the two groups at the ages of 3 months and 12 months. Values were higher at the age of 12 months when compared with the age of 3 months in both phenotypes. Values decreased after the age of 12 months in both groups. However, a significant increase in the expression of Ncl, rRNA18S, rRNA28S, Rpl23a, Rps3a, Rps5, Rps6, Rps10, Rps13 and Rps16 mRNA was found in APP/PS1 transgenic mice when compared with WT littermates at the age of 20 months (p values from <0.05 to <0.01) (Table 5).
Table 5.
mRNA expression of genes coding for selected nucleolar and ribosomal proteins, rRNA18S and rRNA28S in the somatosensory cortex of WT and APP/PS1 mice aged 3, 12 and 20 months
| 3 months | 12 months | 20 months | ||||
|---|---|---|---|---|---|---|
|
| ||||||
| WT | APP/PS1 | WT | APP/PS1 | WT | APP/PS1 | |
| Ubtf | 1.057 ± 0.111### | 1.123 ± 0.211 | 1.628 ± 0.041 | 1.463 ± 0.083 | 1.342 ± 0.089 | 3.796 ± 0.873 |
| Npm3 | 1.188 ± 0.305 | 1.023 ± 0.087& | 0.862 ± 0.070 | 0.852 ± 0.082 | 2.518 ± 0.396 | 3.796 ± 0.873 |
| Ncl | 1.010 ± 0.059 | 1.023 ± 0.087 | 0.082 ± 0.070& | 1.003 ± 0.238 | 0.960 ± 0.086 | 1.370 ± 0.080**↑ |
| rRNA18S | 1.018 ± 0.075### | 1.085 ± 0.164& | 2.730 ± 0.188&&& | 2.237 ± 0.456 | 1.259 ± 0.170 | 2.504 ± 0.496*↑ |
| rRNA28S | 1.009 ± 0.052###,&&& | 1.076 ± 0.150 | 2.367 ± 0.191 | 1.847 ± 0326 | 1.338 ± 0.175 | 2.401 ± 0.344*↑ |
| Rpl5 | 1.004 ± 0.032### | 1.005 ± 0.038### | 3.015 ± 0.327&&& | 2.393 ± 0.122&&& | 0.727 ± 0.047 | 1.190 ± 0.147 |
| Rpl7 | 1.032 ± 0.093 | 1.029 ± 0.094 | 1.785 ± 0.279 | 1.305 ± 0.108 | 1.251 ± 0.211 | 1.366 ± 0.211 |
| Rpl21 | 1.003 ± 0.031 | 1.018 ± 0.067 | 0.903 ± 0.113 | 0.635 ± 0.058 | 0.834 ± 0.116 | 0.956 ± 0.094 |
| Rpl22 | 1.004 ± 0.037 | 1.010 ± 0.049 | 1.043 ± 0.180 | 0.758 ± 0.51 | 0.823 ± 0.073 | 1.011 ± 0.100 |
| Rpl23a | 1.009 ± 0.052 | 1.015 ± 0.049&&& | 1.081 ± 0.085 | 0.794 ± 0.036&&& | 1.005 ± 0.059 | 1.649 ± 0.108**↑ |
| Rpl26 | 1.024 ± 0.022 | 1.009 ± 0.49 | 1.459 ± 0.204 | 1.116 ± 0.108& | 1.025 ± 0.172 | 1.679 ± 0.205 |
| Rpl27 | 1.003 ± 0.28 | 1.004 ± 0.030 | 1.465 ± 0.158 | 1.255 ± 0.133 | 0.960 ± 0.434 | 1.129 ± 0.120 |
| Rpl30 | 1.023 ± 0.098# | 1.010 ± 0.049 | 0.729 ± 0.068 | 0.878 ± 0.205 | 0.838 ± 0.082 | 1.589 ± 0.263 |
| Rps3a | 1.001 ± 0.013## | 1.000 ± 0.017 | 1.683 ± 0.199&& | 1.384 ± 0.194 | 0.896 ± 0.036 | 1.336 ± 0.155*↑ |
| Rps5 | 1.002 ± 0.028## | 1.006 ± 0.043#,& | 1.987 ± 0.252& | 1.698 ± 0.231 | 1.050 ± 0.053 | 1.576 ± 0.173*↑ |
| Rps6 | 1.003 ± 0.043 | 1.191 ± 0.245 | 1.184 ± 0.080 | 1.643 ± 0.127 | 1.006 ± 0.052 | 1.831 ± 0.255*↑ |
| Rps10 | 1.007 ± 0.045 | 1.013 ± 0.065### | 3.730 ± 0.522&&& | 3.344 ± 0.368 | 1.122 ± 0.083 | 1.884 ± 0.263*↑ |
| Rps13 | 1.001 ± 0.015### | 1.004 ± 0.038# | 0.803 ± 0.092&& | 0.610 ± 0.021 | 0.778 ± 0.033 | 1.150 ± 0.128*↑ |
| Rps16 | 1.004 ± 0.032# | 1.006 ± 0.042& | 1.286 ± 0.106&& | 1.268 ± 0.120 | 0.827 ± 0.057 | 1.433 ± 0.176*↑ |
| Rps17 | 1.004 ± 0.031 | 1.008 ± 0.049 | 1.202 ± 0.096 | 1.057 ± 0.084 | 0.901 ± 0.102 | 1.225 ± 0.154 |
The non-parametric Mann-Whitney test was performed to compare each group when the samples did not follow a normal distribution whereas the unpaired t test was used for normal variables. Data are represented as the mean values ± SD.
P<0.05 compared with WT animals;
P<0.01 compared with WT animals.
P<0.05 compared with 20 months;
P<0.01 compared with 20 months;
P<0.001 compared with 20 months.
P<0.05 compared with animals aged 12 months;
P<0.01 compared with animals aged 12 months;
P<0.001 compared with animals aged 12 months.
Expression levels were calculated using Hprt for normalization. ↑ indicate gene up-regulation.
Protein expression of initiation and elongation transcription factors in somatosensory cortex in WT and APP/PS1 mice
eIF2α, eIF3η, eIF5, eEF1a and eEF2 protein levels were assessed with western blotting in WT and APP/PS1 at the ages of 3, 12 and 20 months. Western blots of all samples are shown in Figure 2. eIF2α was significantly increased in APP/PS1 animals at the age of 3 months when compared with age-matched littermates; eIF5 was significantly decreased (P<0.01), as was eEF2 (P<0.01) in APP/PS1 transgenic mice when compared to WT at the age of 12 months (Figure 3).
Figure 2.
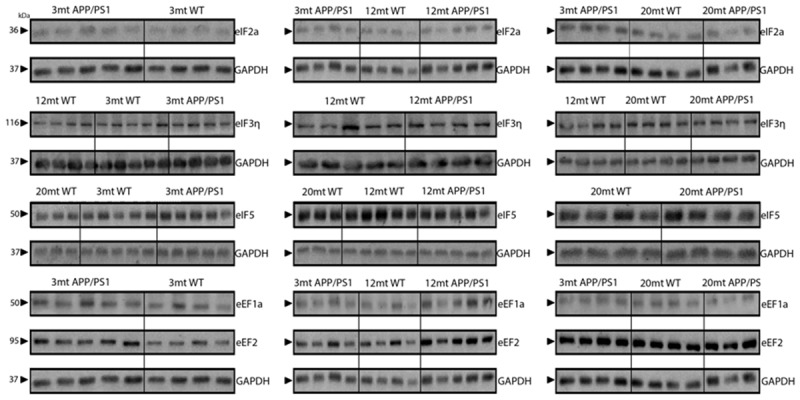
Western blots of the somatosensory cortex of WT and APP/PS1 transgenic mice at the ages of 3, 12 and 20 months showing the expression of eIF2α, eIF3η, eIF5, eEF1a and eEF2 proteins.
Figure 3.

Protein expression levels of eukaryotic initiation factors eIF2α, eIF3η and eIF5, and eukaryotic elongation factors, eEF1A and eEF2 as revealed with gel electrophoresis and western blotting in somatosensory cortex of WT and APP/PS1 transgenic mice at the ages of 3, 12 and 20 months. Densitometry of western blot bands was assessed with the TotalLab program and subsequently analyzed with GraphPad Prism and Statgraphics Statistical Analysis, and Data Visualization Software version 5.1 with one-way ANOVA with post-hoc Tukey’s range test for multiple comparisons: *P<0.05, **P<0.01 comparison with age-matched WT; §P<0.01, §§P<0.01, §§§P<0.001, comparison with mice aged 3 months; #P<0.05, ##P<0.01, comparison with mice aged 12 months.
Discussion
Present observations show altered expression of genes and proteins involved in the protein synthesis machinery from the nucleolus to the ribosome in frontal cortex area 8 at advanced stages of AD and in the somatosensory cortex of APP/PS1 transgenic mice used as a model of AD-like β-amyloidopathy at advanced stages of the disease.
However, alterations differ in humans and mice. NPM1, NCL and UBTF mRNA expression is reduced in AD whereas Ncl mRNA is up-regulated in transgenic mice. rRNA18S and rRNA28S are reduced in AD but significantly increased in transgenic mice. Several genes encoding ribosomal proteins of the large and small subunits are up- or down-regulated in AD, but seven out of fifteen assessed genes encoding ribosomal proteins are up-regulated in the APP/P1 mouse. This is accompanied by a significant decrease in the protein levels of elongating factors eEF1A and eEF2 in AD but only of eEF2 in mice when compared with age-matched controls. Moreover, alterations are more marked in rpAD when compared with typical forms of AD, as several ribosomal protein mRNAs are up-regulated, and initiation factor eIF3η protein expression is reduced, in rpAD when compared with typical AD.
Changes in AD cannot be attributed to the mere loss of nerve cells, as some genes are up-regulated in parallel to others which are down-regulated. It may be argued that differences in gene expression are related to differences in cell type, but that all these factors are expressed in neurons and glial cells.
Reduced expression of RNAs encoding nucleolar chaperones and UBTF in frontal cortex parallels decreases mRNA and protein expression in the CA1 region of the hippocampus at advanced stages of AD [15]. Reduced rRNA expression in frontal cortex is in agreement with previous observations [2-4,9] but only with expression levels in the CA1 region of hippocampus at early and middle stages of the disease [15]. Increased expression of rRNA28S in CA1 at advanced stages of AD may be related to the accompanying astrogliosis [15]. Regarding transcription of genes encoding ribosomal proteins, marked differences are seen between the hippocampus and frontal cortex, as the majority of assessed genes are down-regulated in the CA1 region of the hippocampus and up-regulated in the frontal cortex at the same disease stage [15].
Finally, differences also exist in the expression of initiation and elongation factors between the hippocampus and frontal cortex at similarly advanced stages of the disease. eIF2 is markedly increased in the hippocampus but not in the frontal cortex, whereas eEF1A and eEF2 total levels do not differ in AD from those of age-matched controls in the hippocampus [15] but are markedly reduced in frontal cortex at the same stage of the disease. Regional differences in the neuronal responses may account for these differences in the populations of neurons and glial cells between the hippocampus and the frontal cortex at the same stage of the disease. Moreover, discrete differences might not be identified using total brain homogenates. As an example, no modifications in total levels of P-eIF2α were observed in the present study although P-eIF2α is expressed in only approximately 60% of neurofibrillary tangle (NFT)-containing neurons in the isocortex in AD, thus indicating that not all neurons with NFTs over-express phosphorylated P-eIF2α [12].
In summary, our observations, when compared with previous similar studies of ours focused on the hippocampus (), show marked regional differences in the expression of players involved in the protein synthesis machinery at the same advanced stage of the disease. Alterations differ slightly between typical AD and those cases with rapid clinical course, while alterations differ between AD and APP/PS1 transgenic mice, implying there can be no direct application of the results in the mouse model to the human disease.
Acknowledgements
This study was funded by the Ministerio de Ciencia e Innovación, Instituto de Salud Carlos III-Fondos FEDER, a way to build Europe FIS grants PI14/00757 and PI14/00328. We wish to thank T. Yohannan for editorial help.
Disclosure of conflict of interest
None.
References
- 1.da Silva AM, Payão SL, Borsatto B, Bertolucci PH, Smith MA. Quantitative evaluation of rRNA in Alzheimer’s disease. Mech Ageing Dev. 2000;120:57–64. doi: 10.1016/s0047-6374(00)00180-9. [DOI] [PubMed] [Google Scholar]
- 2.Dönmez-Altuntas H, Akalain H, Karaman Y, Demirtas H, Imamoglu N, Ozkul Y. Evaluation of the nucleolar organizer regions in Alzheimer’s disease. Gerontology. 2005;51:297–301. doi: 10.1159/000086365. [DOI] [PubMed] [Google Scholar]
- 3.Pietrzak M, Rempala G, Nelson PT, Zheng JJ, Hetman M. Epigenetic silencing of nucleolar rRNA genes in Alzheimer’s disease. PLoS One. 2011;6:e22585. doi: 10.1371/journal.pone.0022585. [DOI] [PMC free article] [PubMed] [Google Scholar]
- 4.Sajdel-Sulkowska EM, Marotta CA. Alzheimer’s disease brain: alterations in RNA levels and in a ribonuclease-inhibitor complex. Science. 1984;225:947–949. doi: 10.1126/science.6206567. [DOI] [PubMed] [Google Scholar]
- 5.Shan X, Tashiro H, Lin CL. The identification and characterization of oxidized RNAs in Alzheimer’s disease. J Neurosci. 2003;23:4913–4921. doi: 10.1523/JNEUROSCI.23-12-04913.2003. [DOI] [PMC free article] [PubMed] [Google Scholar]
- 6.Nunomura A, Chiba S, Lippa CF, Cras P, Kalaria RN, Takeda A, Honda K, Smith MA, Perry G. Neuronal RNA oxidation is a prominent feature of familial Alzheimer’s disease. Neurobiol Dis. 2004;17:108–113. doi: 10.1016/j.nbd.2004.06.003. [DOI] [PubMed] [Google Scholar]
- 7.Nunomura A, Honda K, Takeda A, Hirai K, Zhu X, Smith MA, Perry G. Oxidative damage to RNA in neurodegenerative diseases. J Biomed Biotechnol. 2006;2006:82323. doi: 10.1155/JBB/2006/82323. [DOI] [PMC free article] [PubMed] [Google Scholar]
- 8.Honda K, Smith MA, Zhu X, Baus D, Merrick WC, Tartakoff AM, Hattier T, Harris PL, Siedlak SL, Fujioka H, Liu Q, Moreira PI, Miller FP, Nunomura A, Shimohama S, Perry G. Ribosomal RNA in Alzheimer disease is oxidized by bound redox-active iron. J Biol Chem. 2005;280:20978–20986. doi: 10.1074/jbc.M500526200. [DOI] [PubMed] [Google Scholar]
- 9.Ding Q, Markesbery WR, Cecarini V, Keller JN. Decreased RNA, and increased RNA oxidation, in ribosomes from early Alzheimer’s disease. Neurochem Res. 2006;31:705–710. doi: 10.1007/s11064-006-9071-5. [DOI] [PubMed] [Google Scholar]
- 10.Shan X, Lin CL. Quantification of oxidized RNAs in Alzheimer’s disease. Neurobiol Aging. 2006;27:657–662. doi: 10.1016/j.neurobiolaging.2005.03.022. [DOI] [PubMed] [Google Scholar]
- 11.Langstrom NS, Anderson JP, Lindroos HG, Winblad B, Wallace WC. Alzheimer’s disease-associated reduction of polysomal mRNA translation. Brain Res Mol Brain Res. 1989;5:259–269. doi: 10.1016/0169-328x(89)90060-0. [DOI] [PubMed] [Google Scholar]
- 12.Ferrer I. Differential expression of phosphorylated translation initiation factor 2 alpha in Alzheimer’s disease and Creutzfeldt-Jakob’s disease. Neuropathol Appl Neurobiol. 2002;28:441–451. doi: 10.1046/j.1365-2990.2002.t01-1-00410.x. [DOI] [PubMed] [Google Scholar]
- 13.Li X, An WL, Alafuzoff I, Soininen H, Winblad B, Pei JJ. Phosphorylated eukaryotic translation factor 4E is elevated in Alzheimer brain. Neuroreport. 2004;15:2237–2240. doi: 10.1097/00001756-200410050-00019. [DOI] [PubMed] [Google Scholar]
- 14.Ding Q, Markesbery WR, Chen Q, Li F, Keller JN. Ribosome dysfunction is an early event in Alzheimer’s disease. J Neurosci. 2005;25:9171–9175. doi: 10.1523/JNEUROSCI.3040-05.2005. [DOI] [PMC free article] [PubMed] [Google Scholar]
- 15.Hernández-Ortega K, Garcia-Esparcia P, Gil L, Lucas JJ, Ferrer I. Altered machinery of protein synthesis in Alzheimer’s: from the nucleolus to the ribosome. Brain Pathol. 2016;26:593–605. doi: 10.1111/bpa.12335. [DOI] [PMC free article] [PubMed] [Google Scholar]
- 16.Grau-Rivera O, Gelpi E, Nos C, Gaig C, Ferrer I, Saiz A, Lladó A, Molinuevo JL, Graus F, Sánchez-Valle R Neurological Tissue Bank Collaborative Group. Clinicopathological correlations and concomitant pathologies in rapidly progressive dementia: a brain bank series. Neurodegener Dis. 2015;15:350–360. doi: 10.1159/000439251. [DOI] [PubMed] [Google Scholar]
- 17.Ferrer I, Martinez A, Boluda S, Parchi P, Barrachina M. Brain banks: benefits, limitations and cautions concerning the use of post-mortem brain tissue for molecular studies. Cell Tissue Bank. 2008;9:181–194. doi: 10.1007/s10561-008-9077-0. [DOI] [PubMed] [Google Scholar]
- 18.Braak H, Braak E. Neuropathological staging of Alzheimer-related changes. Acta Neuropathol. 1991;82:239–259. doi: 10.1007/BF00308809. [DOI] [PubMed] [Google Scholar]
- 19.Braak H, Alafuzoff I, Arzberger T, Kretzschmar H, Del Tredici K. Staging of Alzheimer diseaseassociated neurofibrillary pathology using paraffin sections and immunocytochemistry. Acta Neuropathol. 2006;12:389–404. doi: 10.1007/s00401-006-0127-z. [DOI] [PMC free article] [PubMed] [Google Scholar]
- 20.Thal DR, Rüb U, Orantes M, Braak H. Phases of a beta-deposition in the human brain and its relevance for the development of AD. Neurology. 2002;58:1791–800. doi: 10.1212/wnl.58.12.1791. [DOI] [PubMed] [Google Scholar]
- 21.Montine TJ, Phelps CH, Beach TG, Bigio EH, Cairns NJ, Dickson DW, Duyckaerts C, Frosch MP, Masliah E, Mirra SS, Nelson PT, Schneider JA, Thal DR, Trojanowski JQ, Vinters HV, Hyman BT National Institute on Aging; Alzheimer’s Association. National Institute on Aging-Alzheimer’s Association guidelines for the neuropathologic assessment of Alzheimer’s disease: a practical approach. Acta Neuropathol. 2012;123:1–11. doi: 10.1007/s00401-011-0910-3. [DOI] [PMC free article] [PubMed] [Google Scholar]
- 22.Borchelt DR, Thinakaran G, Eckman CB, Lee MK, Davenport F, Ratovitsky T, Prada CM, Kim G, Seekins S, Yager D, Slunt HH, Wang R, Seeger M, Levey AI, Gandy SE, Copeland NG, Jenkins NA, Price DL, Younkin SG, Sisodia SS. Familial Alzheimer’s disease-linked presenilin 1 variants elevate Aβ1-42/1-40 ratio in vitro and in vivo. Neuron. 1996;17:1005–1013. doi: 10.1016/s0896-6273(00)80230-5. [DOI] [PubMed] [Google Scholar]
- 23.Aso E, Lomoio S, López-González I, Joda L, Carmona M, Fernández-Yagüe N, Moreno J, Juvés S, Pujol A, Pamplona R, Portero-Otin M, Martín V, Díaz M, Ferrer I. Amyloid generation and dysfunctional immunoproteasome activation with disease progression in animal model of familial Alzheimer’s disease. Brain Pathol. 2012;22:636–653. doi: 10.1111/j.1750-3639.2011.00560.x. [DOI] [PMC free article] [PubMed] [Google Scholar]
- 24.Barrachina M, Castaño E, Ferrer I. TaqMan PCR assay in the control of RNA normalization in human post-mortem brain tissue. Neurochem Int. 2006;49:276–284. doi: 10.1016/j.neuint.2006.01.018. [DOI] [PubMed] [Google Scholar]
- 25.Durrenberger PF, Fernando FS, Magliozzi R, Kashefi SN, Bonnert TP, Ferrer I, Seilhean D, Nait-Oumesmar B, Schmitt A, Gebicke-Haerter PJ, Falkai P, Grünblatt E, Palkovits M, Parchi P, Capellari S, Arzberger T, Kretzschmar H, Roncaroli F, Dexter DT, Reynolds R. Selection of novel reference genes for use in the human central nervous system: a BrainNet Europe study. Acta Neuropathol. 2012;124:893–903. doi: 10.1007/s00401-012-1027-z. [DOI] [PubMed] [Google Scholar]