Abstract
Brassica rapa is a model species for agronomic, ecological, evolutionary, and translational studies. Here, we describe high-density SNP discovery and genetic map construction for a B. rapa recombinant inbred line (RIL) population derived from field collected RNA sequencing (RNA-Seq) data. This high-density genotype data enables the detection and correction of putative genome misassemblies and accurate assignment of scaffold sequences to their likely genomic locations. These assembly improvements represent 7.1–8.0% of the annotated B. rapa genome. We demonstrate how using this new resource leads to a significant improvement for QTL analysis over the current low-density genetic map. Improvements are achieved by the increased mapping resolution and by having known genomic coordinates to anchor the markers for candidate gene discovery. These new molecular resources and improvements in the genome annotation will benefit the Brassicaceae genomics community and may help guide other communities in fine-tuning genome annotations.
Keywords: RNA-Seq, genetic map, Brassica rapa, genome assembly correction
The Brassica genus is important for human diets throughout Asia, providing micronutrients, up to 12% of oil calories, and a wide diversity of agricultural products (Dixon 2007; X. Wang et al. 2011). Within this genus, genome sequences have recently been published for Brassica napus, B. rapa, and B. oleracea (Chalhoub et al. 2014; Liu et al. 2014; Parkin et al. 2014; X. Wang et al. 2011; Yang et al. 2016). B. rapa is a physiologically and morphologically diverse diploid species that has 87% gene exon similarity to the model plant Arabidopsis thaliana (Cheng et al. 2013). This makes B. rapa an excellent species for comparing and translating knowledge of biological processes from Arabidopsis to a crop species. For example, homologous Arabidopsis gene information has been used to infer the action of B. rapa genes in glucosinolate metabolism (Li and Quiros 2001; H. Wang et al. 2011), flowering time, leaf development (Baker et al. 2015), and seed yield (Brock et al. 2010; Dechaine et al. 2014). All of these important traits contribute to our understanding of plant growth in agricultural settings and the underlying genetic understanding of these traits is made possible by a reference genome sequence (X. Wang et al. 2011), gene annotation information (Cheng et al. 2013; Devisetty et al. 2014), and genetic mapping populations (e.g., Iniguez-Luy et al. 2009).
The annotated B. rapa genome assembly is 283.8 Mb spread over 10 chromosomes A01–10 (X. Wang et al. 2011). Although the current genome is diploid, there are three ancient subgenomes derived from genome duplication events. These subgenomes are designated as least fractionated (LF), most fractionated one (MF1), and most fractionated two (MF2), corresponding to the fraction of gene loss in each subgenome (Cheng et al. 2012; X. Wang et al. 2011). These three subgenomes share many paralogous genes and contiguous regions complicating genome assembly. This has prevented ∼10.8% of the gene-containing genomic scaffolds in version 1.5 of the genome (http://brassicadb.org/brad/index.php) from being assigned to chromosomes. The lack of chromosomal assignment is largely because these scaffolds have no molecular markers that would have enabled their placement on the genetic map. This suggests that identifying more markers can help to make the B. rapa genome assembly more comprehensive (X. Wang et al. 2011).
For this study, we utilized an existing RIL population of B. rapa that has been used extensively for QTL mapping of physiological, developmental, and evolutionarily important traits [BraIRRi; Baker et al. 2015; Brock et al. 2010; Dechaine et al. 2007, 2014; Edwards et al. 2011; Iniguez-Luy et al. 2009; Lou et al. 2011, 2012]. Recently, we completed deep RNA-Seq of the parents of the BraIRRi population, providing a large SNP set and improved gene annotation information (Devisetty et al. 2014). Using a new set of RNA-Seq data collected on the entire population, we extend these SNP discovery methods to 124 genotypes in the population for placing scaffolds, correcting assemblies, and the creation of a saturated genetic map.
Materials and Methods
Plant growth and tissue collection
The field site for plant growth was located at the University of Wyoming Agricultural Experimental Station in Laramie, Wyoming. This study focused on 124 RILs and the two parental genotypes (R500 and IMB211) of the BraIRRi population (Iniguez-Luy et al. 2009). The BraIRRi population is derived from the R500 yellow sarson oilseed variety and the IMB211 Wisconsin Fast Plant derivative. Individual replicates of each RIL were sown into peat pots filled with field soil and topped with 1 cm LP5 potting soil (Sun Gro Horticulture, Agawam, MA). Seeds were planted in the first week of June 2011, and pots were transplanted to the field 2.5 wk later following established protocols (Dechaine et al. 2014). One biological replicate of each genotype was planted into each of five fully randomized blocks. After plants were established in the field for 3 wk, apical meristem tissue was collected from individual replicate plants into 1.5 ml Eppendorf tubes, immediately flash frozen in liquid nitrogen, and stored at −80° until RNA-Seq library preparation. Apical meristem tissue was chosen as part of an overlapping RNA-Seq expression QTL project (Markelz et al., personal communication).
RNA-Seq library preparation and sequencing
RNA-Seq libraries were prepared using a high-throughput Illumina RNA-Seq library extraction protocol (Kumar et al. 2012). The enriched libraries were then quantified on an Analyst Plate Reader (LJL Biosystems) using SYBR Green I reagent (Invitrogen). Once the concentration of libraries was determined, a single pool of all the RNA-Seq libraries within each block was made. The pooled libraries were run on a Bioanalyzer (Agilent, Santa Clara) to determine the average product size for each pool. Each pool was adjusted to a final concentration of 20 nM and sequenced on seven lanes on an Illumina Hi-Sequation 2000 flow cell as 50 bp single-end reads. Any failed samples from the five blocks were run on two additional lanes.
RNA-Seq read processing
Preprocessing and mapping of Illumina RNA-Seq raw reads was done as described in detail in Devisetty et al. (2014) with one exception. The raw reads were quality filtered with FASTX tool kit’s (http://hannonlab.cshl.edu/fastx_toolkit/) fastq_quality_filter with parameters [−q 20, −p 95]. The qualified demultiplexed reads were then mapped to the B. rapa reference genome (Chiifu version 1.5) using BWA v0.6.1-r104 (Li and Durbin 2009) with parameters [bwa_n 0.04] and the unmapped reads were, in turn, mapped with TopHat with parameters [splice-mismatches 1, max-multihits 1, segment-length 22, butterfly-search, max-intron-length 5000, library-type fr-unstranded]. Finally, mapped reads from both BWA and TopHat were combined for genotyping purposes and quality controlled (Supplemental Material, Table S1).
Population-based polymorphism identification
Variant Call Format (VCF) files were generated for each of five replicate blocks of samples using samtools and bcftools. These tools were run as “samtools mpileup -E -u -f Brapa_sequence_v1.5.fa [all alignment files for the current block] | bcftools view -bvcg - | vcfutils.pl varFilter.”
The VCF files were summarized using “summarize-vcf.pl” Perl script (https://github.com/mfcovington/snps-from-rils). For each block of replicates, this script (run using the parameters: “–observed_cutoff 0.3–af1_min 0.3”) ignores INDELs and variant positions with > 2 alleles, ignores variants with site allele frequency values too far from 0.5 (≥ 0.7 or ≤ 0.3), and ignores variants with missing information in 30% or more of the population. For variants that passed these filters, the numbers of reads matching the reference and the number of alternate allele reads were recorded in a VCF summary file.
These VCF summary files from the different replicate blocks were merged using the “merge-vcf-summaries.pl” (https://github.com/mfcovington/snps-from-rils) Perl script. Using the default parameters (“–replicate_count_min 2–ratio_min 0.9”), this script merges the information in the VCF summaries and records a putative SNP as an actual SNP if the variant is identified as a SNP in at least two replicate blocks and if the proportion of reads matching the major allele is at least 0.9. This was done on a RIL-by-RIL basis.
Genotyping, plotting, and identification of genotype bins
The Perl script “extract+genotype_pileups.pl” (https://github.com/mfcovington/detect-boundaries) was used with the “–no_nr” parameter to extract genotype information from the RNA-Seq alignments at each SNP location for each member of the RIL population. The resulting genotype files were used to detect and remove SNPs with excessive noise.
Due to the crossing scheme used to create the RIL population, each individual is expected to be nearly homozygous for one parent or the other. The “filter-noisy-SNPs.pl” (https://github.com/mfcovington/noise-reduction-for-snps-from-pop) Perl script performs noise reduction for SNPs derived from such a population. It does this by identifying and ignoring positions that have an overrepresentation of heterozygosity in individual lines across the entire population. Using the default parameters (“–cov_min 3–homo_ratio_min 0.9–sample_ratio_min 0.9”), SNPs were discarded as noisy if > 10% of the lines in the population showed evidence of heterozygosity as defined by a line having at least three reads per SNP position with a major allele with a ratio < 0.9.
After noise reduction, the “extract+genotype_pileups.pl” (https://github.com/mfcovington/SNPTools) Perl script was rerun without the “–no_nr” parameter for each RIL. The resulting genotype files were used to create genotype plots using the “genoplot_by_id.pl” Perl script (https://github.com/mfcovington/SNPTools) and to define genotype bins for the individual RILs.
The “filter-snps.pl” Perl script (https://github.com/mfcovington/detect-boundaries) was used to identify regions of adjacent SNPs with alleles from the same genotype. Using the default parameters (“–min_cov 10–min_momentum 10–min_ratio 0.9–offset_het 0.2”), it detects boundaries between genotype bins when there is a sliding window of ≥ 10 SNPs. Within each sliding window, a depth of at least 10 reads each exhibit major allelic ratios of at least 0.9. The major allele represents the opposite genotype from the previous bin (or exhibit major allelic ratios < 0.7 for transitions from regions of homozygosity to those of heterozygosity). For each member of the RIL population, this script generates one file with a boundary between genotype bins.
The “fine-tune-boundaries.pl” Perl script (https://github.com/mfcovington/detect-boundaries) is an automated tool for rapid, fine-scale human curation of boundaries between genotype bins that we used for the RIL population. As described in Devisetty et al. (2014), “This command-line tool displays color-coded genotype data together with the currently-defined bin boundaries. Using shortcut keys, the operator can quickly and easily approve or fine-tune a boundary (at which point, the next boundary is instantly displayed for approval).”
The “merge-boundaries.pl” Perl script (https://github.com/mfcovington/detect-boundaries) was used to merge all of the boundaries in the collection of the boundaries files that were generated by “filter-snps.pl” and “fine-tune-boundaries.pl.” A comprehensive list of bins and their locations resulting from the merge are written to a file: bins.tsv. The script also prints the boundary and bin stats (count, min size, max size, and mean size) to the screen to allow visual analysis of the resulting file. This information was used for human curation of the boundaries.
The “get-genotypes-for-bins.pl” Perl script (https://github.com/mfcovington/detect-boundaries) was used to convert the comprehensive bins file and all the individual boundaries files into a summary of bins and their locations across the genome and their genotypes across the entire RIL population (Table S2).
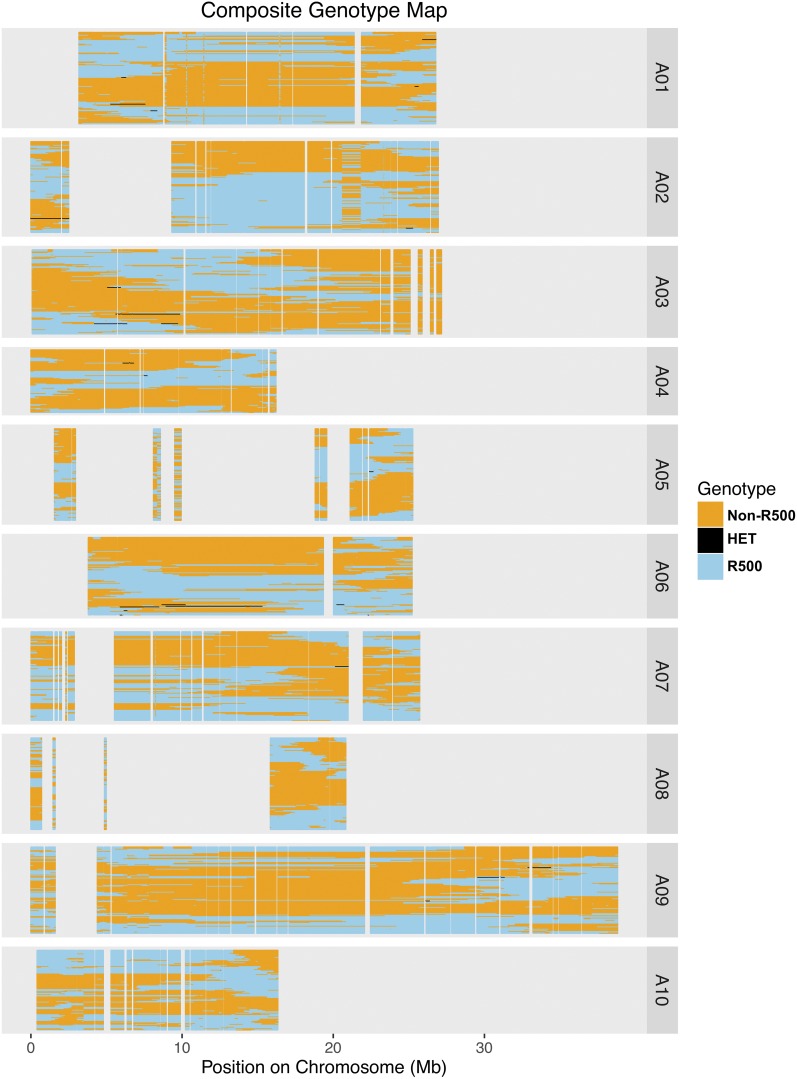
Composite genotype plots (Figure 3) were created using the “plot-composite-map.R” R script (https://github.com/mfcovington/detect-boundaries).
Figure 3.
Composite population genotype map with the physical position for each of the 10 chromosomes. Each RIL is represented as a single row displaying the genomic region inherited from IMB211 (orange) or R500 (blue). Small heterozygous regions are represented in black. HET, heterozygous; RIL, recombinant inbred line.
Validating and reassigning genomic scaffolds
Using the genotypic value for each genotype bin across the RILs, we calculated the asymmetric binary distance between all central SNP pairs using the dist(method = “binary”) function in R. The pairwise correlation matrix was then ordered by maximal correlations to place the map in a linear order and compared to the predicted bin order based on version 1.5 of the B. rapa genome. Comparisons between v1.5 of the genome and binary distance plots were manually inspected to ensure proper placement or reassignment.
Genetic map construction
Because each genotype bin across the RILs represents each observed recombination breakpoint in the population, we used one SNP per genotype bin to create a saturated genetic map. Aside from the possibility of rare, unobserved double crossover events, the mapping resolution in this population is no longer limited by the number of SNPs but instead by recombination events. The genetic map was constructed using the chromosomal position of each of the SNPs as a starting point for marker ordering along the chromosomes. Each chromosome was treated as a large linkage group and each SNP was tested for linkage disequilibrium with all other SNPs using the R/QTL package (Broman et al. 2003) in the R statistical environment (R Core Team 2015). Larger gaps in RNA-Seq information corresponding to low gene density centromeric regions were problematic when ordering markers using the ripple() R/QTL function (Broman et al. 2003). In chromosomes A08 and A09, after local marker order was established we used the physical position of the SNPs to connect the two arms in the correct orientation.
QTL comparisons
To test how increased marker coverage affected QTL mapping and identification for physiological traits, we remapped two traits from (Brock et al. 2010) that had been mapped using the previous genetic map (Iniguez-Luy et al. 2009). We used R/QTL (v1.39-5) to compare mapping results derived from the previous and updated genetic maps using the Brock et al. (2010) flowering time phenotype data. Specifically, we used the cim() function with three marker covariates and determined LOD significance cutoffs after 1000 permutations.
Data availability
All the raw data has been deposited in the NCBI Sequence Read Archive (Project: SRP022220). Figure S1 shows SNPs, centromeric regions, and gene density across the 10 chromosomes of B. rapa. Figure S2 contains the genetic map before misplaced markers were reassigned. Table S1 contains the read mapping statistics for each RIL. Table S2 contains the SNP genotyping and genomic position for the entire RIL population. Table S3 contains the genome-wide allele segregation statistics. Table S4 contains RIL population genetic bins and scaffold original and final positions. Table S5 shows the SNP base pair calls on unplaced scaffolds. Table S6 contains the final genetic map of the RIL population. Supporting code for genetic map construction can be found at: https://github.com/rjcmarkelz/brassica_genetic_map_paper.
Results and Discussion
R500 vs. IMB211 polymorphism identification
We performed deep RNA sequencing of 124 individuals of a RIL population derived from a cross between the B. rapa accessions R500 and IMB211 (Iniguez-Luy et al. 2009). We sequenced five replicates of each RIL and mapped 5.26 million reads per RIL. We had previously identified SNPs and INDELs between R500 and IMB211, the parents of the population (Devisetty et al. 2014), using v1.2 of the B. rapa genome. This set of R500 vs. IMB211 polymorphisms was used to genotype each member of the RIL population individually. The crossing scheme used to create the RIL population should create homozygous regions of contiguous R500 alleles alternating with homozygous regions of contiguous IMB211 alleles in the different RILs. However, when using the R500 vs. IMB211 polymorphism set to genotype the RILs, there were multiple regions where R500 and IMB211 alleles were randomly interspersed. This suggested that the RIL population might be derived from a parent or parents different to those that we had sequenced.
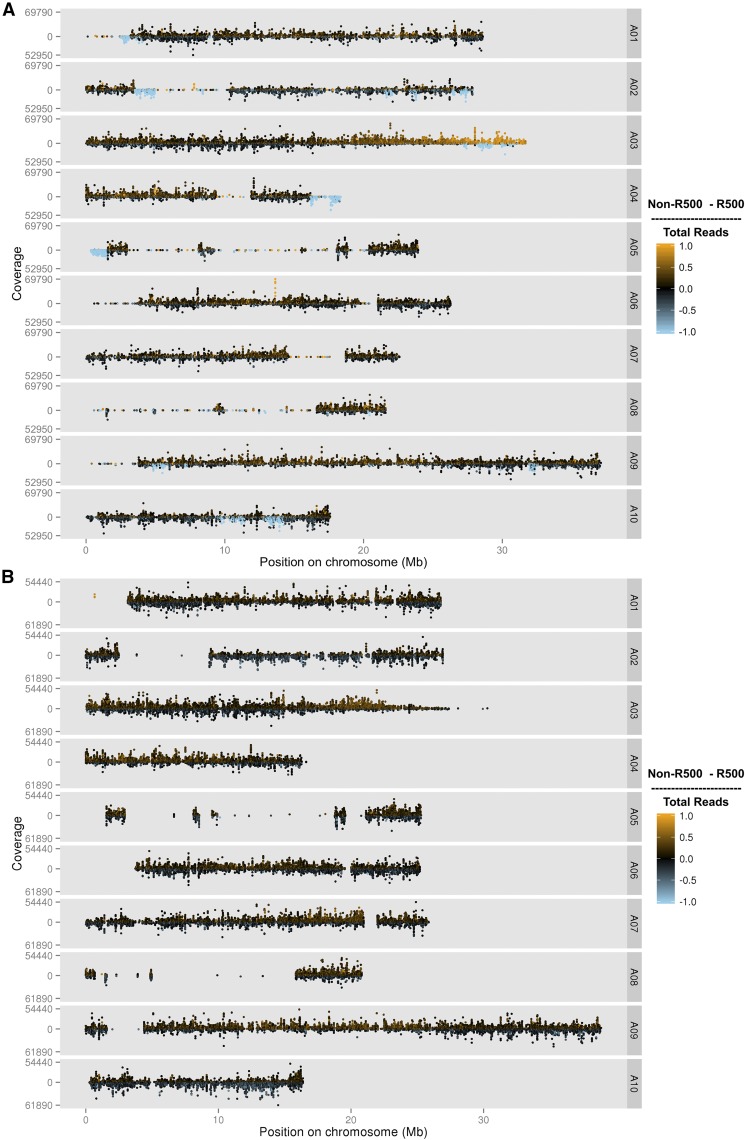
To test this hypothesis, we merged the sequence data from all RILs and then genotyped the merged data set using SNPs identified by the IMB211 vs. R500 comparison (Figure 1A). The merged data set provided a much better view of segregation of putative parental SNPs in this population. Given the size of the population and the expected recombination frequency and distribution, polymorphisms identified in the true RIL parents should be segregating with approximately equal allelic frequency in this merged data set (black dots in Figure 1A). Most genomic regions did display this expected distribution; however, there were several large regions that were not segregating, but instead were monomorphic for one of the putative parents of the population (indicated as orange or blue dots in Figure 1A). In other words, SNPs identified as polymorphic between the R500 and IMB211 strains are not segregating in the RILs. Nearly all of these monomorphic regions matched R500 alleles, consistent with the idea that the IMB211 seed strain is not the true parent of the RIL population.
Figure 1.
Plot of merged data from all RILs genotyped using the parent-based SNP set (A) and the population-based SNP set (B). Each of the B. rapa 10 chromosomes are displayed (A01–A10) with count coverage of each SNP at each physical position on the chromosome in megabases (Mb). The color indicates the relative ratio of coverage between R500 and IMB211 for each SNP. Black is equal coverage, orange is more IMB211, and blue is more R500. RIL, recombinant inbred line; SNP, single nucleotide polymorphism.
The primary exception to the expected Mendelian parental allele frequency in the RILs is on the bottom of chromosome A03, where there is a gradual transition from equal R500:IMB211 allelic frequency to nearly all IMB211. The A03 pattern is consistent with segregation distortion within the population, possibly caused by the centromere being located at that end of chromosome A03 (Cheng et al. 2013). With the lower recombination frequencies commonly observed near centromeres in plants (Harushima et al. 1998; Haupt et al. 2001; Sherman and Stack 1995), there could be a meiotic drive allele or a local inversion in this region causing the segregation distortion and this effect could be enhanced by the proximity to the centromere. There is evidence for each of these mechanisms occurring across a wide range of plant species (Buckler et al. 1999; Fang et al. 2012; Lowry and Willis 2010).
Population-based SNP discovery
Due to the uncertainty surrounding the identity of the IMB211 parent of the RIL population, we switched to a population-based approach for SNP discovery. This new strategy involved identifying variants within the RIL population and using the R500 data to assign parental origin for each SNP. Using this approach, we identified 146,027 SNPs across B. rapa’s 10 chromosomes (Table 1 and Table S2). These population-based SNPs segregate at the expected allele frequencies of ∼50/50 throughout the entire genome except at the previously noted end of A03 (Figure 1B and Table S3). Over 80% of the genome is within 100 kb of a SNP; however, there are several regions with few or no SNPs. There are two primary reasons for these SNP-free regions. Most are likely gene-poor regions or regions of genes with insufficient expression under our experimental conditions (e.g., growth conditions, age, tissue, and genotypes; Figure S1). We also found a few regions where there are significant numbers of expressed genes, but no SNPs between members of the RIL population. These regions primarily correspond to the nonvariant regions of Figure 1A and therefore likely represent regions that are very similar between the seed stocks used to generate this RIL population.
Table 1. SNP counts at different steps of the SNP discovery pipeline.
| Chromosomes | Scaffolds | Step | |
|---|---|---|---|
| 203,235 | 5618 | Identified within RIL population | |
| 176,627 (87%) | 4640 (83%) | Passed conflict removal and repeat count filtering | |
| 158,369 (78%, 90%) | 3737 (67%, 81%) | Have sequence information available for the R500 parent | |
| 146,027 (72%, 92%) | 3070 (55%, 82%) | Passed noise-reduction filter (Final number of SNPs) |
The percentage of SNPs located on chromosomes or scaffolds remaining after each step are shown in parentheses. The first percentage is relative to the initial set of SNPs and the second percentage is relative to the set of SNPs from the previous step. RIL, recombinant inbred line; SNP, single nucleotide polymorphism.
Genotyping the RIL population
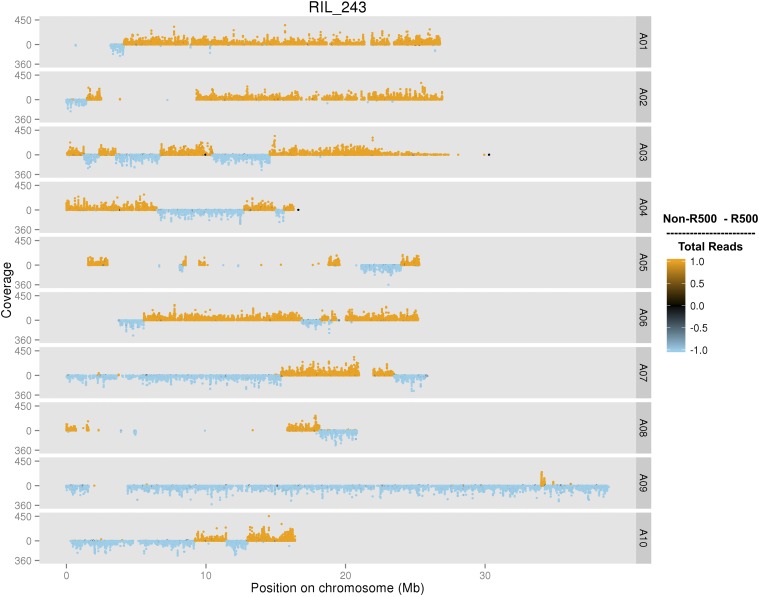
Using the per line transcriptomic data, each RIL was genotyped as having either the R500 or IMB211 allele at each of the 149,097 SNPs identified from the population-based SNP discovery pipeline. A representative RIL genotype plot is shown in Figure 2.
Figure 2.
An individual plot of a RIL genotyped with the population-based SNP set. Each of the B. rapa 10 chromosomes are displayed (A01–A10) with count coverage of each SNP at each physical position on the chromosome in megabases (Mb). The color indicates the relative ratio of coverage between R500 and IMB211 for each SNP. RIL, recombinant inbred line; SNP, single nucleotide polymorphism.
Collapsing adjacent SNPs into population-wide genotype bins
The next step toward creating a new genetic map was to define the largest set of nonredundant SNPs. This is necessary because the 149,097 SNPs in the full data set vastly exceed the expected number of recombination breakpoints in a population of 124 individuals. We developed a method to identify and summarize the “genotype bins” in the population. First, we found all detectable recombination breakpoints for each RIL. Next, we consolidated these breakpoints for the entire population. SNPs that were not adjacent to a recombination breakpoint in any of the RILs were considered redundant and removed. This yielded bins of adjacent SNPs with genotype patterns that differed from neighboring bins for at least one RIL because of a recombination event in that specific RIL. The genotype bins for the RIL population are summarized in a composite population genotype map (Figure 3).
Finding and reassigning misassembled genomic regions
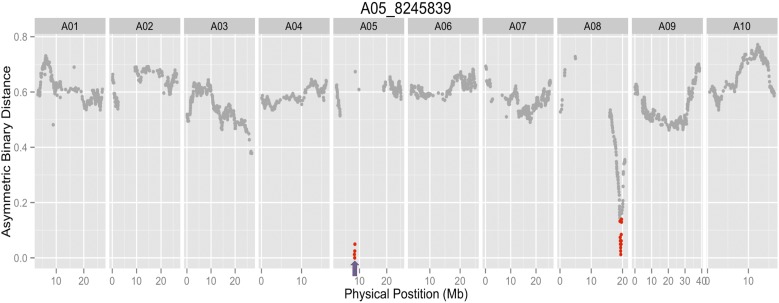
A first version of the population genetic map revealed several markers that seemed to be misplaced based on physical position, resulting in large genetic distances between them (Figure S2). Given that we have corrected the parental genotyping issues, the most likely explanation for this finding is that these regions represent genome assembly errors. To test this hypothesis, the genotypes of representative SNPs from each bin were used to calculate the asymmetric binary distances between each bin across the population. If the predicted genome position of each bin is correct, the expectation is that each SNP should have the lowest distance to adjacent SNPs in genome coordinates. However, consistent with genome assembly problems, there were a subset of SNPs whose genotypes were more highly correlated with SNPs located elsewhere in the genome rather than with SNPs near their current assigned genomic position (a representative example is shown in Figure 4). To correct these assembly problems, 13 regions consisting of 19 genotypic bins were moved to different genomic locations, and 4 regions consisting of 66 bins were inverted in place at their original position based on asymmetric binary distance (Table S4). He et al. (2015) also reordered B. rapa scaffolds, although they took a different approach whereby gene coding sequence similarity searches were used to identify, split, and reorder chimeric scaffolds to increase collinearity with pseudomolecules originally ordered using a B. napus linkage map. One difference with the He et al. (2015) method compared to ours is that using a B. napus genetic map to order B. rapa chromosomes could introduce errors if there are chromosomal rearrangements between these two species. Regardless, because He et al. (2015) used version 2.0 of the B. rapa genome, which was not released at the time this manuscript was submitted, it is not possible to directly compare the efficiency of these two approaches.
Figure 4.
A representative asymmetric binary distance plot for a single molecular marker, A05-8245839, indicated by the purple arrow. Markers with 90% correlation to A05-8245839 are indicated in red and occur on chromosomes A05 and A08. The group of markers on A05 were moved to A08.
Incorporating scaffold sequences into the genome
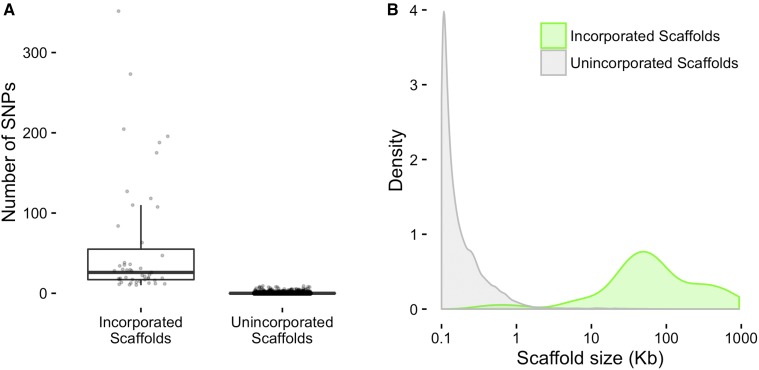
In version 1.5 of the B. rapa genome annotation, there are 40,357 scaffolds that have not been incorporated into any of the 10 chromosomes. These scaffolds range in size from 100 bp to 938 kbp and represent 1411 genes spanning 27.5 Mbp. For comparison, there are 39,609 genes within the 283.8 Mbp of annotated chromosomal sequence. Given that the scaffolds contain about as many genes as would be expected on one-third of an average chromosome, we decided to extend our strategy for fixing genome misassemblies to estimate the approximate chromosomal locations of the scaffolds.
We identified 3070 SNPs across 339 of the 40,357 scaffolds (the remaining scaffolds had no SNPs, Table S5). To be confident in our placement, we limited ourselves to the 47 scaffolds with 10 or more SNPs. For each of these 47 scaffolds, we were able to identify at least one genomically-defined chromosomal bin that had identical or near identical genotypes. This indicates very close genetic linkage between the unplaced scaffold and the placed genomic bin, allowing us to assign a genomic position but not an orientation to the unplaced scaffold. The incorporated scaffolds range in size from 429 to 884,746 bp and are enriched for larger scaffolds (Figure 5). The addition of these 47 scaffolds allowed us to incorporate 25% (∼7 Mbp) of the unplaced genomic sequence into the genome, representing 49% (691) of the unplaced scaffold genes (Table 2 and Table S4). In comparison, He et al. (2015) did not place any orphaned scaffolds into pseudomolecules, although the need for scaffold placement is likely reduced in the genome version (2.0) that was available to them.
Figure 5.
(A) Number of SNPs per scaffold. (B) Density distributions of scaffold sizes. Newly incorporated scaffolds are shown in green and unincorporated scaffolds are shown in gray.
Table 2. Incorporated scaffolds represent a disproportionately high amount of scaffold sequence.
| Status | Count | Total Length (bp) | Mean Length (bp) | Median Length (bp) |
|---|---|---|---|---|
| Incorporated scaffolds | 47 (0.1%) | 6,927,293 (25.1%) | 147,389 | 58,889 |
| Unincorporated scaffolds | 40,310 (99.9%) | 20,655,028 (74.9%) | 512 | 140 |
| All scaffolds | 40,357 | 27,582,321 | 683 | 140 |
Percentages of scaffold subset counts and total lengths relative to the set of all scaffolds are shown in parentheses.
While most of the incorporated scaffolds represent a single genotype bin, seven scaffolds are comprised of multiple bins. Scaffold000164, for example, includes 65 annotated genes across six distinct genotype bins within its 313.7 kbp sequence. For six of the scaffolds with multiple bins, the bins were closely linked and allowed us to place the scaffold in a single location in the genome. However, one scaffold, Scaffold000191, contained two bins that mapped to two different chromosomes, indicating that it was misassembled. Therefore, we split its two bins and assigned them to the appropriate chromosome locations (5 genes/28.2 kbp to A01 and 24 genes/104.1 kbp to A05).
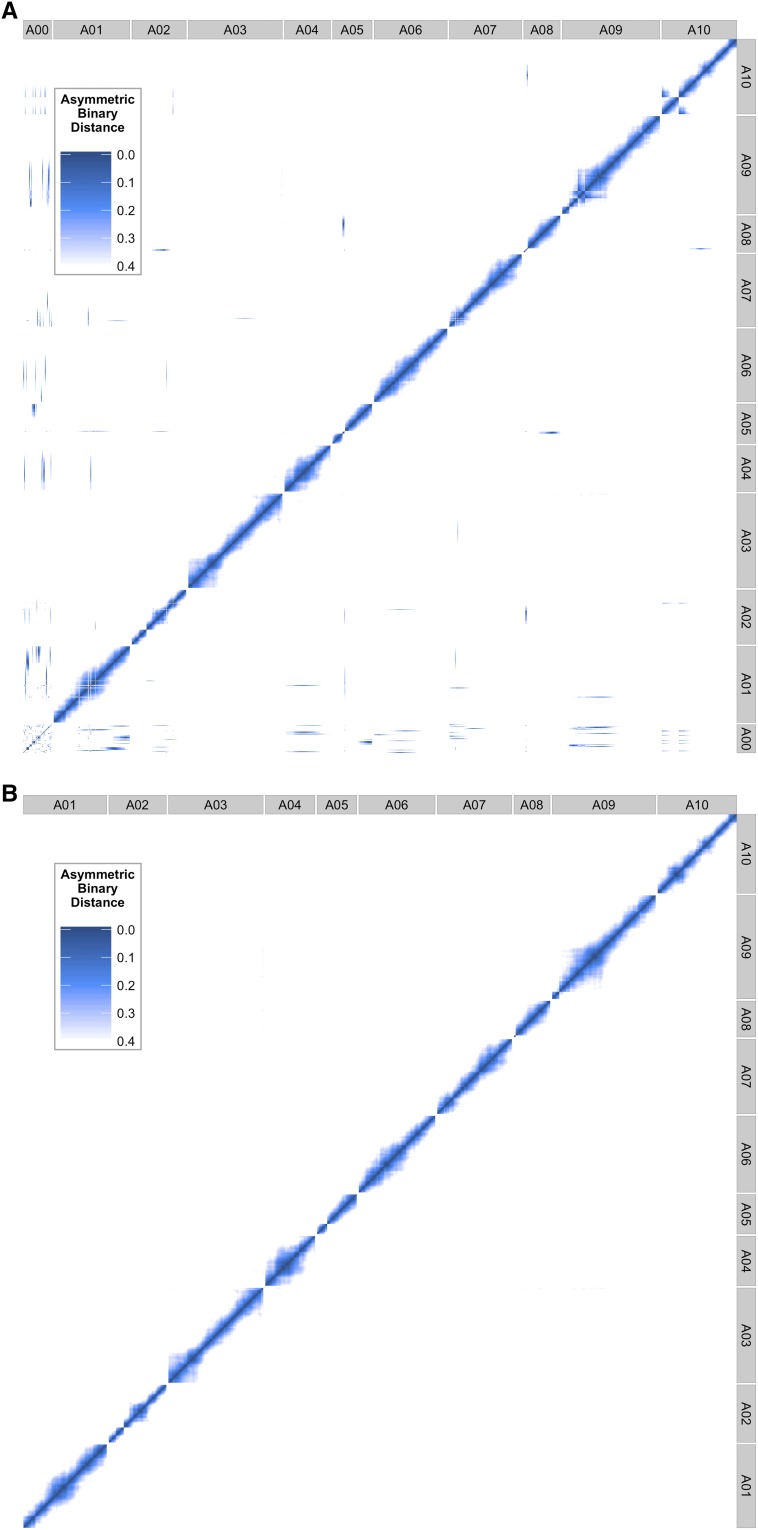
Possible reasons for the enrichment of larger scaffolds within the set of incorporated scaffolds include: (1) larger scaffolds are more likely to include expressed genes and therefore detectable SNPs and (2) larger scaffolds may be more likely to be accurate representations of a contiguous region within the genome. This second point is based on the assumption that large scaffolds could be assembled, perhaps due to more abundant, more consistent, and/or more convincing experimental support than small scaffolds. Before (Figure 6A) and after (Figure 6B) plots of genome-wide asymmetric binary distances for each marker pair show that rearranging putative genomic misassemblies and incorporating scaffolds eliminates inconsistencies between genome position and genotypes of adjacent markers.
Figure 6.
Genome-wide asymmetric binary distance plots for each marker compared against every other marker (A01–A10). (A) Contains the unplaced genomic scaffold sequences (see A00). Dark blue indicates high correlation (low asymmetric binary distance), while white indicates no correlation. (B) The final position of each marker and scaffold after applying our pipeline.
High-density genetic map
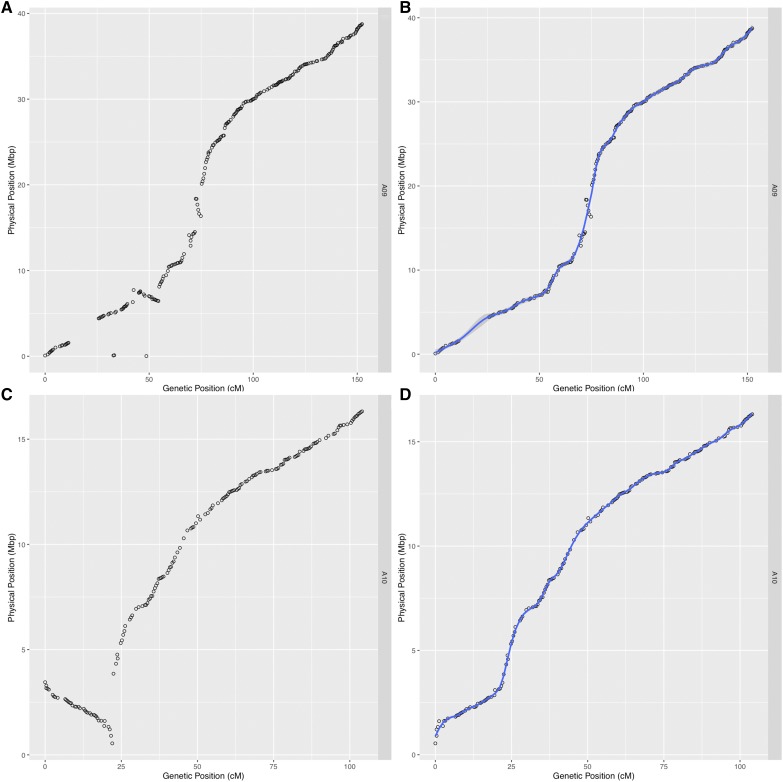
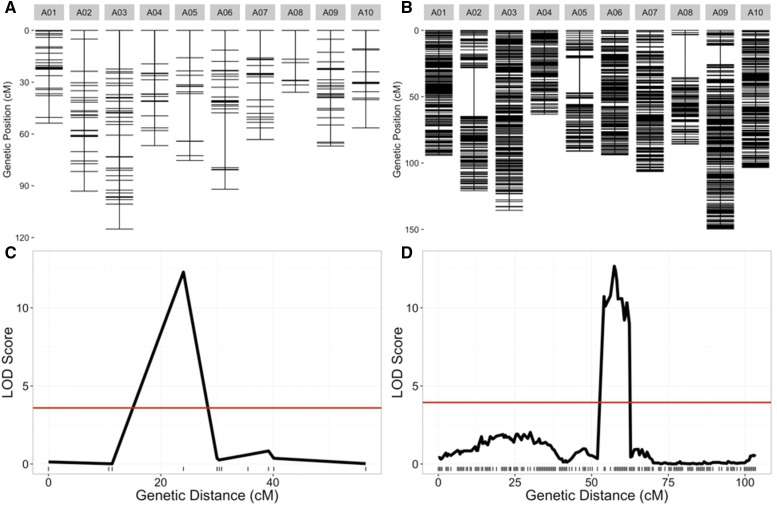
From the available SNP data, we were able to create a genetic map with 10 linkage groups corresponding to the 10 chromosomes of B. rapa. The map contains 1482 genotyped markers for 124 RILs and is effectively saturated based on recombination events existing in the population (Table S6). The new map has an average marker spacing of 0.7 cM and a total map distance of 1045.6 cM. For comparison, the original map contained 225 markers with an average spacing of 3.3 cM (Iniguez-Luy et al. 2009). This is also compared to a recent map created on a subset of the population, 67 RILs, that had a total of 125 markers derived from microarray probes (Hammond et al. 2011). Having the genetic distance of markers with known genomic coordinates allowed us to fix two additional genome misassemblies resulting in large inversions on chromosomes A09 and A10 (Figure 7 and Figure S2). All of these improvements combined allow us to more accurately map QTL for known phenotypes such as flowering time (Figure 8). Lastly, we fitted spline-based regressions for each chromosome to more accurately convert between genetic distance and physical distance (A01 example; Figure 7, B and C). These conversion equations are helpful for finding candidate genes in significant QTL regions (Fulop et al. 2016).
Figure 7.
Physical position vs. genetic position of each marker for chromosome A09 (A and B) and A10 (C and D) using genome version 1.5 (A and C) and fixed inversions using recombination information (B and D). Loess smoothing for converting between genetic and physical distance is displayed by the blue line in (B) and (D).
Figure 8.
Old and new genetic map comparisons. Genetic markers for each chromosome are displayed in centimorgan distance (cM) for the old (A) and new (B) genetic maps. Comparison of likelihood odds (LOD) scores for flowering time quantitative trait loci (QTL) on chromosome A07 using the old (C) and new (D) genetic maps.
Conclusions
In this study, we demonstrated the flexibility and power of thoughtfully designed RNA-Seq experiments from tissue collected from a field experiment. RNA is a rich source of biological information that can be utilized beyond expression analysis and transcriptome annotation. It is our hope that these new community resources using RNA-Seq are used to further genome annotation, assembly, and functional analysis of the emerging model crop B. rapa. Our scaffold rearrangement and placement of orphaned scaffolds significantly improves the B. rapa genome (v1.5), but perhaps more importantly we provide a new saturated genetic map for the widely used BraIRRI population with over 1400 molecular markers. These improvements combined with our population-based SNP calling method are a unique contribution to the Brassica community.
Supplementary Material
Supplemental material is available online at www.g3journal.org/lookup/suppl/doi:10.1534/g3.117.043000/-/DC1.
Acknowledgments
The authors wish to thank members of the Maloof laboratory for helpful discussion and reading of the manuscript. R.J.C.M. was supported by a National Science Foundation (NSF) Postdoctoral Research Fellowship in Biology (IOS-1402495). This research was supported by NSF grant IOS-0923752 to C.W. and J.N.M. The authors declare no conflicts of interest.
Footnotes
This is an open-access article distributed under the terms of the Creative Commons Attribution 4.0 International License (http://creativecommons.org/licenses/by/4.0/), which permits unrestricted use, distribution, and reproduction in any medium, provided the original work is properly cited.
Communicating editor: A. H. Paterson
Literature Cited
- Baker R. L., Leong W. F., Brock M. T., Markelz R. J. C., Covington M. F., et al. , 2015. Modeling development and quantitative trait mapping reveal independent genetic modules for leaf size and shape. New Phytol. 208: 257–268. [DOI] [PubMed] [Google Scholar]
- Brock M. T., Dechaine J. M., Iniguez-Luy F. L., Maloof J. N., Stinchcombe J. R., et al. , 2010. Floral genetic architecture: an examination of QTL architecture underlying floral (Co)variation across environments. Genetics 186: 1451–1465. [DOI] [PMC free article] [PubMed] [Google Scholar]
- Broman K. W., Wu H., Sen Ś., Churchill G. A., 2003. R/qtl: QTL mapping in experimental crosses. Bioinformatics 19: 889–890. [DOI] [PubMed] [Google Scholar]
- Buckler E. S., Phelps-Durr T. L., Buckler C. S. K., Dawe R. K., Doebley J. F., et al. , 1999. Meiotic drive of chromosomal knobs reshaped the maize genome. Genetics 153: 415–426. [DOI] [PMC free article] [PubMed] [Google Scholar]
- Chalhoub B., Denoeud F., Liu S., Parkin I. A. P., Tang H., et al. , 2014. Early allopolyploid evolution in the post-Neolithic Brassica napus oilseed genome. Science 345: 950–953. [DOI] [PubMed] [Google Scholar]
- Cheng F., Wu J., Fang L., Wang X., 2012. Syntenic gene analysis between Brassica rapa and other Brassicaceae species. Front. Plant Sci. 3: 198. [DOI] [PMC free article] [PubMed] [Google Scholar]
- Cheng F., Mandáková T., Wu J., Xie Q., Lysak M. A., et al. , 2013. Deciphering the diploid ancestral genome of the Mesohexaploid Brassica rapa. Plant Cell 25: 1541–1554. [DOI] [PMC free article] [PubMed] [Google Scholar]
- Dechaine J. M., Johnston J. A., Brock M. T., Weinig C., 2007. Constraints on the evolution of adaptive plasticity: costs of plasticity to density are expressed in segregating progenies. New Phytol. 176: 874–882. [DOI] [PubMed] [Google Scholar]
- Dechaine J. M., Brock M. T., Weinig C., 2014. QTL architecture of reproductive fitness characters in Brassica rapa. BMC Plant Biol. 14: 1. [DOI] [PMC free article] [PubMed] [Google Scholar]
- Devisetty U.K., Covington M. F., Tat A. V., Lekkala S., Maloof J. N., 2014. Polymorphism identification and improved genome annotation of Brassica rapa through deep RNA sequencing. G3 (Bethesda) 4: 2065–2078. [DOI] [PMC free article] [PubMed] [Google Scholar]
- Dixon G., 2007. Vegetable Brassicas and Related Crucifers. Centre for Agriculture and Biosciences International, Wallingford, United Kingdom. [Google Scholar]
- Edwards C. E., Ewers B. E., Williams D. G., Xie Q., Lou P., et al. , 2011. The genetic architecture of ecophysiological and circadian traits in Brassica rapa. Genetics 189: 375–390. [DOI] [PMC free article] [PubMed] [Google Scholar]
- Fang Z., Pyhäjärvi T., Weber A. L., Dawe R. K., Glaubitz J. C., et al. , 2012. Megabase-scale inversion polymorphism in the wild ancestor of maize. Genetics 191: 883–894. [DOI] [PMC free article] [PubMed] [Google Scholar]
- Fulop D., Ranjan A., Ofner I., Covington M. F., Chitwood D. H., et al. , 2016. A new advanced backcross tomato population enables high resolution leaf QTL mapping and gene identification. G3 (Bethesda) 6: 3169–3184. [DOI] [PMC free article] [PubMed] [Google Scholar]
- Hammond J. P., Mayes S., Bowen H. C., Graham N. S., Hayden R. M., et al. , 2011. Regulatory hotspots are associated with plant gene expression under varying soil phosphorus supply in Brassica rapa. Plant Physiol. 156: 1230–1241. [DOI] [PMC free article] [PubMed] [Google Scholar]
- Harushima Y., Yano M., Shomura A., Sato M., Shimano T., et al. , 1998. A high-density rice genetic linkage map with 2275 markers using a single F2 population. Genetics 148: 479–494. [DOI] [PMC free article] [PubMed] [Google Scholar]
- Haupt W., Fischer T. C., Winderl S., Fransz P., Torres-Ruiz R. A., 2001. The CENTROMERE1 (CEN1) region of Arabidopsis thaliana: architecture and functional impact of chromatin. Plant J. 27: 285–296. [DOI] [PubMed] [Google Scholar]
- He Z., Cheng F., Li Y., Wang X., Parkin I. A. P., et al. , 2015. Construction of Brassica A and C genome-based ordered pan-transcriptomes for use in rapeseed genomic research. Data Brief 4: 357–362. [DOI] [PMC free article] [PubMed] [Google Scholar]
- Iniguez-Luy F. L., Lukens L., Farnham M. W., Amasino R. M., Osborn T. C., 2009. Development of public immortal mapping populations, molecular markers and linkage maps for rapid cycling Brassica rapa and B. oleracea. Theor. Appl. Genet. 120: 31–43. [DOI] [PubMed] [Google Scholar]
- Kumar S., Banks T. W., Cloutier S., 2012. SNP discovery through next-generation sequencing and its applications. Int. J. Plant Genomics 2012: 831460. [DOI] [PMC free article] [PubMed] [Google Scholar]
- Li H., Durbin R., 2009. Fast and accurate short read alignment with Burrows-Wheeler transform. Bioinformatics 25: 1754–1760. [DOI] [PMC free article] [PubMed] [Google Scholar]
- Li G., Quiros C. F., 2001. Sequence-related amplified polymorphism (SRAP), a new marker system based on a simple PCR reaction: its application to mapping and gene tagging in Brassica. Theor. Appl. Genet. 103: 455–461. [Google Scholar]
- Liu S., Liu Y., Yang X., Tong C., Edwards D., et al. , 2014. The Brassica oleracea genome reveals the asymmetrical evolution of polyploid genomes. Nat. Commun. 5: 3930. [DOI] [PMC free article] [PubMed] [Google Scholar]
- Lou P., Xie Q., Xu X., Edwards C. E., Brock M. T., et al. , 2011. Genetic architecture of the circadian clock and flowering time in Brassica rapa. Theor. Appl. Genet. 123: 397–409. [DOI] [PubMed] [Google Scholar]
- Lou P., Wu J., Cheng F., Cressman L. G., Wang X., et al. , 2012. Preferential retention of circadian clock genes during diploidization following whole genome triplication in Brassica rapa. Plant Cell 24: 2415–2426. [DOI] [PMC free article] [PubMed] [Google Scholar]
- Lowry D. B., Willis J. H., 2010. A widespread chromosomal inversion polymorphism contributes to a major life-history transition, local adaptation, and reproductive isolation. PLoS Biol. 8: e1000500. [DOI] [PMC free article] [PubMed] [Google Scholar]
- Parkin I. A., Koh C., Tang H., Robinson S. J., Kagale S., et al. , 2014. Transcriptome and methylome profiling reveals relics of genome dominance in the mesopolyploid Brassica oleracea. Genome Biol. 15: R77. [DOI] [PMC free article] [PubMed] [Google Scholar]
- R Core Team , 2015. R: A Language and Environment for Statistical Computing http://www.R-project.org
- Sherman J. D., Stack S. M., 1995. Two-dimensional spreads of synaptonemal complexes from solanaceous plants. VI. High-resolution recombination nodule map for tomato (Lycopersicon esculentum). Genetics 141: 683–708. [DOI] [PMC free article] [PubMed] [Google Scholar]
- Wang H., Wu J., Sun S., Liu B., Cheng F., et al. , 2011a Glucosinolate biosynthetic genes in Brassica rapa. Gene 487: 135–142. [DOI] [PubMed] [Google Scholar]
- Wang X., Wang H., Wang J., Sun R., Wu J., et al. , 2011b The genome of the mesopolyploid crop species Brassica rapa. Nat. Genet. 43: 1035–1039. [DOI] [PubMed] [Google Scholar]
- Yang J., Liu D., Wang X., Ji C., Cheng F., et al. , 2016. The genome sequence of allopolyploid Brassica juncea and analysis of differential homoeolog gene expression influencing selection. Nat. Genet. 48: 1225–1232. [DOI] [PubMed] [Google Scholar]
Associated Data
This section collects any data citations, data availability statements, or supplementary materials included in this article.
Supplementary Materials
Data Availability Statement
All the raw data has been deposited in the NCBI Sequence Read Archive (Project: SRP022220). Figure S1 shows SNPs, centromeric regions, and gene density across the 10 chromosomes of B. rapa. Figure S2 contains the genetic map before misplaced markers were reassigned. Table S1 contains the read mapping statistics for each RIL. Table S2 contains the SNP genotyping and genomic position for the entire RIL population. Table S3 contains the genome-wide allele segregation statistics. Table S4 contains RIL population genetic bins and scaffold original and final positions. Table S5 shows the SNP base pair calls on unplaced scaffolds. Table S6 contains the final genetic map of the RIL population. Supporting code for genetic map construction can be found at: https://github.com/rjcmarkelz/brassica_genetic_map_paper.


