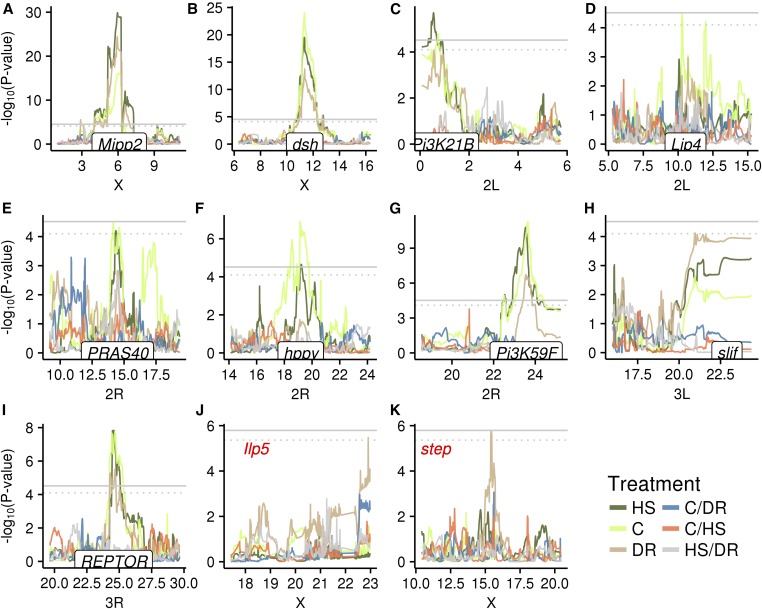
Figure 4.
Genome scans for gene expression measures within and between each diet at locations with significant QTL. Different colors denote different phenotypes. (A–I) cis-eQTLs show the location of the gene on the x-axis. (J–K) trans-eQTLs show the gene expression measure in red. Gray horizontal lines denote the significance threshold. Solid line, 5% FDR; dotted line, 10% FDR.

