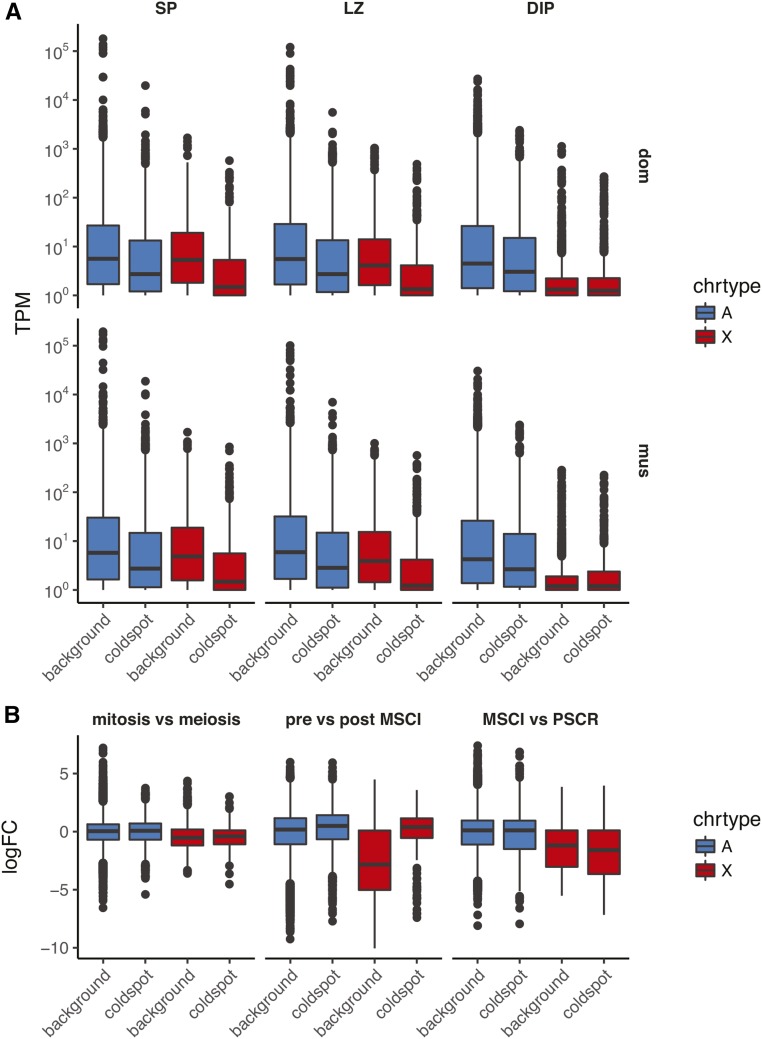
Figure 10.
Transcriptional control of coldspots in male germ cells. (A) Distribution of normalized expression levels (transcripts per million mapped reads, TPM) according to chromosome type (autosomes, A; X chromosome, X) and coldspot status in WSB/EiJ×LEWES/EiJ F1 (dom) or PWK/PhJ×CZECHII/EiJ F1 (mus) males. SP, spermatogonia; LZ, leptotene/zygotene spermatocytes; DIP, diplotene spermatocytes. (B) Distribution of log2 fold-difference (logFC) values in comparisons between stages of spermatognesis. Horizontal axis and color scheme follow (A). MSCI, meiotic sex chromosome inactivation; PSCR, postmeiotic sex chromosome repression.

