

Abstract
Importance
One in 6 American men will be diagnosed as having prostate cancer during their lifetime. Although there are no data to support the use of primary androgen-deprivation therapy (ADT) for early-stage prostate cancer, primary ADT has been widely used for localized prostate cancer, especially among older patients.
Objective
To determine the long-term survival impact of primary ADT in older men with localized (T1/T2) prostate cancer.
Design, setting, and participants
This was a population-based cohort study of 66 717 Medicare patients 66 years or older diagnosed from 1992 through 2009 who received no definitive local therapy within 180 days of prostate cancer diagnosis. The study was conducted in predefined US geographical areas covered by the Surveillance, Epidemiology, and End Results (SEER) Program. Instrumental variable analysis was used to assess the impact of primary ADT and control for potential biases associated with unmeasured confounding variables. The instrumental variable comprised combined health services areas with various usage rates of primary ADT. The analysis compared survival outcomes in the top tertile areas with those in the bottom tertile areas.
Main Outcomes and Measures
Prostate cancer-specific survival and overall survival.
Results
With a median follow-up of 110 months, primary ADT was not associated with improved 15-year overall or prostate cancer-specific survival following the diagnosis of localized prostate cancer. Among patients with moderately differentiated cancers, the 15-year overall survival was 20.0% in areas with high primary ADT use vs 20.8% in areas with low use (difference: 95% CI, −2.2% to 0.4%), and the 15-year prostate cancer survival was 90.6% in both high- and low-use areas (difference: 95% CI, -1.1% to 1.2%). Among patients with poorly differentiated cancers, the 15-year cancer-specific survival was 78.6% in high-use areas vs 78.5%, in low-use areas (difference: 95% CI, −1.8% to 2.4%), and the 15-year overall survival was 8.6% in high-use areas vs 9.2% in low-use areas (difference: 95% CI, -1.5% to 0.4%).
Conclusions and Relevance
Primary ADT is not associated with improved long-term overall or disease-specific survival for men with localized prostate cancer. Primary ADT should be used only to palliate symptoms of disease or prevent imminent symptoms associated with disease progression.
As a consequence of widespread prostate-specific antigen (PSA) screening, mare than 90% of newly diagnosed prostate cancel cases in the United States are clinically localized to the prostate.1 Standard treatment options include surgery, radiation, or conservative management.2 Although there are no data to support the use of androgen-deprivation therapy (ADT) for early stage-prostate cancer, ADT has been widely used as a primary therapy for localized prostate cancer, especially among older patients.3,4 Because the cancers of most patients treated with ADT will become refractory within a few years and many adverse effects are associated with the use of ADT, the timing of ADT is crucial.5
We previously reported4 that primary ADT did not improve survival for men with localized moderately differentiated prostate cancer but was associated with a possible borderline survival benefit for patients with poorly differentiated cancer over a 10-year period following diagnosis. We have also reported that ADT does not delay the use of secondary cancer therapies and that ADT is associated with an increased risk of fracture and subsequent mortality.6,7 One of the major limitations of our earlier publication was the limited length of follow-up.4 To determine whether primary ADT provides a long-term survival advantage, we expanded our study to include more Surveillance, Epidemiology and End Results (SEER) regions and extended the follow-up an additional 6 years, from 2003 to 2009. Herein, we report updated findings.
Methods
Data Sources
Data for this study were obtained from the population-based SEER program database and linked Medicare files. The SEER regions covered approximately 14% of the US population before 2001 and 25% thereafter.8 Medicare covers approximately 97% of US persons at least 65 years old, of whom 73% had fee-for-service health care.9 Approximately 93% of the Medicare claims for those with fee-for-service health care are linked to the SEER database.8
Study Participants
The study received institutional review board approval from Rutgers University, the Surveillance, Epidemiology, and End Results (SEER) program, and the Centers for Medicare and Medicaid Services. The study cohort consisted of men who were SEER residents and diagnosed as having stage T1-T2 prostate cancer between 1992 and 2009. Participants did not receive compensation for participation. Men receiving definitive local therapy (eg, prostatectomy or radiation) within 180 days of diagnosis were excluded. Men who died within 180 days of diagnosis or who had regional or metastatic cancer were also excluded. To ensure that the Medicare claims documented patients' health care encounters accurately, study participants were included only if they had both Medicare Part A (hospitalization) and Part B (physician and outpatient) as their primary health insurance coverage during the study period. (See eFigure 1 in the Supplement.)
Primary ADT
Both SEER records and Medicare claims were used to evaluate the use of cancer therapy. Primary ADT was defined as ADT initiated as primary cancer therapy to men with localized prostate cancer in the absence of other treatments, such as surgery or radiation, during the first 180 days following diagnosis. Conservative management was defined as no evidence of receiving surgery, radiotherapy, or ADT during this time. Primary ADT consists of either bilateral orchiectomy or the use of luteinizing hormone-releasing hormone agonists or antagonists, which were identified from Medicare physician, inpatient, or outpatient claims using a previously validated algorithm.10,11 This algorithm has a positive predictive value of 95% when compared with medical record review.12
Study End Points and Covariates
Data on overall and prostate cancer-specific survival were available through December 31, 2011, and December 31, 2009, respectively. Underlying cause of death was determined from data in the SEER records. Studies have shown that cause of death in the SEER data confirm information available in medical records in 87% to 88% of cases.13,14
Charlson comorbidity score, a powerful predictor of longevity in men with localized prostate cancer,15,17 was derived from Medicare inpatient, outpatient, and physician claims during the year prior to prostate cancer diagnosis using a validated algorithm.18,19 The SEER coding rules prior to 2004 aggregated Gleason scores 2 to 4, 5 to 7, and 8 to 10 into well, moderate, and poorly differentiated cancers, respectively. Starting in 2004, tumors with Gleason scores of 7 to 10 were grouped together in the poorly differentiated cancer category. To assess the outcome of cancers with Gleason scores of 8 to 10, we conducted a sensitivity analysis excluding grade 7 cancers. We used clinical extension information provided by SEER to determine cancer stage (T1, T2).
Instrumental Variable Analysis
A health service area (HSA), defined as 1 or more counties that are relatively self-contained with respect to the provision of routine hospital care,20 is the building block for the instrumental variable (IV). This IV was chosen because differences in the use of primary ADT across different HSAs are much more likely to be associated with nonmedical factors, such as local treatment practices, rather than factors related to the prostate cancer itself.3
To construct the IV, we first calculated the proportion of patients who received primary ADT in each HSA. Each HSA with fewer than 50 cases was combined with the nearest (in terms of distance between geographic centers) HSA. The threshold of 50 cases or more was chosen because lower thresholds were associated with more imbalances in patient characteristics in areas with high and low use of primary ADT (hereinafter, high-and low-use areas). The algorithm produced 122 use areas. High- and low-use areas corresponded to the top and bottom tertiles of primary ADT use (main analysis). We also used an alternative approach and constructed a second IV using the median of the use as the cutoff point to define high- and low-use areas. We chose to stratify the analysis by cancer grade so that it was not necessary to assume that the patterns of primary ADT use were the same for all cancer grades within the same area. Our data confirmed that primary ADT use varied widely across HSAs, a key requirement of an IV.
Statistical Analysis
Data on cancer-specific and overall mortality were available through December 31, 2009, and December 31, 2011, respectively. The primary analysis relied on IV analytical methods,21 which can account for both measured and unmeasured (eg, PSA, family history, diet, weight) confounders. For the IV analyses, the treatment and region variables were replaced by a single covariate indicating high or low use (the IV). For the main analysis, only patients in the top and bottom tertile of primary ADT use were included in the IV analysis. Additional IV analysis included the entire population and used the median use value as the cutoff.
To account for variability in hazard rates among the HSAs, we included a normally distributed random effects term, known as a “frailty.”21,24 We compared high- and low-use areas by estimating the hazard ratios (HRs) and differences in 15-year survival rates for this covariate-adjusted frailty model. The population-adjusted survival rates in high- and low-use areas were obtained by averaging these rates across the population.25 Means and 95% confidence intervals of the means were then computed from 1000 bootstrap samples.26 All patients, including those in the middle tertile, were included in the bootstrap analysis. We computed the cumulative incidence probabilities of death due to prostate cancer by treating other causes of death as competing risks. The proportional hazards assumptions were checked using log-log plots and the Schoenfeld residuals test25 and were found to be satisfactory. All the subgroup analyses (by cancer grade) were prespecified and 95% CIs were derived from the bootstrap estimates. Power calculations for determining the difference in survival between highland low-use HSAs were performed using simulations. Overall, the study had 80% power to detect a 12% difference between high- and low-use areas for prostate cancer-specific survival. For men with poorly differentiated cancer, the study had 80% power to detect a 9% risk reduction in prostate cancer-specific mortality.
For comparison with the IV method, we also fitted Cox proportional hazards model, which included the following covariates: age, race, zip code level income, zip code level education, SEER region (Cox model only), urban or rural area, marital status, cancer grade (low or high risk), clinical T stage, Charlson comorbidity score, year of diagnosis, and state buy-in for Medicare (for individuals with limited income and resources).
Results
Baseline Characteristics
The study cohort consisted of 66 717 men 66 years or older with localized prostate cancer diagnosed between 1992 and 2009-By definition, none of these men had received definitive local therapies, such as radiation or surgery, during the first 180 days following diagnosis. The median follow-up for overall survival was 110 months. Patients receiving primary ADT were slightly older (79 vs 77 years) and sicker (15.2% vs 12.5% with a Charlson score of 2 or higher) and were more likely to have high-risk disease (47.7% vs 23.0%) and higher mean PSAs (19.5 vs 11.1) than those treated conservatively (Table 1).
Table 1. Characteristics of Study Cohorta.
| Characteristic | No. (%) | |
|---|---|---|
| Primary ADT (n = 25 125) | Conservative Management (n = 41 592) | |
| Age, median (IQR), y | 79 (75-83) | 77 (72-81) |
| Black race | 2491 (9.9) | 4549 (10.9) |
| Married at diagnosis | 14 285 (56.9) | 25 322 (60.9) |
| Urban residence | 20 592 (81.9) | 34 677 (83.4) |
| Income, median (IQR), US, $ | 44 107 (34 214-57 968) | 45 567 (34 843-59 930) |
| SEER regionsb | ||
| Northeast | 5461 (21.7) | 6896 (16.6) |
| North central | 5352 (21.3) | 8359 (20.1) |
| West | 10 344 (41.2) | 20 720 (49.8) |
| South | 3756 (15.0) | 5092 (12.2) |
| Cancer grade, differentiated | ||
| Well | 864 (3.4) | 4998 (12.0) |
| Moderately | 12 288 (48.9) | 27 018 (64.9) |
| Poorly | 11 973 (47.7) | 9576 (23.0) |
| Clinical stage at diagnosis | ||
| T1 | 9242 (36.8) | 21 360 (51.4) |
| T2 | 15 883 (63.2) | 20 232 (48.6) |
| PSA, mean (SD) | 19.5 (22.9) | 11.1 (14.8) |
| Gleason score | ||
| 2-6 | 2871 (31.2) | 10 604 (64.3) |
| 7 | 3464 (37.6) | 4452 (26.9) |
| ≥8 | 2874 (31.2) | 1447 (8.8) |
| Comorbidity status | ||
| Charlson comorbidity score | ||
| 0 | 15 624 (62.2) | 28 000 (67.3) |
| 1 | 5694 (22.7) | 8386 (20.2) |
| ≥2 | 3807 (15.2) | 5206 (12.5) |
| Year of cancer diagnosis, range | ||
| 1992-1997 | 4326 (17.2) | 10 179 (24.5) |
| 1998-2003 | 11 590 (46.1) | 14 910 (35.9) |
| 2004-2009 | 9209 (36.7) | 16 503 (39.7) |
Abbreviations: ADT, androgen-deprivation therapy; IQR, interquartile range; PSA, prostate-specific antigen; SEER, Surveillance, Epidemiology, and End Results.
Race was self-determined by the patients. For cancer grade, a Gleason score of 2 to 4,5 to 7, and 8 to 10 corresponded to well differentiated, moderately differentiated, and poorly differentiated disease before 2003, respectively. A Gleason score of 2 to 4,5 to 6, and 7 to 10 corresponded to well differentiated, moderately differentiated, and poorly differentiated disease thereafter, respectively. Clinical extension information provided by SEER was used to determine cancer stage (Tl, T2). Charlson comorbidity score was derived from Medicare claims during the year before prostate cancer diagnosis by using a validated algorithm. The PSA level and Gleason score were available after 2003.
The primary ADT group has 212 patients with unknown SEER group, and the conservative management group has 525 with unknown SEER region.
The effect of the imbalanced distributions in comorbidity status, cancer grade, and PSA was minimized by using a stratified IV analysis approach. Among patients with high-risk disease, for example, the distributions of comorbidity score, PSA, and Gleason score were very similar in high- and low-use areas, indicating that our selected IV effectively equalized the uneven distributions of risk factors. Use rates of primary ADT varied from 22.3% to 38.8% for moderately differentiated cancers and from 48.0% to 63.7% for poorly differentiated cancers. When we extended the period defining primary ADT from 180 days to 18 months, the patterns of high and low use remained the same (Table 2). Among patients initially treated with conservative therapy, 29% were eventually placed on ADT.
Table 2. Characteristics of Men With Localized Prostate Cancer in High-Use and Low-Use Primary ADT Health Service Areasa.
| Characteristic | Cancer Grade | |||||
|---|---|---|---|---|---|---|
| Moderately Differentiated | Poorly Differentiated | All Localized | ||||
| High Use (n = 16 358) | Low Use (n = 13 480) | High Use (n = 7452) | Low Use (n = 7220) | High Use (n = 23 319) | Low Use (n = 22 302) | |
| Primary ADT within 180 d | 6345 (38.8) | 3008 (22.3) | 4748 (63.7) | 3462 (48.0) | 10 881 (46.7) | 6553 (29.4) |
| Primary ADT within 18 mo | 7582 (46.4) | 3894 (28.9) | 5539 (74.3) | 4188 (58.0) | 12 868 (55.2) | 8250 (37.0) |
| Duration of primary ADT use, mean (SD), mo | 53 (43) | 49 (43) | 44 (33) | 39 (33) | 49 (39) | 46 (40) |
| Age at diagnosis, median (IQR), y | 77 (73-81) | 77 (72-81) | 80 (75-84) | 79 (74-84) | 78 (73-82) | 77 (73-82) |
| Zip code level income, median (IQR), US $ | 44 099 (33 965-60 591) | 46 002 (35 792-57 418) | 43 074 (34 041-60 646) | 43 034 (32 466-54 229) | 43 994 (34 226-61 026) | 44 909 (34 655-56 912) |
| Charlson score, %b,c | ||||||
| 0 | 10 406 (63.6) | 9542 (70.8) | 4664 (62.6) | 4520 (62.6) | 14 889 (63.8) | 15 550 (69.7) |
| 1 | 3633 (22.2) | 2514 (18.6) | 1622 (21.8) | 1587 (22.0) | 5104 (21.9) | 4299 (19.3) |
| ≥2 | 2319 (14.2) | 1424 (10.6) | 1166 (15.6) | 1113 (15.4) | 3326 (14.3) | 2453 (11.0) |
| Clinical stage Tla | 7671 (46.9) | 6142 (45.6) | 3099 (41.6) | 2680 (37.1) | 11 269 (48.3) | 9836 (44.1) |
| PSA, ng/mL, meanc | 9.7 (0.2) | 9.3 (0.2) | 20.4 (0.5) | 18.0 (0.4) | 14.8 (0.2) | 13.9 (0.2) |
| Gleason score, %c | ||||||
| 2-6 | 5105 (31.2) | 4774 (35.4) | NA | NA | 5043 (21.6) | 4496 (20.2) |
| 7 | NA | NA | 2502 (33.6) | 2692 (37.3) | 2846 (12.2) | 2586 (11.6) |
| ≥8 | NA | NA | 1517 (20.4) | 1450 (20.1) | 1695 (7.3) | 1417 (6.4) |
Abbreviations: ADT, androgen-deprivation therapy; IQR, interquartile range; NA, not applicable; PSA, prostate-specific antigen.
Data are given as number (percentage).
See Table 1 for explanations of Charlson score and clinical stage tumor (T1).
The PSA values and Gleason scores were based on patients diagnosed in 2004 or thereafter.
Survival Outcomes
There were 5275 deaths from prostate cancer and 39 801 deaths from all causes in the study cohort. Because patients treated with primary ADT have more unfavorable cancer risk factors (Table 1), it is not surprising that prostate cancer-specific and overall survival rates were significantly worse for patients treated with primary ADT when analyses were conducted using a Cox multivariate model (Table 3). The Cox approach, however, did not include the IV, and hence was unable to adjust for unmeasured confounders. Based on an IV analysis approach using cohort tertiles, the 15-year prostate cancer-specific survival rate was 85.4% vs 85.4% (HR, 1.01; 95% CI, 0.90-1.14), and the 15-year overall survival rate was 15-9% vs 16.8% (HR, 1.04; 95% CI, 0.99-1.09) in high-and low-use areas. In preplanned IV analyses by cancer grade, similar patterns were observed in patients with low-and high-risk disease (Table 3 and Table 4 and Figure). Among patients with moderately differentiated cancers, the 15-year overall survival rate was 20.0% in high-use areas vs 20.8% in low-use areas (difference: 95% CI, -2.2% to 0.4%), and the 15-year prostate cancer survival rate was 90.6% in both high- and low-use areas (difference: 95% CI, −1.1% to 1.2%). Among patients with poorly differentiated cancers, the 15-year cancer-specific survival rate was 78.6% in high-use areas vs 78.5% in low-use areas (difference: 95% CI, −1.8% to 2.4%), and the 15-year overall survival rate was 8.6% in high-use areas vs 9.2% in low-use areas (difference: 95% CI, −1.5% to 0.4%). When cancers with Gleason scores of 7 were excluded from the poorly differentiated cancer group, the results were similar. The IV analysis-based HR changed from 0.99 (95% CI, 0.84-1.17) to 0.96 (95% CI, 0.81-1.13) for prostate cancer mortality and from 1.03 (95% CI, 0.96-1.10) to 1.01 (95% CI, 0.93-1.09) for overall mortality.
Table 3. Risk of Mortality According to Cancer Risk and Treatment for the Cox Multivariate and Instrumental Variable.
| Cancer Risk | Primary ADT | Conservative Management | Hazard Ratio (95% CI) | |||||||||
|---|---|---|---|---|---|---|---|---|---|---|---|---|
| Events/Person-year | Rate per 100 | Events/Person-year | Rate per 100 | Unadjusted | Adjusted | |||||||
| Conventional Cox Multivariate Resultsa | ||||||||||||
| Prostate cancer-specific mortality | ||||||||||||
| Moderately differentiated | 995/67 316 | 1.5 | 1230/145 443 | 0.8 | 1.79 (1.65-1.95) | 1.65 (1.52-1.8) | ||||||
| Poorly differentiated | 1777/46 572 | 3.8 | 993/36 199 | 2.7 | 1.39 (1.28-1.5) | 1.37 (1.27-1.49) | ||||||
| All localized | 2837/119 902 | 2.4 | 2438/219 027 | 1.1 | 2.21 (2.09-2.33) | 1.53 (1.45-1.63) | ||||||
| Overall mortality | ||||||||||||
| Moderate Ly differentiated | 8037/76 992 | 10.4 | 14 182/173 536 | 8.2 | 1.29 (1.26-1.33) | 1.20 (1.16-1.23) | ||||||
| Poorly differentiated | 7868/56 305 | 14.0 | 5233/45 975 | 11.4 | 1.24 (1.19-1.28) | 1.16 (1.12-1.21) | ||||||
| All localized | 16 589/139 720 | 11.9 | 23 212/259 650 | 8.9 | 1.39 (1.36-1.41) | 1.19 (1.17-1.22) | ||||||
| Instrumental Variable Analysis Results | ||||||||||||
| Prostate cancer-specific mortality | ||||||||||||
| Moderately differentiated | 991/87 811 | 1.1 | 811/72 818 | 1.1 | 1.02 (0.85-1.21) | 1.00 (0.85-1.18) | ||||||
| Poorly differentiated | 996/28 873 | 3,4 | 928/27 186 | 3.4 | 1.02 (0.85-1.23) | 0.99 (0.84-1.17) | ||||||
| Ail localized | 1890/112 769 | 1.7 | 1849/115 151 | 1.6 | 1.03 (0.91-1.17) | 1.01 (0.90-1.14) | ||||||
| Overall mortality | ||||||||||||
| Moderately differ enlisted | 9640/102 814 | 9.4 | 7436/86 074 | 8.6 | 1.09 (1.01-1.17) | 1.03 (0.96-1.10) | ||||||
| Puurty differentiated | 4721/35 300 | 13.4 | 4384/33 699 | 13.0 | 1.06 (0.98-1.15) | 1.03 (0.96-1.10) | ||||||
| All localized | 13 633/134 658 | 10.1 | 13 314/135 202 | 9.8 | 1.06 (1.00-1.12) | 1.04 (0.99-1.09) | ||||||
Abbreviation: ADT, primary androgen-deprivation therapy.
Covariates included age, race, comorbidity status, cancer stage, zip code income quartiles, zip code education quartiles, urban area, marital status, year of diagnosis. Surveillance, Epidemiology, and End Results (SEER) region, state buy-in status and cancer grade (all patients only). The SEER region was not included in the instrumental variable analysis.
Table 4. Adjusted Percentage of Prostate Cancer-Specific and Overall 15-Year Survival in High- and Low-Use Areasa.
| Cancer Grade | High Primary ADT Use | Low Primary ADT Use | High vs Low Difference (95% CI) | ||
|---|---|---|---|---|---|
| Deaths/Person-year | Adjusted Survival, % | Deaths/Person-year | Adjusted Survival, % | ||
| Prostate cancer-specific survivalb | |||||
| Moderately differentiated | 987/87 649 | 90.6 | 802/72 579 | 90.6 | 0.04 (−1.1 to 1.2) |
| Poorly differentiated | 995/28 858 | 78.6 | 928/27 162 | 78.5 | 0.05 (−1.8 to 2.4) |
| All localized | 1886/112 544 | 85.4 | 1835/114 676 | 85.4 | 0.02 (−1.1 to 1.2) |
| Overall survivalc | |||||
| Moderately differentiated | 9553/102 341 | 20.0 | 7313/85 428 | 20.8 | −0.8 (−2.2 to 0.4) |
| Poorly differentiated | 4705/35 259 | 8.6 | 4362/33 629 | 9.2 | −0.5 (−1.5 to 0.4) |
| All localized | 13 522/134 094 | 15.9 | 13 091/134 015 | 16.8 | −0.8 (−1.8 to−0.1) |
Abbreviation: ADT, primary androgen-deprivation therapy.
Covariates included age, race, comorbidity status, cancer stage, zip code income quartiles, zip code education quartiles, urban area, marital status, year of diagnosis, state buy-in status and cancer grade (all patients only). The 95% CIs are bootstrapped. Because date of last follow-up differed for overall (December 31, 2011) and cancer-specific survival (December 31, 2009), the number of person-years of follow-up differs for each end point.
In order to calculate prostate cancer-specific survival, death due to other cause was treated as a competing risk.
Most patients were followed for less than 10 years. Therefore, the observed 15 years overall survival (16%-20%) is far less than the proportion of patients who remained alive (40%) at the end of the study.
Figure. Adjusted Prostate Cancer-Specific Survival and Overall Survival in High Use and Low Use of Health Service Areas (HSAs) by Cancer Grade.
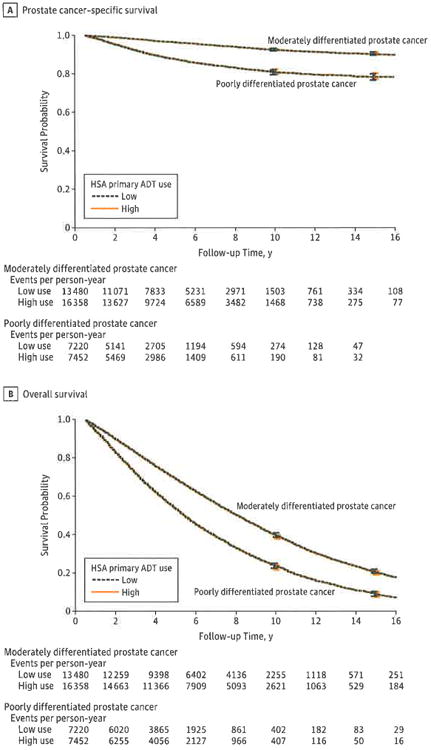
Results were adjusted for age, race, comorbidity status, cancer stage, zip code income, zip code education, urban area, marital status, year of diagnosis, state buy-in status.
A, Prostate cancer-specific survival was similar in areas with high and low use of primary androgen deprivation therapy (ADT) (high use and low use, respectively) among men with moderately differentiated cancer and poorly differentiated cancer.
B, Overall survival was similar in highland low-use areas among men with moderately differentiated cancer and poorly differentiated cancer.
To assess the robustness of the conclusion, we used an alternative IV (the median use value as the cutoff and included all HSAs in the analysis), and the results were similar (eTable 1 in the Supplement). The distribution of risk factors was comparable in the high- and low-use areas using the median use as the cutoff (eTable 2 in the Supplement),
Discussion
Few data are available comparing primary ADT with conservative treatment or any other established treatment option, including surgery or radiation, in men with localized (stages Tl-T2, NO, MO) prostate cancer. Our IV-based analysis shows that primary ADT is not associated with improved 5-year prostate cancer-specific or overall survival rates among patients with stage Tl or T2 prostate cancer. These findings are consistent with those of the European Organization of Research and Treatment of Cancer (EORTC) trial 30891, in which patients in immediate ADT and deferred ADT arms (for stages TO-T4, NO-2, MO disease) had similar prostate cancer mortality after a median follow-up of 12.8 years. Further analysis of EORTC 30891 showed that the patients most likely to benefit from primary ADT are those who have aggressive cancer, defined as a PSA doubling time of less than 12 months or PSA level greater than 50.27 Most contemporary patients in the United States with stage T1/T2 prostate cancer have a PSA level below 50 ng/mL at diagnosis. In this study cohort, we found that only 57% of patients had a PSA level greater than 50 ng/mL at diagnosis.
For low-risk patients, neither our previous study nor the updated analysis showed any improvement in survival associated with primary ADT use.4 For high-risk patients, our earlier publication showed a borderline survival benefit, which was not confirmed in the updated study.4 This pattern is similar to that of the British Medical Research Council trial, which initially showed a survival benefit for patients with stage Mo prostate cancer receiving immediate ADT but no survival benefit with longer follow-up.28
Results obtained from a Cox model that adjusted only for measured confounding factors differed significantly from those derived from the IV approach. Results from the Cox model showed less favorable outcomes among men receiving primary ADT, but this most likely reflects a selection bias toward men with higher risk disease (Table 1). Differences in outcomes based on the Cox model vanished when an IV-analysis approach was used. These observations suggest that there is considerable unaccounted residual bias associated with the Cox model analytic methods and demonstrate an important advantage to the IV approach. Furthermore, because an IV approach includes “real-world” patients it has an advantage over clinical trials that often exclude patients because of age, comorbidities, or short life expectancy.
As a consequence of the 2001 SEER expansion and the additional years of recruitment, this updated cohort had a sample size 3 times larger than that of our previous report.4 The current study included 122 HSAs compared with only 66 in the previous study. Most of the original 66 HSAs stayed in the same high- or low-use category. Only 1.5% HSAs switched from a high-use area to a low-use area or vice versa. The average sample size of the HSAs in this study was much larger than those in the previous study. Because the size of some of the HSAs in the current study was very large (N = 7280), we implemented a “frailty model” to account for the variability in hazard rates among the HSAs in this updated analysis.22
Because of the long follow-up, which covered close to 20 years, changing disease and treatment trends have had a considerable impact on clinical outcomes. Prostate-specific antigen screening practices have dramatically increased the incidence of prostate cancer, resulting in the diagnosis of many more men with relatively low grade disease. Changes in prostate cancer grading standards have resulted in a notable grade migration toward higher Gleason scores so that contemporary cancers are rarely graded lower than 3 + 3. As a consequence, cancer survival rates have improved dramatically for men with newly diagnosed, localized disease. How much of this improvement should be attributed to diagnostic “lead time” rather than life extension is more difficult to assess. An important consequence of these trends is that men now live with their diagnosis for many more years. Physicians and patients often believe that treatment is necessary and beneficial. Our data suggest that this may not be the case, at least for PADT.
Our study has some limitations that are mostly related to the data. Since the study was limited to men 66 years or older, the results could differ for younger men. Since the SEER-Medicare database does not capture information on the use of oral antiandrogens, some of the patients treated conservatively may have been taking antiandrogens. Based on data from CaPSURE,29 the use of antiandrogens as sole treatment for localized prostate cancer is relatively uncommon (approximately 2%), and therefore it is unlikely that this small subset could have had a material impact on the outcomes. Because the differences in utilization between high- and low-use areas are relatively modest, it is possible that our study does not have sufficient power to detect a difference. Our power calculation indicates that it is unlikely that the differences in survival outcomes will be greater than 9% for poorly differentiated cancer and 12% for moderately differentiated cancer.
Although our IV had excellent properties and greatly reduced the imbalance in risk factors (Table 1 and Table 2), some unmeasured factors may have been imbalanced between groups. Sensitivity analyses, using an alternative IV (using the median use value as the cutoff), yielded similar results (eTable l in the Supplement) suggesting that our conclusions are robust. Our study is also limited by the lack of data on physician-level variables. Patient treatment choices are frequently influenced by a treating urologist's beliefs rather than tumor or patient characteristics.30
Conclusions
Our analyses suggest that primary ADT is not associated with improved survival among most older men with stage Tl or T2 prostate cancers. For patients with less aggressive cancers, deferred ADT is safe and reduces the risks of treatment-associated adverse effects, such as osteoporosis, weight gain, decreased libido, decreased muscle tone, diabetes mellitus, and metabolic syndrome. These findings, the fact that primary ADT does not delay the use of secondary cancer therapies,7 and the fact that randomized clinical trials show no survival benefit,27 demonstrate that there is a limited role for ADT as primary therapy for men with localized prostate cancer. Health care providers and their older patients should carefully weigh our findings against the considerable adverse effects and costs associated with primary ADT before initiating this therapy in men with clinically localized prostate cancer.
Supplementary Material
Acknowledgments
Role of the Sponsor: The NCI not play any role in the design and conduct of the study; collection, management, analysis, and interpretation of the data; preparation, review, or approval of the manuscript; and decision to submit the manuscript for publication. The performance and design of this study were reviewed and approved by both the NCI and Center for Medicare and Medicaid Services.
Funding/Support: This study was supported by National Cancer Institute (NCI) grant No. ROI CA116399 and in part by Cancer Institute of New Jersey core grant NCI CA-72720-10.
Footnotes
supplemental content at //jamainternalmedicine.com
Author Contributions: Dr Lu-Yao had full access to all the data in the study and takes responsibility for the integrity of the data and the accuracy of the data analysis.
Study concept and design: Lu-Yao, Albertsen, Yao.
Acquisition, analysis, or interpretation of data: All authors.
Drafting of the manuscript: Lu-Yao, Albertsen, Moore, Shih, Yao.
Critical revision of the manuscript for important intellectual content: Albertsen, Lin, DiPaola, Yao.
Statistical analysis: Lu-Yao, Albertsen, Moore, Shih, Lin.
Obtained funding: Lu-Yao.
Administrative, technical, or material support: Lu-Yao, Lin, DiPaola, Yao.
Study supervision: Lu-Yao, Albertsen, Moore, Shih, DiPaola, Yao.
Conflict of Interest Disclosures: During the past 5 years, Dr Lu-Yao has received a consulting fee from the Merck Research Laboratory, Dr Shih has received clinical research funding from Myriad, and Dr Yao has been employed by Schering-Plough and Merck in the area of clinical cancer research.
Disclaimer: This study used the Linked SEER-Medicare Database. The interpretation and reporting of these data are the sole responsibility of the authors. The content of the information does not necessarily reflect the position or the policy of the US Government, and no official endorsement should be inferred.
Additional Contributions: The authors acknowledge the efforts of the Applied Research Branch, Division of Cancer Prevention and Population Science, NCI; the Office of Information Services, and the Office of Strategic Planning, Health Care Financing Administration; Information Management Services Inc; and the SEER Program tumor registries in the creation of the SEER-Medicare database. Shunhua Shen, MS, updated the data and provided modifications to this publication. She was paid by Rutgers Cancer institute of New Jersey Population Science while working on this study and is now affiliated with Smith Hanley Consulting.
References
- 1.Cooperberg MR, Broering JM, Litwin MS, et al. CaPSURE Investigators. The contemporary management of prostate cancer in the United States: lessons from the cancer of the prostate strategic urologic research endeavor (CaPSURE), a national disease registry. J Urol. 2004;171(4):1393–1401. doi: 10.1097/01.ju.0000107247.81471.06. [DOI] [PubMed] [Google Scholar]
- 2.National Comprehensive Cancer Network. NCCN Clinical Practice Guidelines in Oncology. [Accessed January 30, 2013];Prostate Cancer. http://www.nccn.org/professionals/physician_gls/f_guidelines.asp#prostate.
- 3.Shahinian VB, Kuo YF, Freeman JL, Orihuela E, Goodwin JS. Increasing use of gonadotropin-releasing hormone agonists for the treatment of localized prostate carcinoma. Cancer. 2005;103(8):1615–1624. doi: 10.1002/cncr.20955. [DOI] [PubMed] [Google Scholar]
- 4.Lu-Yao GL, Albertsen PC, Moore DF, et al. Survival following primary androgen deprivation therapy among men with localized prostate cancer. JAMA. 2008;300(2):173–181. doi: 10.1001/jama.300.2.173. [DOI] [PMC free article] [PubMed] [Google Scholar]
- 5.Studer UE, Collette L, Whelan P, et al. EORTC Genitourinary Group. Using PSA to guide timing of androgen deprivation in patients with TO-4 NO-2 MO prostate cancer not suitable for local curative treatment (EORTC 30891) Eur Urol. 2008;53(5):941–949. doi: 10.1016/j.eururo.2007.12.032. [DOI] [PubMed] [Google Scholar]
- 6.Shao YH, Moore DF, Shih W, Lin Y, Jang TL, Lu-Yao GL. Fracture after androgen deprivation therapy among men with a high baseline risk of skeletal complications. BJU Int. 2013;111(5):745–752. doi: 10.1111/j.1464-410X.2012.11758.x. [DOI] [PMC free article] [PubMed] [Google Scholar]
- 7.Lu-Yao GL, Albertsen PC, Li H, et al. Does primary androgen-deprivation therapy delay the receipt of secondary cancer therapy for localized prostate cancer? Eur Urol. 2012;62(6):966–972. doi: 10.1016/j.eururo.2012.05.003. [DOI] [PMC free article] [PubMed] [Google Scholar]
- 8.Warren JL, Klabunde CN, Schrag D, Bach PB, Riley GF. Overview of the SEER-Medicare data: content, research applications, and generalizability to the United States elderly population. Med Care. 2002;40(8) 1:IV-3–IV-18. doi: 10.1097/01.MLR.0000020942.47004.03. [DOI] [PubMed] [Google Scholar]
- 9.Medicare and Medicaid Statistical Supplement. [Accessed Decenber 10, 2013];2013 http://www.cms.gov/Research-Statistics-Data-and-Systems/Statistics-Trends-and-Reports/MedicareMedicaidStatSupp/2031.html.
- 10.Shahinian VB, Kuo YF, Freeman JL, Goodwin JS. Risk of fracture after androgen deprivation forprostate cancer. N Engl J Med. 2005;352(2):154–164. doi: 10.1056/NEJMoa041943. [DOI] [PubMed] [Google Scholar]
- 11.Seidenfeld J, Samson DJ, Hasselblad V, et al. Single-therapy androgen suppression in men with advanced prostate cancer: a systematic review and meta-analysis. Ann Intern Med. 2000;132(7):566–577. doi: 10.7326/0003-4819-132-7-200004040-00009. [DOI] [PubMed] [Google Scholar]
- 12.Dolan M, Kim S, Shao YH, Lu-Yao G. Authentication of algorithm to detect metastases in men with prostate cancer using ICD-9 codes. Epidemiol Res Int. 2012 doi: 10.1155/2012/970406. [DOI] [PMC free article] [PubMed] [Google Scholar]
- 13.Albertsen PC, Walters S, Hanley JA. A comparison of cause of death determination in men previously diagnosed with prostate cancer who died in 1985 or 1995. J Urol. 2000;163(2):519–523. [PubMed] [Google Scholar]
- 14.Penson DF, Albertsen PC, Nelson PS, Barry M, Stanford JL. Determining cause of death in prostate cancer: are death certificates valid? J Natl Cancer Inst. 2001;93(23):1822–1823. doi: 10.1093/jnci/93.23.1822. [DOI] [PubMed] [Google Scholar]
- 15.Albertsen PC, Fryback DG, Storer BE, Kolon TF, Fine J. Long-term survival among men with conservatively treated localized prostate cancer. JAMA. 1995;274(8):626–631. [PubMed] [Google Scholar]
- 16.Fowler JE, Jr, Terrell FL, Renfroe DL. Comorbidities and survival of men with localized prostate cancer treated with surgery or radiation therapy. J Urol. 1996;156(5):1714–1718. [PubMed] [Google Scholar]
- 17.D'Hoore W, Sicotte C, Tilquin C. Risk adjustment in outcome assessment: the Charlson comorbidity index. Methods Inf Med. 1993;32(5):382–387. [PubMed] [Google Scholar]
- 18.Deyo RA, Cherkin DC, Ciol MA. Adapting a clinical comorbidity index for use with ICD-9-CM administrative databases. J Clin Epidemiol. 1992;45(6):613–619. doi: 10.1016/0895-4356(92)90133-8. [DOI] [PubMed] [Google Scholar]
- 19.Klabunde CN, Potosky AL, LeglerJM, Warren JL. Development of a comorbidity index using physician claims data. J Clin Epidemiol. 2000;53(12):1258–1267. doi: 10.1016/s0895-4356(00)00256-0. [DOI] [PubMed] [Google Scholar]
- 20.Makuc D, Haglund B, Ingram D, Kleinman J, Feldman J. Vital and Health Statistics: Health Service Areas for the United States. Hyattsville, MD: National Center for Health Statistics; 1991. [PubMed] [Google Scholar]
- 21.Angrist J, Imbens G, Rubin D. Identification of causal effects using instrumental variables. J Am Stat Assn. 1996;91(434):444–455. [Google Scholar]
- 22.Therneau T. coxme: mixed effects Cox models. [Accessed December 10, 2013];R package, version 2.2.3. http://cran.r-project.org/web/packages/coxme.
- 23.Therneau TM, Grambach PM, Pankratz VS. Penalized survival models and frailty. J Comput Graphical Statistics. 2003;12(1):156–175. [Google Scholar]
- 24.Language RA. R Core Team. Environmentfor Statistical Computing. Vienna, Austria: R Foundation for Statistical Computing; 2012. [Accessed June 5, 2014]. http://www.r-project.org. [Google Scholar]
- 25.Therneau TM, Grambsch PM. Modeling Survival Data: Extending the Cox Model. New York, NY: Springer; 2000. [Google Scholar]
- 26.Efron B, Tibshirani RJ. An Introduction to the Bootstrap. New York, NY: Chapman & Hall; 1993. [Google Scholar]
- 27.Studer UE, Whelan P, Wimpissinger F, et al. EORTC Genitourinary Cancer Group. Differences in time to disease progression do not predict for cancer-specific survival in patients receiving immediate or deferred androgen-deprivation therapy for prostate cancer; final results of EORTC Randomized Trial 30891 with 12 years of follow-up. Eur Urol. doi: 10.1016/j.eururo.2013.07.024. published online July 24, 2013. [DOI] [PubMed] [Google Scholar]
- 28.Medical Research Council Prostate Cancer Working Party Investigators Group. Immediate versus deferred treatment for advanced prostatic cancer: initial results of the Medical Research Council Trial. Br J Urol. 1997;79(2):235–246. doi: 10.1046/j.1464-410x.1997.d01-6840.x. [DOI] [PubMed] [Google Scholar]
- 29.Kawakami J, Cowan JE, Elkin EP, Latini DM, DuChane J, Carroll PR CaPSURE Investigators. Androgen-deprivation therapy as primary treatment for localized prostate cancer: data from Cancer of the Prostate Strategic Urologic Research Endeavor (CaPSURE) Cancer. 2006;106(8):1708–1714. doi: 10.1002/cncr.21799. [DOI] [PubMed] [Google Scholar]
- 30.Shahinian VB, Kuo YF, Freeman JL, Goodwin JS. Determinants of androgen deprivation therapy use for prostate cancer: role of the urologist. J Natl Cancer Inst. 2006;98(12):839–845. doi: 10.1093/jnci/djj230. [DOI] [PMC free article] [PubMed] [Google Scholar]
Associated Data
This section collects any data citations, data availability statements, or supplementary materials included in this article.