

Summary
RNA editing, a post-transcriptional process, allows the diversification of proteomes beyond the genomic blueprint; however it is infrequently used among animals. Recent reports suggesting increased levels of RNA editing in squids thus raise the question of their nature and effects in these organisms. We here show that RNA editing is particularly common in behaviorally sophisticated coleoid cephalopods, with tens of thousands of evolutionarily conserved sites. Editing is enriched in the nervous system affecting molecules pertinent for excitability and neuronal morphology. The genomic sequence flanking editing sites is highly conserved, suggesting that the process confers a selective advantage. Due to the large number of sites, the surrounding conservation greatly reduces the number of mutations and genomic polymorphisms in protein coding regions. This trade-off between genome evolution and transcriptome plasticity highlights the importance of RNA recoding as a strategy for diversifying proteins, particularly those associated with neural function.
Keywords: Epitranscriptome, RNA modifications, RNA editing, ADAR, Neural plasticity, Cephalopods, Genome evolution, Proteome diversity
eTOC blurb
Behaviorally complex cephalopods use extensive RNA editing to diversify their neural proteome at the cost of limiting genomic sequence flexibility and evolution.
Introduction
It is generally assumed that genetic information passes faithfully from DNA to RNA to proteins. Proteome complexity, however, depends on a diverse set of post-transcriptional processes that modify and enrich genetic information beyond the genomic blueprint. RNA editing is one such process. Adenosine deamination to inosine by the ADAR family of enzymes is the most common form of editing among animals (Bass, 2002; Nishikura, 2015). Because inosine is recognized as guanosine during translation (Basilio et al., 1962), this process has the capacity to recode codons and fine-tune protein function. However, it seldom does so. Transcriptome-wide screens have revealed that only ~3% of human messages and 1–4% of those from Drosophila harbor a recoding site (Ramaswami and Li, 2014; St Laurent et al., 2013; Xu and Zhang, 2014; Yu et al., 2016). Even more surprising is the limited extent to which this process is conserved. There are only about 25 human transcripts that contain a recoding site that is conserved across mammals (Pinto et al., 2014), and only about 65 recoding sites conserved across the Drosophila lineage (Yu et al., 2016). In C. elegans, only a few putative recoding sites have been identified, some of which were not validated (Goldstein et al., 2016; Washburn et al., 2014; Whipple et al., 2015; Zhao et al., 2015). These data support the hypothesis that recoding by RNA editing is mostly neutral or detrimental, and only rarely adaptive (Xu and Zhang, 2014).
Recently, we reported an apparent exception: squid contain an unusually high level of recoding, with the majority of mRNAs in the nervous system harboring at least one event (Alon et al., 2015). This intriguing but anecdotal result raised fundamental questions about the nature of recoding in these organisms. Does the massive RNA-level recoding translate into proteome diversification? Is it simply a neutral byproduct of a promiscuous ADAR tasked with another function, or adaptive, providing a functional advantage? Finally, is it related to behavioral sophistication?
Cephalopods are diverse, and can be divided into the behaviorally complex coleoids, consisting of squid, cuttlefish and octopus, and the more primitive nautiloids. In this report we show that in neural transcriptomes extensive A-to-I RNA editing is observed in the behaviorally complex coleoid cephalopods, but not in nautilus. The edited transcripts are translated into protein isoforms with modified functional properties. By comparing editing across coleoid taxa, we found that, unlike the case for mammals, many sites are highly conserved across the lineage, and undergo positive selection, resulting in a sizable slow-down of their genome evolution.
Results
Extensive recoding is an invention of coleoid cephalopods
To assess the level of recoding via A-to-I RNA editing in cephalopods, we analyzed matching DNA and RNA samples of individual animals from species that span the cephalopod evolutionary tree. We studied four members of the coleoid cephalopod subclass (soft bodied cephalopods): two octopuses (Octopus vulgaris and Octopus bimaculoides), a squid (Doryteuthis pealeii), and a cuttlefish (Sepia oficianalis), as well as a nautiloid (Nautilus pompilius) and a gastropod mollusk (Aplysia californica) as an evolutionary outgroup. Cephalopods emerged in the late Cambrian period, roughly at ∼530mya, and the divergence of nautiloids from coleoides is estimated to have occurred at 350–480mya (Kröger et al., 2011). The coleoides diverged to Vampyropoda (octopus lineage) and the Decabrachia (squid and cuttlefish lineage) at ~200–350mya (Albertin et al., 2015; Kröger et al., 2011). Divergence of squid from Sepiida is estimated to have occurred at 120–220mya (Checa et al., 2015). The two octopus species used in this study, Octopus vulgaris and Octopus bimaculoides, have been shown to be closely related using mitochondrial DNA, and are in some cases even indistinguishable, depending on the geographical origins of the specimens (Söller et al., 2000). The divergence time between the gastropod species Aplysia californica and cephalopods is estimated to be 520–610mya (Kröger et al., 2011). A general representation of the phylogenetic relations between the species is shown at Fig. 1a.
Figure 1. Extensive recoding is an invention of coleoid cephalopods.
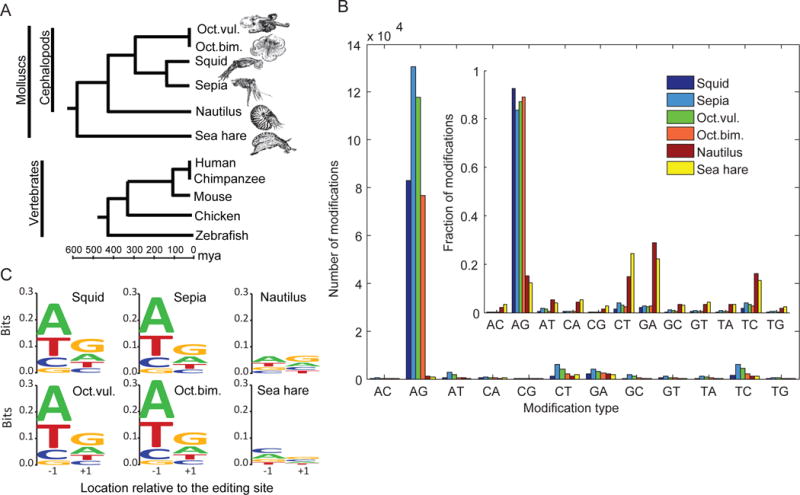
(A) The species studied span the cephalopod evolutionary tree, as well as sea hare (Aplysia californica) as an outgroup (top). For comparison, a representative tree for vertebrates is shown (bottom), constructed based on divergence times estimated in (Hedges et al., 2006).
(B) Tens-thousands of A-to-I editing sites (identified as A-to-G DNA-RNA mismatches) are detected in squid, sepia and the two octopus species (see Tables S1–S4 for more details). The noise level (estimated by the number of G-to-A mismatches) is rather low. In contrast, in nautilus and sea hare no enrichment of A-to-G mismatches is observed (inset).
(C) The nucleotides neighboring the detected editing sites, show a clear pattern consistent with known ADAR preference (Alon et al., 2015; Eggington et al., 2011; Kleinberger and Eisenberg, 2010) for the extensively recoded coleoid species – squid, sepia, and the two octopus species – but not in nautilus or sea hare. The motif is characterized by under-representation of G upstream to the editing site (relative location −1) and over-representation of G in the downstream base (The height of the entire stack of letters represents the information content in bits, the relative height of each letter represents its frequency).
A full genome sequence is not available for the cephalopod species used in this study (except for Octopus bimaculoides; see below). Thus, we used a genome-independent method (Alon et al., 2015) to detect editing sites, one that focuses specifically on the coding regions of the transcriptome. Briefly, RNA-Seq data (174–366 million reads per species; Table S1, also see (Alon et al., 2015)) was utilized to assemble a de-novo transcriptome (Grabherr et al., 2013) and the coding sequences were identified by comparison with Swiss-Prot (Bairoch et al., 2005) open reading frames (Table S2). RNA and DNA reads were then aligned to the assembled transcriptome (using Bowtie2 (Langmead and Salzberg, 2012) with local alignment configuration and default parameters). To detect editing events, we looked for systematic mismatches between RNA and DNA reads within the coding part of the transcriptome, filtering out those that stem from sequencing errors or genomic polymorphisms (see Methods for more details). The A-to-G DNA-to-RNA mismatches that are identified by this process could result from A-to-I RNA editing, while other types of mismatches provide an estimate of our false-detection rate.
For sepia, squid, and the two octopus species, most mismatches (>80%) detected by the above approach were A-to-G mismatches, and the noise level, estimated by the number of G-to-A mismatches, is rather low - 2–3% (Fig. 1B). Furthermore, the residues surrounding the detected A-to-G sites exhibit a sequence pattern consistent with the known preferences for ADARs (Eggington et al., 2011; Kleinberger and Eisenberg, 2010) (Fig. 1C). We thus attribute these mismatches to A-to-I RNA editing events, and obtain 80–130 thousand editing sites in protein-coding regions (Tables S3–S4). Remarkably, results from nautilus and aplysia are in sharp contrast. First, we found only 1150 and 933 A-to-G mismatches for these species, much less than for the octopus, squid and sepia. Moreover, there is no excess of A-to-G mismatches over other events (Fig. 1B, Tables S3–S4), and the residues surrounding the detected A-to-G sites do not exhibit any sequence preference (Fig. 1C). Thus, the A-to-G mismatches found in nautilus and aplysia are likely to be (mostly) noise, with very few, if any, editing sites. Accordingly, editing within the coding sequence of these species is orders of magnitudes lower than for the octopus, squid and sepia. These data suggest that extensive recoding through RNA editing evolved along the coleoid lineage. As all of the cephalopod groups that separate coleoids and nautiloids are now extinct (e.g. belemnites and ammonoids), it will be difficult to pinpoint a more exact time for the emergence of extensive RNA editing.
Proteomic validation of recoding sites
Sanger-sequencing validation of the sites detected by the present scheme were previously reported (Alon et al., 2015). Here, we employed mass spectrometry analysis to further test whether the multitude of novel RNA isoforms created by extensive RNA editing are translated into proteins, resulting in extensive proteome diversification by recoding. We analyzed squid giant axon and stellate ganglion samples, looking for peptides translated from RNA that include editing sites. To simplify the analysis, we considered only peptides that include a single non-synonymous (recoding) editing site, and checked whether the edited, non-edited or both versions of the peptide were observed. For squid stellate ganglion, a total of 74,146 unique peptides were detected, 4,115 of which harbor 5,617 recoding sites, and 3,204 peptides that include a single predicted site. Of these, 320 sites (10.0%) were shown to be edited (174 cases where both the pre-edited and edited versions are observed, and 146 found only in the edited version), including most of the sites predicted to be edited at high levels. Similarly, for squid giant axon 58,403 unique peptides were detected, 3,579 of which harbor 4,956 predicted recoding sites, and 2,741 peptides included a single predicted site. Of these, 283 sites (10.3%) were shown to be edited (160 cases where both pre-edited and edited versions are observed, and 123 found only in the edited version). Altogether, this experiment validated 432 protein recoding sites. The fraction of sites validated correlated very well with the editing level predicted from RNA-seq data (Fig. 2).
Figure 2. Proteomic validation of recoding by RNA editing.
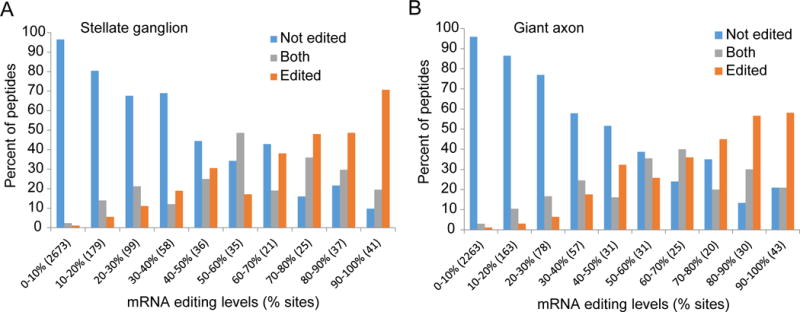
We analyzed peptides identified by mass spectrometry analysis of two squid tissues, looking for evidence of recoding. For each site covered by one or more peptides, we marked whether the edited, non-edited or both versions of the peptide are observed. The distribution is presented, binned by the predicted RNA editing level (as measured from RNA-seq data). In parentheses are the numbers of recoding sites analyzed in each editing-level bin. The proteomic recoding level follows closely the predicted RNA editing level. Altogether, this experiment validated protein recoding in 432 sites in two tissues:
(A) Squid stellate ganglion, where 320 of the 3,204 single-site peptides (10.0%) were shown to be edited.
(B) Squid giant axon (giant fiber lobe), where 283 of the 2,741 single-site peptides (10.3%) were shown to be edited.
Note that the shotgun proteomics method used here provides only partial coverage of the tryptic peptides generated by the proteolysis (Michalski et al., 2011). This is demonstrated by the fact that ~90% of the recoded amino acids are completely missing from our data, regardless of their editing state. Accordingly, lack of peptide evidence for an edited or unedited form of a given site cannot be considered as evidence for this isoform not being present. However, it is possible that some of the editing sites are not translated, or do not produce a stable protein, possibly due to deleterious effect of editing on the protein structure.
Protein recoding accounts for a sizable fraction of ADARs editing in neural tissues of Octopus bimaculoides
For most organisms, A-to-I editing is markedly depleted from the protein coding regions of the transcriptome. The question then arises whether the extensive recoding in cephalopods is accompanied by extra-ordinary editing of the non-coding transcriptome. Recently, a genome was published for Octopous bimaculoides, the first from a cephalopod (Albertin et al., 2015), allowing us to use genome-dependent methods (Picardi and Pesole, 2013; Ramaswami et al., 2012) to study the full editome, including editing in non-coding sequences, as well as a comparison with the genome-free method for the coding regions. Analyzing RNA-seq data of the same four neural tissues studied in the transcriptome-based approach resulted in 800,941 editing sites, 105,380 of them in annotated coding sequences (compared to 76,862 sites in coding sequence identified by the genome-free pipeline), 49,483 of these were also found using the transcriptome-based genome-free approach (Fig. 3A). Differences between the two methods are due to the different de-novo transcriptomes used, and the different methods employed to filter out random mismatches (see Methods). These results suggest that the genome-free method provides a reasonable coverage of the editing signal in coding sequence, and that the number of editing sites outside the coding region is likely to be an order of magnitude higher than the number within the coding sequence for the other cephalopods studied here.
Figure 3. Editing in Octopus bimaculoides.
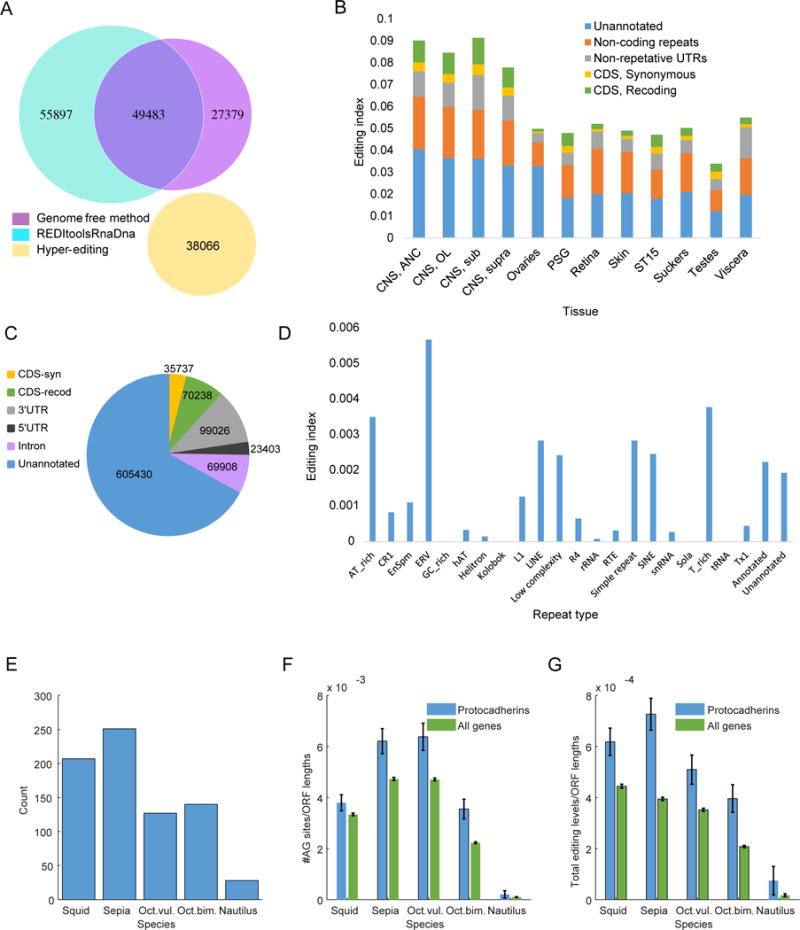
(A) A-to-I editing sites were found within coding sequences of Octopus bimaculoides using three methods: the genome-free method (alignment to de-novo transcriptome), the genome-dependent approach using REDItools (Picardi and Pesole, 2013), and identification of hyper-edited reads (Porath et al., 2014). Overall, the three methods identified 170,825 unique AG sites in Octopus bimaculoides coding sequences (38,066 hyper-editing sites do not overlap those found by the other methods). See Methods for analysis of the differences between the results of the first two methods.
(B) RNA editing levels, measured across the whole transcriptome (see Table S5) by the editing index (weighted average of editing levels over all editing sites identified in the transcriptome, see Methods). Levels vary across tissues and are highest for neural tissues (see Table S6). Unlike mammals, a sizable fraction of editing events (11–13% in neural tissues) results in recoding events. Annotation of transcripts and repeats is based on (Albertin et al., 2015). (CNS= central nervous system; ANC=Axial nerve cord; OL=Optic Lobe; Sub=Subesophageal ganglia; Supra=Supraesophageal ganglia; PSG=posterior salivary gland; ST15=stage 15 embryo)
(C) The number of editing sites in coding region is comparable to the number found in introns.
(D) Unlike the case in mammals, editing is not exceptionally enriched in specific repeat families in Octopus bimaculoides, as measured by the editing index (here defined as the editing level averaged over all, edited and unedited, adenosines in each specific repeat family). (E) Protocadherins is a gene family known to be principally expressed in the brain, important for mediating combinatorial complexity in neuronal connections and are thought to play a role in diversifying neural circuitry (Chen and Maniatis, 2013). It was impressively expanded in Octopus bimaculoides (Albertin et al., 2015). A large number of protocadherins are found in the assembled transcriptomes for the four coleoid species (127–251 open reading frames), but not in nautilus (28 open reading frames).
(F–G) Protocadherins contain significantly higher numbers of AG sites (F) and are edited at higher levels (editing level summed over all sites and normalized by ORF length), in all four coleoid species but not in nautilus (G).
Analyzing RNA from 12 different tissues, including non-neural ones, we found 903,742 editing sites in the transcriptome (Table S5), 12% of which reside in coding regions (Fig. 3B–C). In mammals, editing mostly occurs within genomic repeats (Bazak et al., 2014a; Levanon et al., 2004; Neeman et al., 2006). In primates specifically, most RNA editing sites are found in Alu repeats, whose sequence facilitates the creation of a double-stranded RNA structure that promotes ADAR binding. Similarly, editing in Octopus bimaculoides is enriched in repeats regions (303,414/903,742 sites, 34%; 159,005 of them in annotated repeats). The “editing index”, a robust measure of editing activity (Bazak et al., 2014b) defined as the editing level averaged over all adenosines (edited and unedited) weighted by expression level, is calculated to be 0.21% in octopus repeats for the panel of 12 tissues studied, which is comparable to the index observed in human Alu repeats (Bazak et al., 2014a). Unlike primates, though, there is not one specific repeat family which was found to contain the majority of sites, and SINEs are not edited more than other repeats (Fig. 3D). Therefore, as the repeat editing index in octopus is calculated over all repeats (~1.3Gbp), and editing in repeats accounts for only 21–38% of all editing events in octopus mRNAs (compared to >95% in primates), overall the number of editing events reflected in mRNA sequencing data is roughly an order of magnitude higher in Octopus bimaculoides compared to primates. Furthermore, in neural tissues ~11–13% of these events result in amino-acid modification, compared with <1% in mammals (Bazak et al., 2014a). RNA editing is known to be important in neural function (Rosenthal and Seeburg, 2012) and abnormal editing patterns or ADAR function have been shown to underlie several neural conditions (Slotkin and Nishikura, 2013). Indeed, we find that editing in non-neural tissues of Octopous bimaculoides is roughly two-fold lower, and recoding events are even more strongly suppressed (Fig. 3B). Consistently, GO analysis of edited transcripts shows enrichment of neuronal and cytoskeleton functions in all four species (Table S6).
An intriguing result from the recently reported Octopus bimaculoides genome was that the protocadherin gene family was greatly expanded (Albertin et al., 2015). In the mammalian brain these proteins are important for mediating combinatorial complexity in neuronal connections and play a role in diversifying neural circuitry (Chen and Maniatis, 2013). We found a large number of protocadherins in the assembled transcriptomes for the four coleoid species (127–251 ORFs), but not in nautilus (28 ORFs) (Fig. 3E). Interestingly, protocadherins are significantly enriched in editing sites and are edited at higher levels in all four coleoid species, but not in nautilus (Fig. 3F–G).
Signs for positive selection of recoding sites in coleoid cephalopods
Mammalian editing events in the coding region (and the editing levels) are negatively correlated with the importance of a site or gene - essential genes, and genes under strong functional constraints, tend to harbor lower numbers of editing sites and exhibit lower editing levels (Xu and Zhang, 2014). Furthermore, nonsynonymous editing sites are suppressed, compared with synonymous ones, and the fraction of editing sites that are conserved across mammals is minute. These and other observations have led to the conclusion that while a few mammalian recoding sites are clearly beneficial, overall recoding by RNA editing is nonadaptive in mammals, presumably resulting from tolerable promiscuous targeting by the ADAR enzymes (Xu and Zhang, 2014).
To conduct a comparable analysis of the recoding repertoire in cephalopods, we first identified the non-synonymous editing sites. About 65% of cephalopod edits within coding sequences are nonsynonymous, leading to 54,287–86,230 recoding sites in 6,688–8,537 ORFs (Table S7), orders of magnitude more recoding than any other species. In sharp contrast with mammals, thousands of recoding sites are shared between species (Fig. 4A–B). As expected, the fraction of conserved sites is higher for species that are evolutionary closer (Fig. 4C), but unlike the picture observed in other evolutionary lineages (Fig. 4D), editing in coding sequences is, to a large extent, conserved. Interestingly, 1146 editing sites (in 443 proteins) are conserved and shared by all four coleoid cephalopod species (Fig. 4E). A large fraction of proteins are recoded at multiple sites, and many proteins harbor multiple conserved and highly-edited (>10% in at least one species) recoding sites (Fig. 4F, Table S8). Notably, even the editing levels in the shared sites are conserved, and exhibit significant and sizable correlations between evolutionarily distant species (Fig. 4G).
Figure 4. Extensive recoding is conserved across coleoid cephalopods.
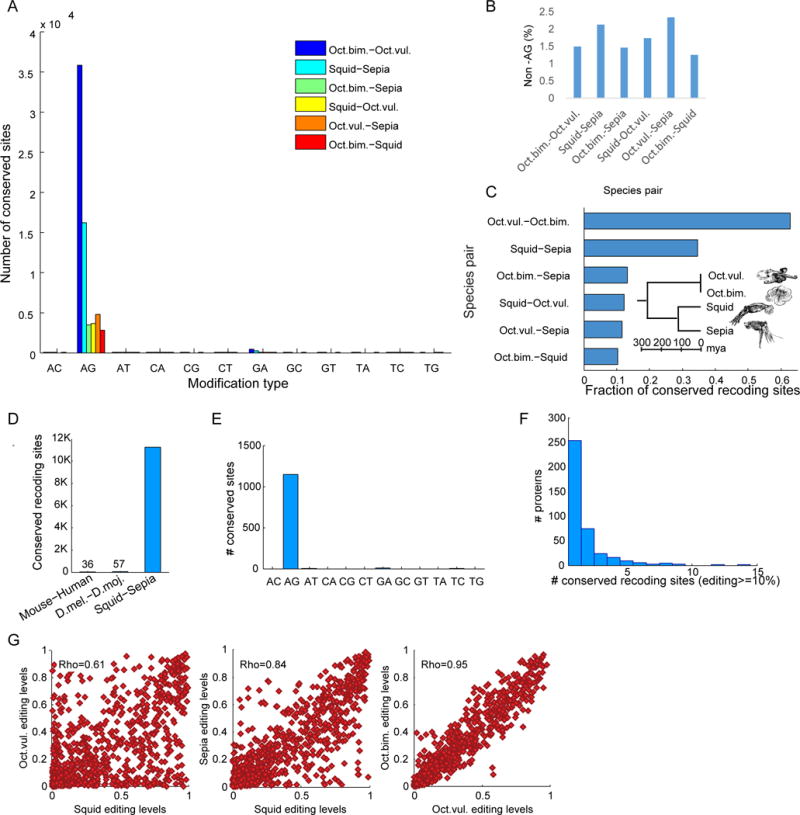
(A) Tens-thousands sites are conserved across species (see Table S7). The closer the species are evolutionarily, the higher the number of conserved sites.
(B) Virtually all (97.5–99%) mismatches conserved across species are A-to-G, resulting from A-to-I editing. Manual inspection of the few non-A-to-G mismatches appearing in multiple species suggests that they either result from systematic erroneous alignments, or they are actually editing sites that were mistakenly identified as G-to-A mismatches due to insufficient DNA coverage.
(C) The majority of editing sites is conserved between the two octopus species, and even the most distant species share a sizable fraction of their sites.
(D) In contrast, only 36 human recoding sites (1–2% of human recoding sites) are shared by mouse, and a similar number is shared between Drosophila melanogaster and D. mojavensis (Yu et al., 2016) (diverged at later times than squid-sepia).
(E) Interestingly, 1146 AG modification sites (in 443 proteins) are conserved and shared by all four coleoid cephalopod species. Of these, 887 are recoding sites and 705 are highly edited (>=10% editing) recoding sites (in 393 proteins).
(F) Some proteins include multiple highly-edited recoding sites (see Table S8). Of note are Uromodulin, α Spectrin (previously reported to harbor the highest number of recoding sites in squid (Alon et al., 2015)), and Calcium-dependent secretion activator 1 (CAPS1) with 14, 8 and 7 strong shared recoding sites, respectively. Recoding in CAPS1 was found to be conserved in vertebrate species from human to zebrafish (Li et al., 2009).
(G) Not only are the locations of editing sites conserved, but their editing levels are correlated as well. Editing levels in 887 recoding sites shared by all species are highly, positively and significantly correlated in all pairs of coleoid cephalopod species (p<1e–75 for all pairs; see Supp. Fig. 1 for three additional pairs). Correlation is higher the closer the species are to each other in evolutionary terms, with Pearson rho = 0.95 for the two octopus species.
Overall, the nonsynonymous to synonymous (N/S) ratio for cephalopod edits is 65/35=1.9, as expected under neutrality taking into account the ADAR target motif (Alon et al., 2015). However, the N/S ratios increases to much higher values as editing levels increase (Fig. 5A), signaling positive selection for the highly edited sites. Conserved sites show an even stronger pattern (Fig. 5B), where almost all highly edited, conserved, sites are nonsynonymous. Consistently, and in stark contrast with mammals, the higher the editing levels, the more sites are conserved (Fig. 5C–D). Furthermore, editing is over-represented in highly conserved regions of the transcriptome (>95% identity between species) (Fig. 5E). Taken together, these results suggest that recoding by RNA editing is commonly adaptive in coleoid cephalopods, with many thousands of recoding sites under positive selection.
Figure 5. Signs for positive selection of recoding by editing.
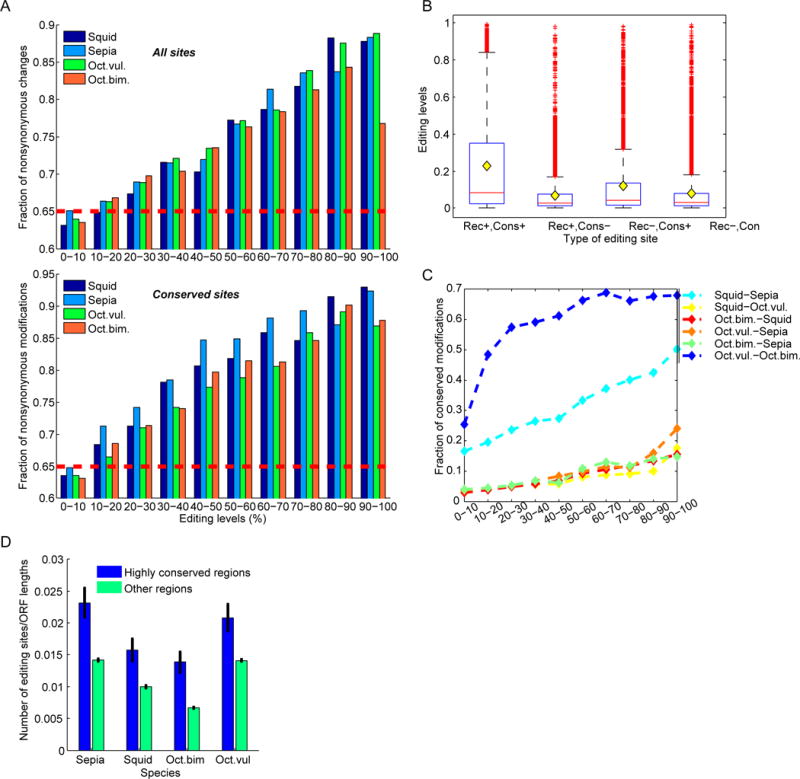
(A) The fraction of recoding sites among all editing sites in coding region increases with editing levels (top), as well as the fraction of recoding sites among all conserved sites (bottom). Red horizontal dashed line represents the recoding fraction expected assuming neutrality.
(B) Editing levels are higher in conserved recoding sites. Distributions of editing levels in four groups of putative A-to-I editing sites: recoding and conserved (Rec+, Cons+), recoding and non-conserved (Rec+, Cons−), conserved sites that cause a synonymous change (Rec−, Cons+), and non-conserved synonymous sites (Rec−, Cons−). Horizontal red lines mark the median level, and yellow diamonds mark the mean. Conservation and non-synonymity are both positively correlated with higher editing levels, as well as their interaction (ANOVA, p-value<1.0e–162). Data presented here for squid (conserved sites are conserved in sepia), but the results are similar and significant for all species.
(C) In contrast with the case in humans, highly edited sites tend to be more conserved: the fraction of conserved sites rises with the editing level for all species pairs, but more dramatically for the closely related octopuses and the sepia-squid pair.
(D) Highly conserved regions of the transcriptome are enriched in editing sites, further attesting for positive selection of RNA editing. Density of editing sites (number of AG sites normalized by length) is higher for 112 recoding regions that are highly-conserved across the four species (>95% identity; average length 1382bp), compared with all other, less conserved, regions (Wilcoxon p-value<0.001 for all species). Error bars represent the S.E.M.
Functional implications of recoding sites
We next tested whether species-specific and conserved recoding events can affect protein function. We studied sepia, squid and Octopus vulgaris Kv2 potassium channel orthologs, whose messages are abundantly edited (34–55 sites per species; five sites shared between all species; Fig. S2 and Table S9). Voltage-dependent potassium channels of the Kv2 subfamilly, also known as “delayed rectifiers”, are expressed across the metazoa. In the mammalian central nervous system, they regulate excitability, action potential duration, and repetitive firing (Murakoshi and Trimmer, 1999). As with most voltage-dependent potassium channels, they are predominantly closed at negative membrane potentials and open at positive ones. When switched between negative and positive potentials, they open or close with characteristic rates. At positive potentials, channels will also spontaneously close after opening, a process known as “inactivation”. The kinetics of these three processes play a vital role in determining how the channels regulate electrical signaling.
To measure the effects of editing on functional properties, we expressed all channels in Xenopus oocytes and studied them using the Cut-Open Oocyte Vaseline Gap Voltage Clamp technique (Taglialatela et al., 1992). The unedited versions of the channels open over a similar range of voltages, but have different opening, closing and inactivation kinetics (Fig. S3 and Fig. 6B). To examine the effects of editing, we first looked at the sepia-specific editing site I529V. Fig. 6Ai shows superimposed current traces, obtained in response to a voltage step from −80mV to +40mV, for the unedited and edited (I529V) versions of sepia Kv2. Clearly, the edited channel inactivates more quickly, at all voltages tested (Fig. 6Aii; there is also a very modest slowing of channel closure upon bring the voltage back to −80mV). Editing had no effect on voltage sensitivity and channel opening (data not shown). We next looked at a common editing site (squid I579V, Sepia I630V and Octopus I632V) and found that it predominantly affects the channels’ closing rates. Interestingly, the direction of the effect is species-dependent. First we analyzed the tail currents in the unedited squid, sepia and octopus channels by recording currents at a negative membrane voltage of −80mV following a brief activating pulse to a positive potential, (Fig. 6Bi). Each closes at distinct, species-specific, rates, with squid the fastest and octopus the slowest. However, upon introduction of the common editing event, the channels converge on a similar rate (Fig. 6Bii); in squid, editing this site slows closing, while in octopus and sepia, it speeds it. This effect on closing kinetics was consistent at all voltages tested (Fig. 6Biii–iv). Based on these data from Kv2 orthologs, and the fact that editing is exceptionally abundant in ion channels and proteins involved in synaptic vesicle release and recycling, the overall influence of RNA editing on neurophysiology is likely profound and complex.
Figure 6. Conserved and species-specific editing sites affect protein function.
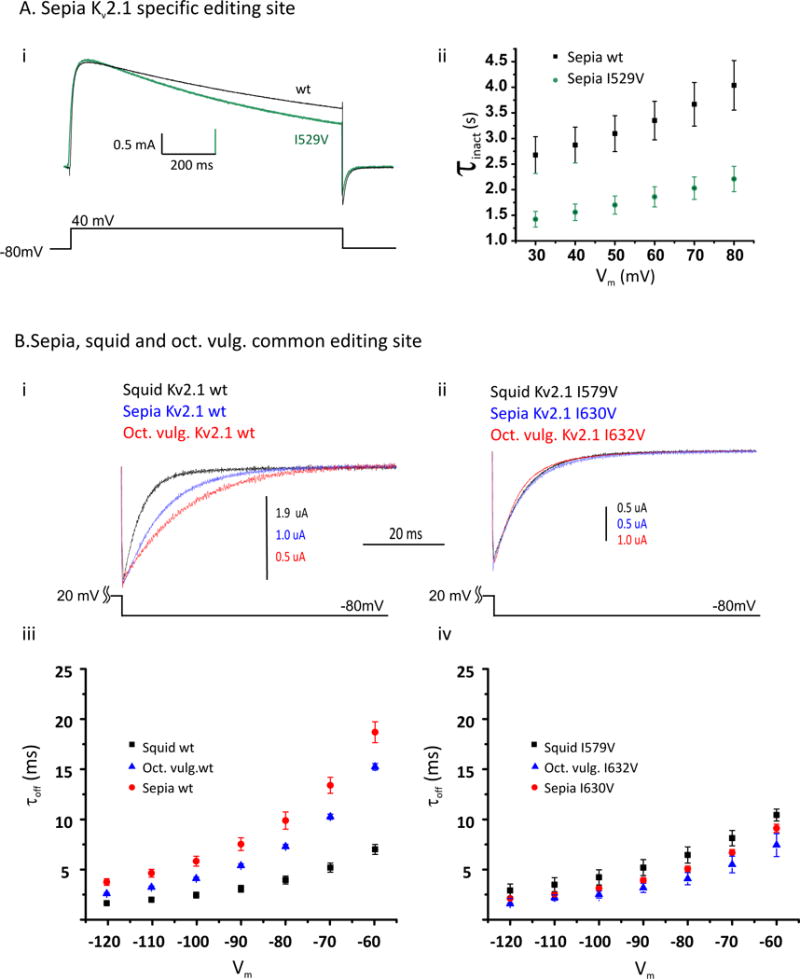
Unedited (wt) and singly-edited versions of the voltage-dependent K+ channels of the Kv2 subfamily were studied under voltage-clamp (see Table S9).
(A) (i) Current traces resulting from a voltage step from −80 mV to 40 mV for the wt Sepia Kv2.1 and the same construct containing the sepia-specific I529V edit, lying within the 4th transmembrane domain (green), showing that I529V accelerates the rate of slow inactivation. (ii) Time constants for slow inactivation determined by fitting single exponentials to traces similar to those in panel (i) at different activating voltages (Vm).
(B) (i) Tail currents measured at a voltage (Vm) of −80mV, following an activating pulse of +20 mV for 25 ms. Traces are shown for the wt Kv2.1 channels from squid, sepia and Octopus vulgaris. (ii) Tail currents for the same channels edited at the shared I-to-V site in the 6th transmembrane span, following the same voltage protocol. (iii) Time constants from single exponential fits to tail currents obtained at various negative voltages (Vm) (following an activating pulse to 20 mV for 25 ms) show that the unedited channels close at distinct rates, (iv) but the edited versions close at similar rates. N = 5 ± s.e.m. for all data plotted in this figure.
Positive selection of editing events slows down genome evolution
To edit a specific adenosine within an RNA, ADAR enzymes require surrounding dsRNA structures. These structures are often large, spanning hundreds of nucleotides (Morse et al., 2002). If editing is under positive selection, maintaining these structures would require elevated sequence conservation in the vicinity of editing sites (Herb et al., 1996; Higuchi et al., 1993). As this sequence conservation stems from constraints related to RNA structure, rather than its coding capacity, it should affect synonymous and non-synonymous changes equally. Indeed, we see a marked depletion of inter-species mutations (Figs. 7A and S4a–f) and intra-species genomic polymorphisms (Figs. 7B and S4g), synonymous and non-synonymous alike, up to ~100nt on each side of a recoding site. These regions show an elevated GC content (Figs. 7C and S4h), consistent with the requirement for the formation of stronger secondary structures.
Figure 7. RNA editing slows down cephalopod genome evolution.
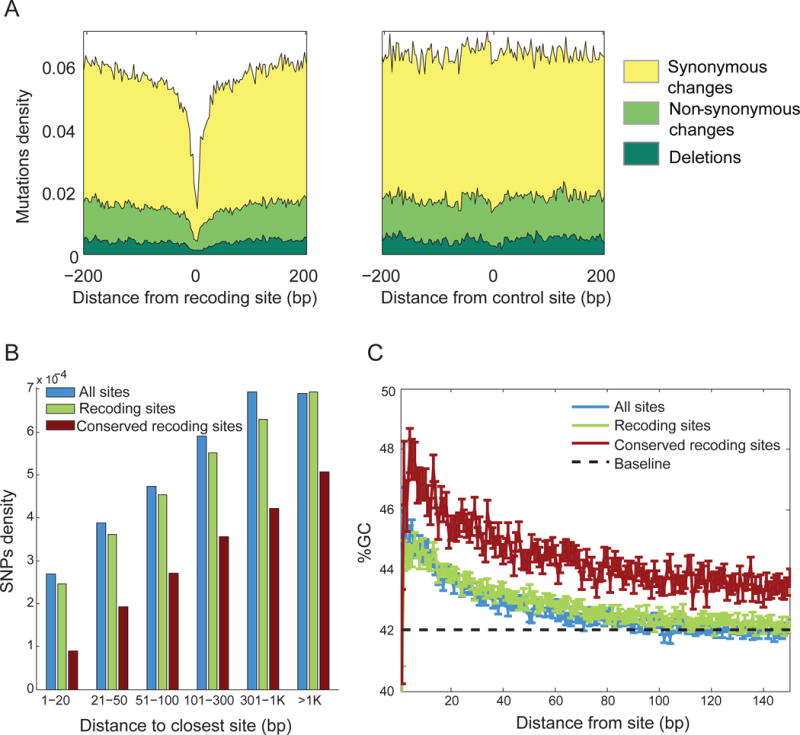
(A) Inter-species mutations are purified from genome loci surrounding conserved recoding sites (data shown for sites shared by squid and sepia). Depletion of mutations extends up to ~100bp of shared recoding sites (left). As a control, we show the mutations density (mutations/bp) around random non-edited adenosines from the same transcripts (right). Yellow – synonymous change; light green – non-synonymous; dark green – deletions.
(B) Genomic polymorphisms are depleted near editing/recoding/conserved-recoding sites in squid, attesting to reduced genome plasticity. Effect is stronger for recoding sites, and even more so for the conserved recoding sites.
(C) GC-content is elevated near editing sites in squid, allowing for more stable double-stranded RNA structures. The effect is even stronger in conserved sites. Dashed line represents the baseline GC level in the entire ORFome, and error bars represent the S.E.M. See Supp. Fig. 3 for analyses similar to those presented in panels A–C in other species.
The cumulative effect of this evolutionary constraint is considerable. Due to the large number of recoding sites and the extended range of the associated genomic rigidity, the local constraints observed in the vicinity of the recoding sites translate into a substantial global effect on genome evolution. These 200nt windows around recoding sites cover a sizable fraction of all protein coding sequences: 23–41%, depending on the coleoid species.
One may also quantify the effect of purifying selection in these regions by studying the fraction of inter-species mutations that were avoided, presumably due to maintaining the dsRNA structures required for editing. We analyzed the inter-species mutation rates (in orthologous parts of the respective transcriptomes) as a function of the distance to the closest conserved recoding site, and found again that the rates are considerably lowered in the vicinity of editing sites, compared with the baseline rate observed far from any editing site (Fig. S5A). Attributing the difference between the observed mutations rate and the baseline to effects of editing on genome evolution, and integrating this difference over the entire transcriptome, we estimate that 3–15% of all transcriptomic inter-species mutations are purified (numbers vary for the for the various species-pairs), apparently due to constraints imposed by editing. Similarly, we find that the actual number of SNPs in cephalopod coding sequences is 10–26% lower than what would be seen in the absence of SNPs suppression in the vicinity of recoding sites (Fig. S5B). Thus, the purifying selection against inter-species mutations and intra-species genomic polymorphisms residing in proximity to recoding sites results in a sizable reduction in the global number of mutations and polymorphisms in these species, revealing an unanticipated genome rigidity required to maintain the extensive transcriptome recoding.
Discussion
Seminal studies on RNA editing focused on recoding events and their functional outcomes (Burns et al., 1997; Higuchi et al., 1993). Later, with the advent of deep sequencing technologies and accompanying computational advances, transcriptome-wide screens showed that recoding is extremely rare. For example, there are millions of editing sites in the human transcriptome, but almost all of these reside in untranslated regions (Bazak et al., 2014a). This distribution implies some fundamental principles about RNA editing by ADARs. First, there is an active mechanism for excluding editing sites from coding regions; otherwise they would be far more common. Second, although there are clear exceptions for individual editing sites, the overall purpose of editing is not to recode (Liddicoat et al., 2015; Mannion et al., 2014). This point is reinforced by the fact that most mammalian recoding sites are neutral at best (Xu and Zhang, 2014). The abundant recoding in coleoids reported here runs contrary to these ideas.
We presented evidence that high-level recoding was invented by coleoids, or an extinct ancestor, after the divergence of the nautiloids. It is plausible that protein recoding may not be the primary function of editing in cephalopods. Perhaps there are other purposes for robust ADAR activity, such as its potential use in innate immunity (Liddicoat et al., 2015; Mannion et al., 2014). As with any mutation, promiscuous ”off-target” edits would sometimes be advantageous and therefore selected. However, many other organisms, such as humans, edit abundantly, producing multiple promiscuous edits. What is unique about coleoid cephalopods is that they appear not to exclude editing from protein coding regions, leading to many thousands of recoding sites being recruited and conserved across distant species. Regardless of the primary motivation for editing, this unique phenomenon clearly has an enormous effect on the proteome.
The extensive recoding activity in cephalopods might suggest that there are underlying mechanistic novelties in their editing process, compared with other organisms. For example, cephalopod ADARs may have evolved to increase their catalytic activity or decrease their specificity. Previous studies have shown that squid express a splice variant of ADAR2 with an extra dsRNA binding domain and this feature increases its affinity for dsRNA, leading to a higher activity (Palavicini et al., 2009, 2012). Although cephalopods do express ADAR1 orthologs (Albertin et al., 2015; Alon et al., 2015), no functional studies have been conducted on them, nor on any invertebrate ADAR1 for that matter. They too may possess unique activities. Finally, one might expect the introduction of thousands of editing sites to be accompanied by undesirable side effects. For example, messages which contain so many mutations might often translate into dysfunctional, or even toxic, proteins. To accommodate this burden, cephalopods may have evolved unique mechanisms for protein folding and quality control. These ideas require further study.
Recoding in coleoid cephalopods is something of an enigma. Unlike the case for mammals, inter-species conservation and the higher than expected frequencies of non-synonymous changes suggest that a sizable fraction of events were recruited during the course of cephalopod evolution. Why would the coleoids choose to alter genetic information within RNA rather than hardwire the change in DNA? There are several potential advantages to making changes within RNA. First of all, the changes are transient. Thus an organism can choose to turn them on or off, providing phenotypic flexibility, a quality that is particularly useful for environmental acclimation (Garrett and Rosenthal, 2012; Rieder et al., 2015). In addition, RNA-level changes can better augment genetic diversity. With DNA, an organism is limited to two alleles. With RNA, all messages need not be edited, and thus the pool of mRNAs can include edited or unedited versions at given sites. When a message contains more than one site, complexity can increase exponentially. Future proteomic experiments will be necessary to determine whether the combinatorial complexity is realized in neural proteins, and whether editing contributes to neuron-specific diversity, or the ability of the nervous system to respond to environmental cues. If the thousands of editing sites do indeed lead to independent functional outcomes, then the regulation of the editing process would be necessarily complex.
Among invertebrates, the nervous system of coleoids is uniquely large and complex. For example, with half a billion neurons, Octopus vulgaris has ~5 times the number of a mouse (Young, 1971). Coleoids have brain lobes dedicated to learning and memory (Hochner et al., 2003; Shomrat et al., 2008, 2015; Young, 1961), and exhibit a range of complex and plastic behaviors. Nautiloid brains are simpler, containing fewer neurons, and lack specific lobes dedicated to learning and memory (Young, 1965). The association of massive recoding with the nervous system, and the fact that it is unique to the coleoids and not observed in nautilus, hint at its relationship with the exceptional behavioral sophistication of the coleiods. This idea is reinforced by the high density of editing in transcripts that encode proteins directly involved in excitability.
What is most surprising about cephalopod recoding is its effect on genome evolution. From a mechanistic standpoint, this makes sense. In order to edit a specific adenosine, ADAR requires surrounding RNA structures. Even single nucleotide substitutions within these structures can abolish editing (Reenan, 2005; Rieder et al., 2013). If an editing site is advantageous, the structure must be preserved. Abundant editing requires abundant structures that can span a large fraction of the genomic coding sequence. Thus, while extensive recoding presents the species with a route towards proteome complexity, it comes with its own price-tag. The constraints required to preserve thousands of recoding sites reduce the accumulation of mutations at positions in the proximity of an editing site, slowing down the rate of conventional, DNA-level, evolution. The nervous system is one of the most important targets for natural selection, as subtle changes can lead to behavioral advances. For coleoid cephalopods, the need to make specific A-to-I changes within the neural transcriptome is sufficiently important to forego standard pathways of neuronal evolution.
STAR Methods
CONTACT FOR REAGENT AND RESOURCE SHARING
Further information and requests for resources and reagents should be directed to and will be fulfilled by the Lead Contact, Joshua Rosenthal (jrosenthal@mbl.edu), Eugene Bell Center, Marine Biological Laboratory, Woods Hole, MA 02543 USA.
EXPERIMENTAL MODEL AND SUBJECT DETAILS
An adult male Octopus vulgaris was captured in October of 2014 at the mouth of the Laguna de Condado, San Juan, Puerto Rico. An adult male Sepia officinalis was provided by Dr. Roger Hanlon from the Marine Biological Laboratory in Woods Hole. This individual was raised in the Marine Biological Laboratory’s Marine Resource Center from a fertilized egg that was collected in the English Channel off of Christchurch, Dorset England in 2014. The Stellate ganglia (SG), the optic lobe (OL) and a portion of the sperm sack were manually dissected from these specimens. One sample of Nautilus pompilius originating from the Philippines was obtained from “SeaDwelling Creatures” in Los Angeles. The optic lobe and the supraesophogeal ganglia were manually dissected from the sample. All samples destined for RNA extraction were immersed in chilled, filtered seawater and immediately preserved in RNA later. The samples intended for DNA extraction were flash frozen in liquid nitrogen. All samples were then stored at −80C°. RNA from all tissues was extracted with the RNAqueous kit (Life Technologies, Carlsbad, CA), and genomic DNA was extracted from the sperm sack using Genomic Tip Columns (Qiagen, Venlo, Limburg, The Netherlands).
We added previously described RNA and DNA sequencing data from the squid species Doryteuthis pealeii (Alon et al., 2015) (PRJNA255916), as well as published data from another Octopus species, Octopus bimaculoides (PRJNA270931, PRJNA285380), whose genome was recently sequenced (Albertin et al., 2015). We also added available RNA and DNA samples from the mollusk Aplysia californica, as an evolutionary outgroup (PRJNA13635, PRJNA77701).
METHOD DETAILS
Library preparation and sequencing
The genomic DNA sequencing library for Octopus vulgaris, sepia and nautilus were prepared using the TruSeq DNA Sample Prep kit, as described by the manufacturer (Illumina, San Diego, CA), and sequenced using three lanes of the Illumina HiSeq 2000 instrument. The RNA-Seq libraries for all the samples were prepared using the TruSeq Stranded mRNA Sample Prep Kit, as described by the manufacturer (Illumina), and were sequenced using one lane for each sample of Illumina HiSeq 2000 instrument.
Ilumina sequencing was utilized to generate paired-end, 151 nt reads, using RNA from OL and SG tissues for Octopus vulgaris and sepia, and OL and subesophageal ganglia for nautilus. For DNA sequencing, 101 nt reads were produced. The number of reads generated for each tissue is presented in Table S1.
Editing site validation
Validation of editing sites predicted by our bioinformatics pipeline was previously performed and reported (Alon et al., 2015). In brief, direct Sanger sequencing confirmed editing at 40/40 A-to-G squid recoding sites, and deep-sequencing validated 120/143 A-to-G recoding sites but none of the 12 non A-to-G sites tested. In this work we take validation a step further and examine editing at the protein level.
In gel proteolysis and mass spectrometry analysis
We applied proteomic mass spectroscopy (MS) analysis to examine the extent to which these RNA modifications are translated into the proteome. Squid giant axon and stellate ganglion samples were separated by a SDS-PAGE and the gel was stained with Coomassie Blue and sliced to 5 slices. The slices were processed for tryptic digestion by first reducing the disulfides with 3 mM DTT in 100 mM ammonium bicarbonate for 20 min at 60°C. Next, the sulfhydryl were carboxymethylated with 10 mM iodoacetamide in 100 mM ammonium bicarbonate in the dark for 30 min at room temperature. The proteins were in-gel digested with modified trypsin (Promega) in 10% acetonitrile and 10 mM ammonium bicarbonate at a 1:10 enzyme-to-substrate ratio overnight at 37°C. Additional trypsinization was done for 4 hours.
The resulting tryptic peptides were desalted on C18, Stage-Tip (Ishihama et al., 2006) and resolved by reverse-phase chromatography on 0.075 × 200-mm fused silica capillaries (J&W) packed with reversed phase Reprosil-C18-Aqua (Dr. Maisch GmbH, Ammerbuch-Entringen, Germany) as in (Ishihama et al., 2002). The peptides were eluted with linear 105 minutes gradient of 5% to 28% acetonitrile with 0.1% formic acid in water, followed by 15 minutes gradient from 28% to 90% acetonitrile and 15 minutes at 90% acetonitrile at flow rates of 0.15 μl/minutes. MS was performed by a Q-Exactive-Plus mass spectrometer (Thermo Fisher Scientific) in a positive ion mode using repetitively full MS scan followed by Higher-energy Collision Dissociation (HCD) of the 10 most dominant ions, selected from the first MS scan. A dynamic exclusion list was enabled with an exclusion duration of 20s.
The MS data was analyzed using Proteome Discoverer 1.4 software with the Sequest (Thermo Fisher Scientific) algorithm against the specific databases, combining all 5 fractions of each sample in one search. Minimal peptide length was set to six amino acids and a maximum of two miscleavages was allowed. Mass tolerance of 15 ppm for the precursor masses and for the fragment ions. Peptide- and protein-level false discovery rates (FDRs) were filtered to 1% using the target-decoy strategy. Semi quantitation was done by calculating the peak area of each peptide based its extracted ion currents (XICs), and the area of the protein is the average of the three most intense peptides from each protein.
Expression and recording of cephalopod Kv2 channels in Xenopus oocytes
Full-length Octopus vulgaris, Sepia and Squid Kv2.1 constructs, to be expressed in Xenopus oocytes, were based on the unedited amino acid sequences deduced from the transcriptome assemblies. The sequence for the two Octopus species are almost identical (Supp. Table 4), so we studied only one of them. Codon optimized versions for Xenopus laevis were synthesized using gene blocks and cloned into the Xenopus expression vector pGEMHE (Liman et al., 1992) using a Gibson Assembly. Single RNA editing sites were added to these clones by standard oligonucleotide-based site-directed mutagenesis using the Quickchange Lightening Site-Directed Mutagenesis Kit (Agilent Technologies). Capped, polyA-tailed cRNA from each clone was transcribed using the T7 mMessage mMachine Kit (Thermo Fisher) and injected into stage V and V1 Xenopus oocytes at approximately 750 pg/oocyte. Currents were recorded 2–3 days after injections using the Cut-Open Oocyte Vaseline Gap technique (Lockery and Goodman, 1998), using a relatively slow sampling rate. The external solution contained: 20mM K-Glutamate, 100mM N-Methyl-D-Glucamine-Glutamate, 2.5mM MgCl2, 2.5mM CaCl2, 10mM HEPES, pH=7.4. Oocytes were permeabilized using 0.3% Saponin in the internal solution. Voltage was controlled using a CA-1B High Performance Oocyte Clamp (Dagan Corporation). Analog currents were digitized at 100 kHz, and voltage commands were made, using an SBC6711 A/D D/A board (Innovative Integration, Simi Valley CA). Signals were filtered at 5 kHz. To avoid series resistance errors, only traces exhibiting less than 10 mA current were used for analysis. Data collection and clamp command was made using GPATCH M software, kindly provided by Dr. F Bezanilla (University of Chicago). Leak currents were subtracted using a linear P/4 procedure. Data were analyzed using the ANALYSIS software, also provided by Dr. F. Bezanilla. Deactivation kinetics were measured42 by fitting a single exponential of the form γ = Ae−τ/⊤ + B to the traces where A= current amplitude, τ = the time constant, T = time, and B =a constant baseline. Inactivation kinetics were measured42 by fitting a single exponential of the form γ = Ae−τ/⊤ to the traces where A= current amplitude, τ = the time constant, and T = time. Relative conductance was measured using peak amplitude of tail currents. N = 6 for all data points ± SEM.
QUANTIFICATION AND STATISTICAL ANALYSIS
Transcriptome assembly
The species studied, with the exception of Octopus bimaculoides, do not have a reference genome. We therefore utilized the RNA-Seq data to assemble a transcriptome using the Trinity de novo assembly package, Version: Trinity-r2012-10-05 (Grabherr et al., 2013). We found that Trinity does not perform well for reads longer than 100bp, and therefore all reads were trimmed (symmetrically, on both sides) to this length prior to assembly. For consistency, we assembled the transcriptome for Octopus bimaculoides in the same manner, using data from the four neural tissues out of the 12 tissues available: optic lobe (OL), supraesophogeal ganglia (supra), subesophogeal ganglia (sub), and the axial nerve cord (ANC). For each gene, we kept only the longest isoform for downstream analysis. The assembly statistics are summarized in Table S2.
Detection of editing sites
In order to detect editing sites, using the matched RNA and genomic DNA samples, we employed a method similar to that described in (Alon et al., 2015). Briefly, RNA and DNA reads were separately aligned against the assembled transcriptome using Bowtie2 with local alignment configuration and default parameters (Langmead and Salzberg, 2012). Reads that were not uniquely aligned were discarded. We identified potential open reading frames (ORFs) in the assemblies by locating components that were found to be significantly similar (Blastx E-value<1e–6) to the Swiss-Prot proteins dataset (Bairoch et al., 2005). Each ORF was extended until either a stop codon or the end of the Trinity component was met. Table S2 summarizes the properties of the ORFs found for each species. To detect editing events, we applied a binomial test to locate significant modifications between RNA reads and the Swiss-Prot ORFs and distinguish them from sequencing errors or SNPs. For more detailed description of the editing detection method, see (Alon et al., 2015). Two important modifications were introduced here with respect to the scheme presented in (Alon et al., 2015): (1) we discarded all mismatches that occur up to 6bp from alignments’ ends (2) we discarded all reads that contained more than one mismatch type (e.g. A-to-G mismatch and A-to-C mismatch is the same read), or more than two mismatches (of any type) altogether, as these are suspected to be misaligned. The number of reads discarded ranges between 0.6 and 1.7 million, for the species studied. Of these, 200–800 thousand reads might have exhibited two editing events. Unlike (Alon et al., 2015), we did not distinguish between “weak” and “strong” sites. Rather, the genomic strand was determined by the DNA reads (and in the absence of DNA coverage, by the majority of RNA reads). In case of conflicting DNA reads, sites were discarded.
Editing in Octopus bimaculoides
Our genome-free detection scheme is limited by the quality of the assembled de-novo transcriptome, and the focus on coding sequences only. The recent sequencing of Octopus bimaculoides genome (Albertin et al., 2015) enabled us to compare our genome-free scheme to a genome-based one, obtain an independent assessment of the true extent of editing in coding sequences, and estimate the full picture of the octopus editome outside of coding sequences.
The REDITools package (V−1.0.3) (Picardi and Pesole, 2013) was used to locate RNA-DNA differences in the octopus genome, using RNA-seq data from the same four neural tissues that were used in the genome-free scheme. Editing sites annotation was based on the transcriptome provided in (Albertin et al., 2015), which differed from the one we used in the genome-free method.
We found 800941 AG sites, 105380 of them in annotated coding sequences (compared to 76862 sites in coding sequence identified by our transcriptome-based pipeline), 49483 of these sites were also found using our pipeline (see Table S5). Therefore, we see that our pipeline provides a reasonable coverage of the editing signal in coding sequence, and that the number of editing sites outside the coding region is likely to be an order of magnitude higher than the number within the coding sequence for the other cephalopods studied here. The differences between the two methods stem from the different de-novo transcriptome used, and the different parameters used to assess the mismatches observed (REDItools uses cutoffs on the number of reads, while the genome-free approach applied a binomial analysis). Using BLAST to compare the two transcriptomes, we find that ~90% of Octopus bimaculoides transcripts detected in our pipeline are covered by the transcriptome described in (Albertin et al., 2015), but only ~68% of the latter transcripts are covered by our detected ORFs, which explains the majority of the sites missed by our pipeline. Of the ~56K sites found by REDItools but not by the genome-free method, 35911 (64%) are located within transcripts missing from our de-novo transcriptome and the rest are seen by the genome-free method but fail to achieve statistical significance (e.g. cases where coverage is very high, and only a few G’s are observed). Out of the ~27K sites found using the genome-free method but not by REDItools, about 14k (52%) were missed due to too strict parameters employed by REDItools, and ~13K sites (48%) reside in sequences that do not exist in the transcriptome assembled in (Albertin et al., 2015).
In order to profile the editome in all available tissues, we re-did the analysis using all available RNA data from 12 tissues available: axial nerve cord (ANC), optic lobe (OL), subesophageal brain (Sub), supraesophageal brain (Supra), Ovaries, posterior salivary gland (PSG), retina, skin, stage 15 embryo (ST15), suckers, testes and viscera (heart, kidney and hepatopancreas), leading to a total of 903,742 sites.
As editing is so abundant in these organisms, it is expected that many sites will reside in reads that are extensively edited, to the point they are not aligned to the reference genome/transcriptome by the standard alignment tools. Thus, we also applied the method suggested in (Porath et al., 2014) to identify hyper-edited reads, leading to 38066 additional sites in coding regions, not found by the other methods (Fig. 3A).
The editing index was used to compare editing activity across different tissues (Fig. 3B). It is defined as the number of ‘G’s in RNA-reads nucleotides that were aligned to the predicted editing sites, divided by the total number of read-nucleotides that align to these positions (‘A’s and ‘G’s). In order to compare editing between different repeats, we used the repeats editing index, calculated in the same way over all genomic adenosines within repeats (number of A-to-G mismatches in RNA-reads nucleotides that were found in repeats, divided by the total number of read-nucleotides that align to genomic adenosines in repeats). The higher the index, the more editing occurs in the specific repeat family element (Fig. 3D).
Functional analysis of edited ORFs
To test for functional enrichment, we ranked the genes by cumulative editing levels (editing levels summed over all sites within the gene, normalized by ORF length), and used the online tool GOrilla (Eden et al., 2009). As a control, the genes were also ranked by expression levels measured by FPKM and analyzed in the same manner (Supp. Table 6).
Finding orthologous editing sites
We used OrthoMCL (Li et al., 2003) to identify orthologous pairs of ORFs, using only best-two-way hits. This covered 77% of the transcriptomes. Then, for each editing location in the query species of each pair, we screened for the best possible aligned region in the ortholog using BLAST alignment scores, and found the matching nucleotide and amino acid. A conserved editing site is a case where the same mismatch occurs at the exact orthologous nucleotide, leading to the same amino acid substitution.
Identifying SNPs
In order to minimize false positives, we took a conservative approach, and called a genomic location a SNP if the DNA reads aligned to this location show exactly two types of nucleotides, with at least five reads supporting each type, and each of the types being supported by 30–70% of the reads. Obviously, this scheme is not meant to exhaust the list of SNPs in these species, which is anyway impossible using a single animal per species, but suffices to estimate the relative depletion of SNPs around recoding sites.
DATA AND SOFTWARE AVAILABILITY
The data used in the study are publicly available at the Sequence Read Archive (SRA), accessions PRJNA300723. The mass spectrometry proteomics data have been deposited to the ProteomeXchange Consortium via the PRIDE (Vizcaino et al., 2016) partner repository with the dataset identifier PXD005827.The de-novo constructed transcriptomes used for the analysis are available at http://www.tau.ac.il/~elieis/squid.
Supplementary Material
Editing levels in 887 recoding sites shared by all species are highly, positively and significantly correlated in all pairs of coleoid cephalopod species (p<1.0e–75 for all pairs). Correlation is higher the closer the species are to each other in evolutionary terms, with Pearson rho = 0.95 for the two octopus species.
Table S4. Editing sites detected (genome-free method, all species), related to Figure 1.
Orthologous cephalopod Kv2.1 channel sequences are abundantly edited. Editing sites predicted by our analysis are indicated by small boxes around specific amino acids. Conserved transmembrane spans S1–S6 are enclosed in large boxes. The unique editing site for Sepia in S4 (I529V) and the common editing site in S6 (Squid I579V, Sepia I630V and Octopus vulgaris I632V) were those studied using electrophysiology in Figure 6 of the main test. The alignment was generated using Vector NTI software.
(A) Examples of current traces recorded on fast (top) and slow (bottom) time-bases following activating pulses to +60 mV from a holding potential of −80 mV. These traces illustrate the variable activation and inactivation rates of the genomically encoded channels.
(B) The channels’ voltage sensitivities are similar. Relative conductance was measured from normalized tail-current amplitudes following 150 ms activating pulses to various activation voltages (Vm).
(C) Inactivation time constants (τ) taken from single exponential fits to current traces measured during a 1-second activation step of Vm (similar to the traces presented in panel A).
(D) The half-times for 150 ms activating pulses were measured from traces similar to those presented in panel A. They measure the time it takes for the currents to reach one half of their maximum values following an activating voltage step. N=6 ± S.E.M. for all graphs.
(A–F) Species-to-species mutations are suppressed within ~100bp of a recoding site shared by the two species (left panels). No effect is seen when taking random non-edited sites from conserved regions within the same transcripts (right panels) (A) Oct.bim.-Oct.vul. (B) Oct.bim.-Sepia (C) Oct.bim.-Squid (D) Sepia-Oct.vul. (E) Squid-Oct.vul. (F) Squid-Sepia. (yellow – synonymous change, light green – non-synonymous; dark green – deletions; Mutations density is the number of mutations found at a given distance from an editing site divided by the number of such sites, i.e. mutations per base-pair)
(G) Intra-species genomic polymorphisms are suppressed in genomic loci surrounding editing sites. Genomic polymorphisms are depleted near editing/recoding/conserved-recoding sites, attesting for a decrease in genome plasticity. Effect is stronger for recoding sites, and even more so for the conserved recoding sites.
(H) Higher GC content in the vicinity of editing sites. GC content is elevated near editing sites. This effect persists up to ~100bp, and is therefore unlikely to be explained by the local ADAR preferences. Rather, it may facilitate formation of stronger and more stable double-stranded RNA structures required for ADAR binding and editing. Blue: all editing sites; green: all recoding sites; red: conserved recoding sites; dashed black line: GC content averaged over all ORFs. Error bars represent the S.E.M. The effect is not seen in for AG mismatches found in nautilus, expected to be mostly false-positives.
(A) Mutation rates (averaged over all orthologous parts of the transcriptome) are presented as a function of the distance of the genomic base to the closest conserved recoding site. The baseline mutation rate (red) represents the rate measured for all sites at distances >1000bp from a recoding site (including mutations in ORFs harboring no editing site). Integrating the difference between the baseline and the observed rate for genomic location at a distance shorter than 1000bp provides an estimate of the number of avoided mutations, apparently due to the constraints imposed by editing. We estimate the fraction of avoided mutations as the number of avoided mutations divided by (#avoided+#observed), and find this fraction (marked as A in the different panels) to be 3–15%. This is an underestimation, as sites not conserved between the two species, or sites in transcriptome regions not conserved between the two species, are not taken into account.
(B) Similar to the analysis presented in (A), we looked at the SNPs density (number of SNPs per bp) as a function of the distance of the genomic base to the closest recoding site. The baseline SNPs density (red) is the density observed at distances of >500bp from a recoding site (including SNPs in ORFs harboring no editing site). Integrating the difference between the baseline and the observed rate for genomic location at a distance shorter than 500bp provides an estimate of the number of avoided SNPs, apparently due to the constraints imposed by editing. Here too, we estimate the fraction of avoided SNPs as the number of avoided SNPs divided by (#avoided+#observed), and find this fraction (marked as A in the different panels) to be 10–26%. This is an underestimation, as the contributions of sites in non-conserved transcriptome regions, are not taken into account.
Table S5. Editing sites detected (genome alignment, Oct. Bim.), related to Figure 3.
Table S6. GO enrichment data (Oct. Bim.), related to Figure 3.
Table S7. Editing sites conserved across species, related to Figure 4.
Highlights.
Unlike other taxa, cephalopods diversify their proteomes extensively by RNA editing.
Extensive recoding is specific to the behaviorally complex coleiods.
Unlike mammals, cephalopod recoding is evolutionarily conserved, and often adaptive.
Transcriptome diversification comes at the expense of slowed-down genome evolution.
Acknowledgments
The authors thank Dr. Michal Barak for assisting the analyses, Tamar A. Carmeli for the artwork in Fig. 1a, the Smoler Proteomics Center at the Technion for using its facilities, Dr. Roger Hanlon for providing specimens of Sepia oficianalis, and Dr. Robyn Crook for help in obtaining a sample of Nautilus pompilius. NLB was supported by a post-doctoral scholarship from the Center for Nanoscience and Nanotechnology, Tel-Aviv University. The research of RU is supported by the Israel Science Foundation (772/13). The research of EYL was supported by the European Research Council (311257) and the Israel Science Foundation (1380/14). The research of JJCR was supported by the National Institutes of Health [1R0111223855, 1R01NS64259], the National Science Foundation (HRD-1137725), and the Frank R. Lillie and Laura and Arthur Colwin Research Fellowships from the Marine Biological Laboratory in Woods Hole. The work of JJCR and EE was supported by grant No 094/2013 from the United States-Israel Binational Science Foundation (BSF).
Footnotes
Publisher's Disclaimer: This is a PDF file of an unedited manuscript that has been accepted for publication. As a service to our customers we are providing this early version of the manuscript. The manuscript will undergo copyediting, typesetting, and review of the resulting proof before it is published in its final citable form. Please note that during the production process errors may be discovered which could affect the content, and all legal disclaimers that apply to the journal pertain.
Author contributions:
JJCR and EE conceived the study and designed the experiments, with the help of EYL and NLB. NLB analyzed the data. SA developed some of the scripts used for analysis. HTP did the hyper-editing analysis. JJCR performed all experiments, except for the MS, done by TZ and AA. BE and RU analyzed the MS data. EE supervised the bioinformatics work, with input from EYL and JJCR. NLB, JJCR and EE wrote the paper.
The authors declare no conflict of interest.
References
- Albertin CB, Simakov O, Mitros T, Wang ZY, Pungor JR, Edsinger-Gonzales E, Brenner S, Ragsdale CW, Rokhsar DS. The octopus genome and the evolution of cephalopod neural and morphological novelties. Nature. 2015;524:220–224. doi: 10.1038/nature14668. [DOI] [PMC free article] [PubMed] [Google Scholar]
- Alon S, Garrett SC, Levanon EY, Olson S, Graveley BR, Rosenthal JJC, Eisenberg E. The majority of transcripts in the squid nervous system are extensively recoded by A-to-I RNA editing. Elife. 2015;2015 doi: 10.7554/eLife.05198. [DOI] [PMC free article] [PubMed] [Google Scholar]
- Bairoch A, Apweiler R, Wu CH, Barker WC, Boeckmann B, Ferro S, Gasteiger E, Huang H, Lopez R, Magrane M, et al. The Universal Protein Resource (UniProt) Nucleic Acids Res. 2005;33 doi: 10.1093/nar/gki070. [DOI] [PMC free article] [PubMed] [Google Scholar]
- Basilio C, Wahba AJ, Lengyel P, Speyer JF, Ochoa S. Synthetic polynucleotides and the amino acid code, V. Proc Natl Acad Sci USA. 1962:613–616. doi: 10.1073/pnas.48.4.613. [DOI] [PMC free article] [PubMed] [Google Scholar]
- Bass BL. RNA editing by adenosine deaminases that act on RNA. Annu Rev Biochem. 2002;71:817–846. doi: 10.1146/annurev.biochem.71.110601.135501. [DOI] [PMC free article] [PubMed] [Google Scholar]
- Bazak L, Haviv A, Barak M, Jacob-Hirsch J, Deng P, Zhang R, Isaacs FJ, Rechavi G, Li JB, Eisenberg E, et al. A-to-I RNA editing occurs at over a hundred million genomic sites, located in a majority of human genes. Genome Res. 2014a;24:365–376. doi: 10.1101/gr.164749.113. [DOI] [PMC free article] [PubMed] [Google Scholar]
- Bazak L, Levanon EY, Eisenberg E. Genome-wide analysis of Alu editability. Nucleic Acids Res. 2014b;42:6876–6884. doi: 10.1093/nar/gku414. [DOI] [PMC free article] [PubMed] [Google Scholar]
- Burns CM, Chu H, Rueter SM, Hutchinson LK, Canton H, Sanders-Bush E, Emeson RB. Regulation of serotonin-2C receptor G-protein coupling by RNA editing. Nature. 1997;387:303–308. doi: 10.1038/387303a0. [DOI] [PubMed] [Google Scholar]
- Checa AG, Cartwright JHE, Sánchez-Almazo I, Andrade JP, Ruiz-Raya F. The cuttlefish Sepia officinalis (Sepiidae, Cephalopoda) constructs cuttlebone from a liquid-crystal precursor. Sci Rep. 2015;5:1–13. doi: 10.1038/srep11513. [DOI] [PMC free article] [PubMed] [Google Scholar]
- Chen WV, Maniatis T. Clustered protocadherins. Development. 2013;140:3297–3302. doi: 10.1242/dev.090621. [DOI] [PMC free article] [PubMed] [Google Scholar]
- Eden E, Navon R, Steinfeld I, Lipson D, Yakhini Z. GOrilla: a tool for discovery and visualization of enriched GO terms in ranked gene lists. BMC Bioinformatics. 2009;10:48. doi: 10.1186/1471-2105-10-48. [DOI] [PMC free article] [PubMed] [Google Scholar]
- Eggington JM, Greene T, Bass BL. Predicting sites of ADAR editing in double-stranded RNA. Nat Commun. 2011;2:319. doi: 10.1038/ncomms1324. [DOI] [PMC free article] [PubMed] [Google Scholar]
- Garrett S, Rosenthal JJC. RNA Editing Underlies Temperature Adaptation in K+ Channels from Polar Octopuses. Science (80−) 2012;335:848–851. doi: 10.1126/science.1212795. [DOI] [PMC free article] [PubMed] [Google Scholar]
- Goldstein B, Agranat-Tamir L, Light D, Ben-Naim Zgayer O, Fishman A, Lamm AT. A-to-I RNA editing promotes developmental-stage-specific gene and lncRNA expression. Genome Res gr. 2016;211169:116. doi: 10.1101/gr.211169.116. [DOI] [PMC free article] [PubMed] [Google Scholar]
- Grabherr MG, Haas BJ, Yassour M, Levin JZ, Thompson DA, Amit I, Adiconis X, Fan L, Raychowdhury R, Zeng Q, et al. Trinity: reconstructing a full-length transcriptome without a genome from RNA-Seq data. Nat Biotechnol. 2013;29:644–652. doi: 10.1038/nbt.1883. [DOI] [PMC free article] [PubMed] [Google Scholar]
- Hedges SB, Dudley J, Kumar S. TimeTree: A public knowledge-base of divergence times among organisms. Bioinformatics. 2006;22:2971–2972. doi: 10.1093/bioinformatics/btl505. [DOI] [PubMed] [Google Scholar]
- Herb A, Higuchi M, Sprengel R, Seeburg PH. Q/R site editing in kainate receptor GluR5 and GluR6 pre-mRNAs requires distant intronic sequences. Proc Natl Acad Sci U S A. 1996;93:1875–1880. doi: 10.1073/pnas.93.5.1875. [DOI] [PMC free article] [PubMed] [Google Scholar]
- Higuchi M, Single FN, Köhler M, Sommer B, Sprengel R, Seeburg PH. RNA editing of AMPA receptor subunit GluR-B: A base-paired intron-exon structure determines position and efficiency. Cell. 1993;75:1361–1370. doi: 10.1016/0092-8674(93)90622-w. [DOI] [PubMed] [Google Scholar]
- Hochner B, Brown ER, Langella M, Shomrat T, Fiorito G. A learning and memory area in the octopus brain manifests a vertebrate-like long-term potentiation. J Neurophysiol. 2003;90:3547–3554. doi: 10.1152/jn.00645.2003. [DOI] [PubMed] [Google Scholar]
- Ishihama Y, Rappsilber J, Andersen JS, Mann M. Microcolumns with self-assembled particle frits for proteomics. In Journal of Chromatography A. 2002:233–239. doi: 10.1016/s0021-9673(02)01402-4. [DOI] [PubMed] [Google Scholar]
- Ishihama Y, Rappsilber J, Mann M. Modular stop and go extraction tips with stacked disks for parallel and multidimensional peptide fractionation in proteomics. J Proteome Res. 2006;5:988–994. doi: 10.1021/pr050385q. [DOI] [PubMed] [Google Scholar]
- Kleinberger Y, Eisenberg E. Large-scale analysis of structural, sequence and thermodynamic characteristics of A-to-I RNA editing sites in human Alu repeats. BMC Genomics. 2010;11:453. doi: 10.1186/1471-2164-11-453. [DOI] [PMC free article] [PubMed] [Google Scholar]
- Kröger B, Vinther J, Fuchs D. Cephalopod origin and evolution: A congruent picture emerging from fossils, development and molecules. BioEssays. 2011;33:602–613. doi: 10.1002/bies.201100001. [DOI] [PubMed] [Google Scholar]
- Langmead B, Salzberg SL. Fast gapped-read alignment with Bowtie 2. Nat Methods. 2012;9:357–359. doi: 10.1038/nmeth.1923. [DOI] [PMC free article] [PubMed] [Google Scholar]
- Levanon EY, Eisenberg E, Yelin R, Nemzer S, Hallegger M, Shemesh R, Fligelman ZY, Shoshan A, Pollock SR, Sztybel D, et al. Systematic identification of abundant A-to-I editing sites in the human transcriptome. Nat Biotechnol. 2004;22:1001–1005. doi: 10.1038/nbt996. [DOI] [PubMed] [Google Scholar]
- Li JB, Levanon EY, Yoon JK, Aach J, Xie B, Leproust E, Zhang K, Gao Y, Church GM. Genome-wide identification of human RNA editing sites by parallel DNA capturing and sequencing. Science (80−) 2009;324:1210–1213. doi: 10.1126/science.1170995. [DOI] [PubMed] [Google Scholar]
- Li L, Stoeckert CJ, Roos DS. OrthoMCL: Identification of ortholog groups for eukaryotic genomes. Genome Res. 2003;13:2178–2189. doi: 10.1101/gr.1224503. [DOI] [PMC free article] [PubMed] [Google Scholar]
- Liddicoat BJ, Piskol R, Chalk AM, Ramaswami G, Higuchi M, Hartner JC, Li JB, Seeburg PH, Walkley CR, Danecek P, et al. RNA editing by ADAR1 prevents MDA5 sensing of endogenous dsRNA as nonself. Science. 2015;349:1115–1120. doi: 10.1126/science.aac7049. [DOI] [PMC free article] [PubMed] [Google Scholar]
- Liman ER, Tytgat J, Hess P. Subunit stoichiometry of a mammalian K+ channel determined by construction of multimeric cDNAs. Neuron. 1992;9:861–871. doi: 10.1016/0896-6273(92)90239-a. [DOI] [PubMed] [Google Scholar]
- Lockery SR, Goodman MB. Ion Channels Part B 1998 [Google Scholar]
- Mannion NM, Greenwood SM, Young R, Cox S, Brindle J, Read D, Nellåker C, Vesely C, Ponting CP, McLaughlin PJ, et al. The RNA-Editing Enzyme ADAR1 Controls Innate Immune Responses to RNA. Cell Rep. 2014;9:1482–1494. doi: 10.1016/j.celrep.2014.10.041. [DOI] [PMC free article] [PubMed] [Google Scholar]
- Michalski A, Cox J, Mann M. More than 100,000 detectable peptide species elute in single shotgun proteomics runs but the majority is inaccessible to data-dependent LC-MS/MS. J Proteome Res. 2011;10:1785–1793. doi: 10.1021/pr101060v. [DOI] [PubMed] [Google Scholar]
- Morse DP, Aruscavage PJ, Bass BL. RNA hairpins in noncoding regions of human brain and Caenorhabditis elegans mRNA are edited by adenosine deaminases that act on RNA. Proc Natl Acad Sci U S A. 2002;99:7906–7911. doi: 10.1073/pnas.112704299. [DOI] [PMC free article] [PubMed] [Google Scholar]
- Murakoshi H, Trimmer JS. Identification of the Kv2.1 K+ Channel as a Major Component of the Delayed Rectifier K+ Current in Rat Hippocampal Neurons. J Neurosci. 1999;19:1728–1735. doi: 10.1523/JNEUROSCI.19-05-01728.1999. [DOI] [PMC free article] [PubMed] [Google Scholar]
- Neeman Y, Levanon EY, Jantsch MF, Eisenberg E. RNA editing level in the mouse is determined by the genomic repeat repertoire. RNA. 2006;12:1802–1809. doi: 10.1261/rna.165106. [DOI] [PMC free article] [PubMed] [Google Scholar]
- Nishikura K. A-to-I editing of coding and non-coding RNAs by ADARs. Nat Rev Mol Cell Biol. 2015;17:83–96. doi: 10.1038/nrm.2015.4. [DOI] [PMC free article] [PubMed] [Google Scholar]
- Palavicini JP, O’Connell MA, Rosenthal JJC. An extra double-stranded RNA binding domain confers high activity to a squid RNA editing enzyme. RNA. 2009;15:1208–1218. doi: 10.1261/rna.1471209. [DOI] [PMC free article] [PubMed] [Google Scholar]
- Palavicini JP, Correa-Rojas RA, Rosenthal JJC. Extra double-stranded RNA binding domain (dsRBD) in a squid RNA editing enzyme confers resistance to high salt environment. J Biol Chem. 2012;287:17754–17764. doi: 10.1074/jbc.M112.366005. [DOI] [PMC free article] [PubMed] [Google Scholar]
- Picardi E, Pesole G. REDItools: High-throughput RNA editing detection made easy. Bioinformatics. 2013;29:1813–1814. doi: 10.1093/bioinformatics/btt287. [DOI] [PubMed] [Google Scholar]
- Pinto Y, Cohen HY, Levanon EY. Mammalian conserved ADAR targets comprise only a small fragment of the human editosome. Genome Biol. 2014;15:R5. doi: 10.1186/gb-2014-15-1-r5. [DOI] [PMC free article] [PubMed] [Google Scholar]
- Porath HT, Carmi S, Levanon EY. A genome-wide map of hyper-edited RNA reveals numerous new sites. Nat Commun. 2014;5:4726. doi: 10.1038/ncomms5726. [DOI] [PMC free article] [PubMed] [Google Scholar]
- Ramaswami G, Li JB. RADAR: a rigorously annotated database of A-to-I RNA editing. Nucleic Acids Res. 2014;42:D109–13. doi: 10.1093/nar/gkt996. [DOI] [PMC free article] [PubMed] [Google Scholar]
- Ramaswami G, Lin W, Piskol R, Tan MH, Davis C, Li JB. Accurate identification of human Alu and non-Alu RNA editing sites. Nat Methods. 2012;9:579–581. doi: 10.1038/nmeth.1982. [DOI] [PMC free article] [PubMed] [Google Scholar]
- Reenan RA. Molecular determinants and guided evolution of species-specific RNA editing. Nature. 2005;434:409–413. doi: 10.1038/nature03364. [DOI] [PubMed] [Google Scholar]
- Rieder LE, Staber CJ, Hoopengardner B, Reenan RA. Tertiary structural elements determine the extent and specificity of messenger RNA editing. Nat Commun. 2013;4:2232. doi: 10.1038/ncomms3232. [DOI] [PubMed] [Google Scholar]
- Rieder LE, Savva YA, Reyna MA, Chang Y-J, Dorsky JS, Rezaei A, Reenan RA. Dynamic response of RNA editing to temperature in Drosophila. BMC Biol. 2015;13 doi: 10.1186/s12915-014-0111-3. [DOI] [PMC free article] [PubMed] [Google Scholar]
- Rosenthal JJC, Seeburg PH. A-to-I RNA Editing: Effects on Proteins Key to Neural Excitability. Neuron. 2012;74:432–439. doi: 10.1016/j.neuron.2012.04.010. [DOI] [PMC free article] [PubMed] [Google Scholar]
- Shomrat T, Zarrella I, Fiorito G, Hochner B. The Octopus Vertical Lobe Modulates Short-Term Learning Rate and Uses LTP to Acquire Long-Term Memory. Curr Biol. 2008;18:337–342. doi: 10.1016/j.cub.2008.01.056. [DOI] [PubMed] [Google Scholar]
- Shomrat T, Turchetti-Maia AL, Stern-Mentch N, Basil JA, Hochner B. The vertical lobe of cephalopods: an attractive brain structure for understanding the evolution of advanced learning and memory systems. J Comp Physiol A Neuroethol Sensory, Neural, Behav Physiol. 2015;201:947–956. doi: 10.1007/s00359-015-1023-6. [DOI] [PubMed] [Google Scholar]
- Slotkin W, Nishikura K. Adenosine-to-inosine RNA editing and human disease. Genome Med. 2013;5:105. doi: 10.1186/gm508. [DOI] [PMC free article] [PubMed] [Google Scholar]
- Söller R, Warnke K, Saint-Paul U, Blohm D. Sequence divergence of mitochondrial DNA indicates cryptic biodiversity in Octopus vulgaris and supports the taxonomic distinctiveness of Octopus mimus (Cephalopoda: Octopodidae) Mar Biol. 2000;136:29–35. [Google Scholar]
- St Laurent G, Tackett MR, Nechkin S, Shtokalo D, Antonets D, Savva YA, Maloney R, Kapranov P, Lawrence CE, Reenan RA. Genome-wide analysis of A-to-I RNA editing by single-molecule sequencing in Drosophila. Nat Struct Mol Biol. 2013;20:1333–1339. doi: 10.1038/nsmb.2675. [DOI] [PubMed] [Google Scholar]
- Taglialatela M, Toro L, Stefani E. Novel voltage clamp to record small, fast currents from ion channels expressed in Xenopus oocytes. Biophys J. 1992;61:78–82. doi: 10.1016/S0006-3495(92)81817-9. [DOI] [PMC free article] [PubMed] [Google Scholar]
- Vizcaino JA, Csordas A, Del-Toro N, Dianes JA, Griss J, Lavidas I, Mayer G, Perez-Riverol Y, Reisinger F, Ternent T, et al. 2016 update of the PRIDE database and its related tools. Nucleic Acids Res. 2016;44:D447–D456. doi: 10.1093/nar/gkv1145. [DOI] [PMC free article] [PubMed] [Google Scholar]
- Washburn MC, Kakaradov B, Sundararaman B, Wheeler E, Hoon S, Yeo GW, Hundley HA. The dsRBP and Inactive Editor ADR-1Utilizes dsRNA Binding to Regulate A-to-I RNA Editing across the C.elegans Transcriptome. Cell Rep. 2014;6:599–607. doi: 10.1016/j.celrep.2014.01.011. [DOI] [PMC free article] [PubMed] [Google Scholar]
- Whipple JM, Youssef OA, Aruscavage PJ, Nix DA, Hong C, Johnson WE, Bass BL. Genome-wide profiling of the C. elegans dsRNAome. RNA. 2015;21:786–800. doi: 10.1261/rna.048801.114. [DOI] [PMC free article] [PubMed] [Google Scholar]
- Xu G, Zhang J. Human coding RNA editing is generally nonadaptive. Proc Natl Acad Sci U S A. 2014;111:3769–3774. doi: 10.1073/pnas.1321745111. [DOI] [PMC free article] [PubMed] [Google Scholar]
- Young JZ. Learning and discrimination in the octopus. Biol Rev Camb Philos Soc. 1961:32–96. doi: 10.1111/j.1469-185x.1961.tb01432.x. [DOI] [PubMed] [Google Scholar]
- Young JZ. The central nervous system of Nautilus. Philos Trans B. 1965;249:1–25. [Google Scholar]
- Young JZ. The Anatomy of the Nervous System of Octopus vulgaris. Clarendon Press; 1971. [Google Scholar]
- Yu Y, Zhou H, Kong Y, Pan B, Chen L, Wang H, Hao P, Li X. The landscape of A-to-I RNA editome is shaped by both positive and purifying selection. PLOS Genet. 2016;12:e1006191. doi: 10.1371/journal.pgen.1006191. [DOI] [PMC free article] [PubMed] [Google Scholar]
- Zhao HQ, Zhang P, Gao H, He X, Dou Y, Huang AY, Liu XM, Ye AY, Dong MQ, Wei L. Profiling the RNA editomes of wild-type C. elegans and ADAR mutants. Genome Res. 2015;25:66–75. doi: 10.1101/gr.176107.114. [DOI] [PMC free article] [PubMed] [Google Scholar]
Associated Data
This section collects any data citations, data availability statements, or supplementary materials included in this article.
Supplementary Materials
Editing levels in 887 recoding sites shared by all species are highly, positively and significantly correlated in all pairs of coleoid cephalopod species (p<1.0e–75 for all pairs). Correlation is higher the closer the species are to each other in evolutionary terms, with Pearson rho = 0.95 for the two octopus species.
Table S4. Editing sites detected (genome-free method, all species), related to Figure 1.
Orthologous cephalopod Kv2.1 channel sequences are abundantly edited. Editing sites predicted by our analysis are indicated by small boxes around specific amino acids. Conserved transmembrane spans S1–S6 are enclosed in large boxes. The unique editing site for Sepia in S4 (I529V) and the common editing site in S6 (Squid I579V, Sepia I630V and Octopus vulgaris I632V) were those studied using electrophysiology in Figure 6 of the main test. The alignment was generated using Vector NTI software.
(A) Examples of current traces recorded on fast (top) and slow (bottom) time-bases following activating pulses to +60 mV from a holding potential of −80 mV. These traces illustrate the variable activation and inactivation rates of the genomically encoded channels.
(B) The channels’ voltage sensitivities are similar. Relative conductance was measured from normalized tail-current amplitudes following 150 ms activating pulses to various activation voltages (Vm).
(C) Inactivation time constants (τ) taken from single exponential fits to current traces measured during a 1-second activation step of Vm (similar to the traces presented in panel A).
(D) The half-times for 150 ms activating pulses were measured from traces similar to those presented in panel A. They measure the time it takes for the currents to reach one half of their maximum values following an activating voltage step. N=6 ± S.E.M. for all graphs.
(A–F) Species-to-species mutations are suppressed within ~100bp of a recoding site shared by the two species (left panels). No effect is seen when taking random non-edited sites from conserved regions within the same transcripts (right panels) (A) Oct.bim.-Oct.vul. (B) Oct.bim.-Sepia (C) Oct.bim.-Squid (D) Sepia-Oct.vul. (E) Squid-Oct.vul. (F) Squid-Sepia. (yellow – synonymous change, light green – non-synonymous; dark green – deletions; Mutations density is the number of mutations found at a given distance from an editing site divided by the number of such sites, i.e. mutations per base-pair)
(G) Intra-species genomic polymorphisms are suppressed in genomic loci surrounding editing sites. Genomic polymorphisms are depleted near editing/recoding/conserved-recoding sites, attesting for a decrease in genome plasticity. Effect is stronger for recoding sites, and even more so for the conserved recoding sites.
(H) Higher GC content in the vicinity of editing sites. GC content is elevated near editing sites. This effect persists up to ~100bp, and is therefore unlikely to be explained by the local ADAR preferences. Rather, it may facilitate formation of stronger and more stable double-stranded RNA structures required for ADAR binding and editing. Blue: all editing sites; green: all recoding sites; red: conserved recoding sites; dashed black line: GC content averaged over all ORFs. Error bars represent the S.E.M. The effect is not seen in for AG mismatches found in nautilus, expected to be mostly false-positives.
(A) Mutation rates (averaged over all orthologous parts of the transcriptome) are presented as a function of the distance of the genomic base to the closest conserved recoding site. The baseline mutation rate (red) represents the rate measured for all sites at distances >1000bp from a recoding site (including mutations in ORFs harboring no editing site). Integrating the difference between the baseline and the observed rate for genomic location at a distance shorter than 1000bp provides an estimate of the number of avoided mutations, apparently due to the constraints imposed by editing. We estimate the fraction of avoided mutations as the number of avoided mutations divided by (#avoided+#observed), and find this fraction (marked as A in the different panels) to be 3–15%. This is an underestimation, as sites not conserved between the two species, or sites in transcriptome regions not conserved between the two species, are not taken into account.
(B) Similar to the analysis presented in (A), we looked at the SNPs density (number of SNPs per bp) as a function of the distance of the genomic base to the closest recoding site. The baseline SNPs density (red) is the density observed at distances of >500bp from a recoding site (including SNPs in ORFs harboring no editing site). Integrating the difference between the baseline and the observed rate for genomic location at a distance shorter than 500bp provides an estimate of the number of avoided SNPs, apparently due to the constraints imposed by editing. Here too, we estimate the fraction of avoided SNPs as the number of avoided SNPs divided by (#avoided+#observed), and find this fraction (marked as A in the different panels) to be 10–26%. This is an underestimation, as the contributions of sites in non-conserved transcriptome regions, are not taken into account.
Table S5. Editing sites detected (genome alignment, Oct. Bim.), related to Figure 3.
Table S6. GO enrichment data (Oct. Bim.), related to Figure 3.
Table S7. Editing sites conserved across species, related to Figure 4.