

Abstract
Sensory stimuli drive the maturation and function of the mammalian nervous system in part through the activation of gene expression networks that regulate synapse development and plasticity. These networks have primarily been studied in mice, and it is not known whether there are species- or clade-specific activity-regulated genes that control features of brain development and function. Here we use transcriptional profiling of human fetal brain cultures to identify an activity-dependent secreted factor, Osteocrin (OSTN), that is induced by membrane depolarization of human but not mouse neurons. We find that OSTN has been repurposed in primates through the evolutionary acquisition of DNA regulatory elements that bind the activity-regulated transcription factor MEF2. In addition, we demonstrate that OSTN is expressed in primate neocortex and restricts activity-dependent dendritic growth in human neurons. These findings suggest that, in response to sensory input, OSTN regulates features of neuronal structure and function that are unique to primates.
The complexity of primate cognition and behaviour is thought to be the culmination of clade- and species-specific aspects of brain ontogenesis. In anthropoid primates, especially humans, this process results in a hugely expanded cerebral cortex, an increase in morphological and cellular diversity, a vast increase in the complexity of neuronal connectivity, and a prolonged period of experience-driven circuit development1,2. An unresolved question is how distant mammals, such as mice and humans, can have nearly the same number of genes when the human brain is so vastly more complex in form and function than the mouse brain. Recent studies have begun to address this question by elucidating the underlying genetic and molecular mechanisms that contribute to primate brain development, focusing on features of neural stem and progenitor cell biology in primates and in mice3–5. However, there has been limited progress in identifying the specific genes that underlie the complexity of neuronal connectivity in primates6 or the genes that regulate primate-specific aspects of experience-dependent brain development. In this study, we used RNA sequencing (RNA-seq) to characterize the activity-regulated transcriptome in human fetal brain neurons and thereby to determine whether features of this signalling network have evolved specifically in humans or primates in general and might control aspects of experience-dependent brain development. We report that the non-neuronal mouse gene Ostn has been repurposed via evolutionary changes that give rise to a new enhancer sequence, which in response to sensory experience drives OSTN expression in the primate brain and may restrict dendritic growth in the developing cortex.
Activity-regulated neuronal transcriptome
We established a dissociated culture system for primary human fetal brain cultures (hFBCs) (Extended Data Fig. 1a). Although these cultures exhibit significant cellular heterogeneity (Extended Data Fig. 1b, c), cultures obtained from independent brain samples nevertheless have reproducible gene expression profiles (Extended Data Fig. 1f) that cluster more closely with those of brain tissue than of other human tissues (Extended Data Fig. 1g). By gene expression analysis (Extended Data Fig. 2a–f) and immunostaining for cortical markers (Extended Data Fig. 1d, e), we confirmed that hFBCs are enriched for cortical neuronal subtypes.
We induced voltage-dependent calcium influx into hFBCs by exposing the cultures to elevated levels of potassium chloride (55 mM KCl) to trigger synchronous membrane depolarization, which mimics the cellular response to neuronal activity. This method has been shown to reliably induce a pattern of activity-dependent gene transcription in cultured rodent neurons7,8 that is highly similar to the pattern of gene induction that occurs in the intact brain in response to a wide variety of physiological stimuli9. Activity-induced transcriptional responses in hFBCs at the two chosen time points are consistent with the well-established biphasic transcriptional program observed in rodent neurons8. Early-response genes (ERGs) encoding transcriptional regulators, including the well-characterized immediate-early genes NPAS4, FOS, JUNB, NR4A1, NR4A3, and FOSB (Extended Data Fig. 3a, c), were induced within 1 h of depolarization, and a larger set of late-response genes (LRGs) was then induced within 6 h of membrane depolarization (Extended Data Fig. 3b). The LRGs preferentially encode secreted, cytoplasmic, and transmembrane factors (Extended Data Fig. 3d), including previously reported activity-regulated loci8 such as BDNF, ADCYAP1, PCSK1 and GPR22 (Supplementary Table 1).
Although we found that the activity-dependent transcriptomes of rodent and human cultures shared many common induced genes (Supplementary Tables 2–4), we identified a group of genes that were selectively induced in response to membrane depolarization in hFBCs. These included the secreted protein-encoding gene OSTN, and two primate-specific genes: ZNF331, a kruppel-associated box zinc-finger protein, and the long non-coding RNA LINC00473 (Extended Data Fig. 3a, b). The mouse Ostn gene (also known as Musclin) encodes a small (12-kD) secreted protein that is expressed selectively in mouse skeletal muscle and bone, but not in the mouse brain10–12. To investigate the functional significance of differences in activity-dependent gene expression between mice and humans, we focused our efforts on OSTN, as it was the most highly induced gene in our transcriptome analysis.
OSTN is expressed in the human cortex
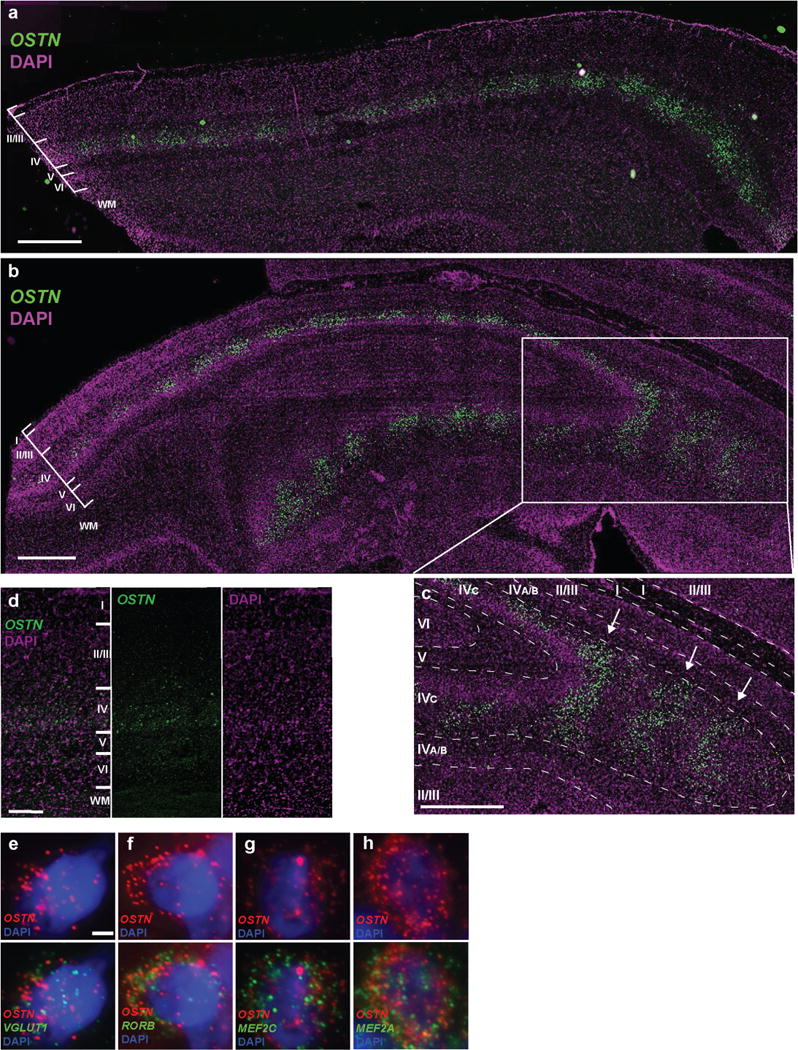
RNA-seq (Fig. 1a) and quantitative PCR with reverse transcription (RT–PCR) analysis confirmed that OSTN mRNA was significantly induced (>100-fold) in human fetal brain cultures in a manner that is dependent on calcium influx through L-type voltage-sensitive calcium channels (Fig. 1b); however, Ostn mRNA was not expressed or induced in mouse or rat neurons (Fig. 1a, b and Extended Data Fig. 4). OSTN mRNA was also induced upon exposure of hFBCs to the glutamate receptor agonist N-methyl-D-aspartate (NMDA) (Fig. 1b). The induction of OSTN mRNA is not a singular feature of hFBCs, inasmuch as OSTN mRNA was also induced upon membrane depolarization in two other human neuronal culture systems (Fig. 1b) derived from human induced pluripotent stem cells (iPSCs) (Extended Data Fig. 5). We next used fluorescence in situ hybridization (FISH) analysis to identify the neuronal subtypes that expressed OSTN mRNA. This analysis revealed that OSTN mRNA induction in hFBCs occurred selectively in a subset (SATB2+, RORB+, BCL11B− (also known as CTIP2)) of glutamatergic excitatory neurons (MAP2+, SLC17A7+ (also known as VGLUT1), GAD1−) (Fig. 1c–n).
Figure 1. OSTN is an activity-regulated factor in human neocortex.
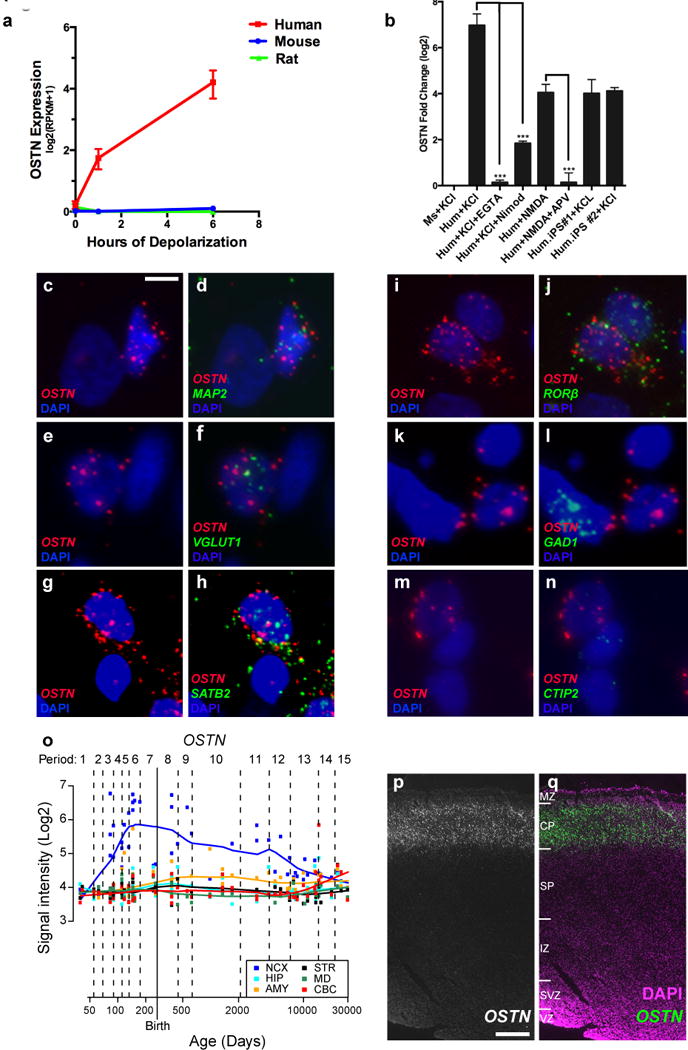
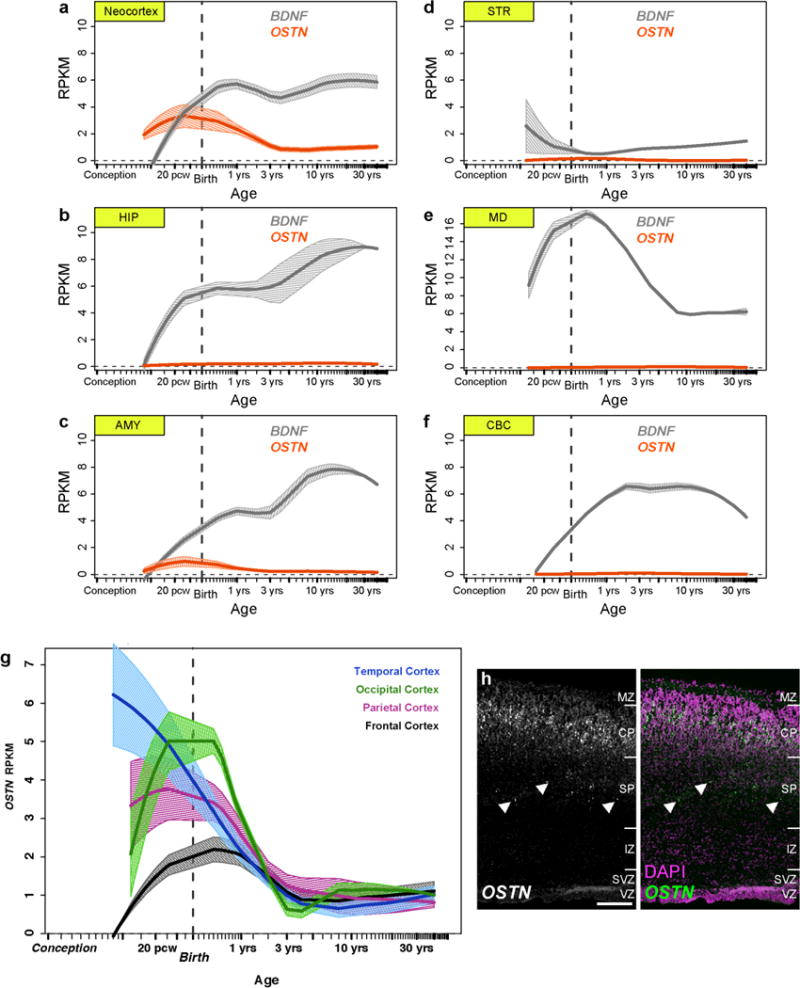
a, OSTN expression in response to membrane depolarization as measured by RNA-seq in hFBCs (n = 5), rat (n = 3) and mouse (n = 4) cortical neuronal cultures. Data shown as mean ± s.e.m. b, Quantitative RT–PCR for OSTN induction in mouse cortical cultures (Ms, n = 2), hFBCs (Hum), iCell neurons35 (Hum. iPS#1, n = 3), and in vitro differentiated cortical neurons (Hum. iPS#2, n = 2) after treatment relative to untreated. KCl depolarization (KCl, n = 4), glutamate receptor agonist (NMDA, n = 2), calcium chelator (EGTA, n = 3), L-type calcium channel blocker nimodopine (Nimod, n = 3), NMDA receptor antagonist (2-amino-5-phosphonovalerate; APV, n = 2). OSTN expression normalized to GAPDH. n = number of biological replicates. Mean ± s.e.m., ***P < 0.001, Student’s t-test. c–n, FISH of depolarized hFBCs showing co-expression of OSTN with MAP2 (pan-neuronal; c, d), VGLUT1 (glutamatergic neurons; e, f), SATB2 (cortical layer II–IV; g, h), and RORB (layer IV; i, j). OSTN mRNA is excluded from cells positive for GAD1 (inhibitory neurons; k, l) and CTIP2 (cortical layer V; m, n). Nuclei are marked with DAPI (blue). Scale bar, 6.5 μm (c–f, i, j) or 5 μm (g, h, k–n). o, OSTN expression in regions of the developing human brain from HBT database, including striatum (STR), amygdala (AMY), neocortex (NCX), hippocampus (HIP), mediodorsal nucleus of the thalamus (MD), and cerebellar cortex (CBC). p, q, FISH of human fetal brain (pcw16) coronal section showing selective expression of OSTN in the cortical plate of temporal cortex in greyscale (p), or overlay (q) with DAPI nuclear stain. Scale bar, 390 μm. MZ, marginal zone; CP, cortical plate; SP, subplate; IZ, intermediate zone; SVZ, subventricular zone; VZ, ventricular zone.
These culture-based findings are corroborated by data from the available Human Brain Transcriptome (HBT) database13 and the BrainSpan Project (http://www.brainspan.org/). Analysis of these data revealed that OSTN mRNA is enriched across human neocortical regions, but appears not to be expressed at appreciable levels in other compartments of the neocortical wall or in brain regions such as the hippocampus, striatum, mediodorsal nucleus of the thalamus and cerebellum (Fig. 1o and Extended Data Fig. 6). OSTN expression increases during the course of fetal development and peaks around the late–mid fetal stage, concurrent with the onset of synaptogenesis in the cortical plate14. To confirm these findings, we performed FISH analysis of OSTN expression in tissue sections from a human neocortex at postconception week (pcw) 16 and found that OSTN was specifically enriched in the cortical plate of developing neocortex (Fig. 1p, q and Extended Data Fig. 6h). We also compared OSTN to BDNF, a well characterized activity-regulated secreted factor in rodent and human brains15, and found that while BDNF was expressed in multiple human brain regions, OSTN expression was restricted to the neocortex, and, to a lesser extent, the amygdala (Extended Data Fig. 6a–f). Furthermore, OSTN expression was particularly enriched in regions of temporal and occipital cortex, and to a lesser extent in parietal and frontal cortical regions (Extended Data Fig. 6g). Together, these observations indicate that OSTN is an activity-regulated gene that is expressed in a subset of neocortical excitatory neurons in the prenatal and postnatal human brain.
OSTN has been repurposed in primates
To determine when and how OSTN was repurposed during evolution, so that instead of being narrowly expressed in bone and muscle it is also transcribed in the human brain in response to neuronal activity, we sought to characterize the regulatory elements within the OSTN gene locus that mediate activity-dependent OSTN expression in human excitatory neocortical neurons. The identification of these regulatory elements has the potential to reveal which species, in addition to humans, express OSTN in response to neuronal activity. This should facilitate elucidation of the genetic mechanisms that regulate OSTN transcription, and serve as a first step for establishing the function of OSTN in the human brain.
In principle, the expression of OSTN in human but not mouse neurons could be due to cis-regulatory element changes in the OSTN locus during evolution or to species-specific differences in the expression of a transcription factor(s) that controls OSTN expression in neurons, or both. To distinguish between these possibilities, we tested the ability of the 2-kb genomic region directly 5′ of the human OSTN and mouse Ostn transcriptional start sites to drive luciferase reporter gene expression (−2kbhOSTN:Fluc and −2kbmOstn:Fluc, respectively) in mouse and human neurons. After transfection of these constructs into neurons, we measured the luciferase expression before and after membrane depolarization. We found that −2kbhOSTN:Fluc was induced robustly in response to membrane depolarization in mouse or human neurons, whereas the homologous mouse sequence (−2kbmOstn:Fluc) did not drive substantial luciferase expression in neurons of either species (Fig. 2a and Extended Data Fig. 7a, b). These findings suggest that the human specificity of OSTN induction is conferred at least in part by the presence of DNA sequences within the human OSTN regulatory region that are not present in the homologous mouse sequence. To identify these sequences, we introduced a series of truncations (Fig. 2a, green) and deletions (Extended Data Fig. 8, purple) into the −2kbhOSTN regulatory region of the luciferase reporter construct and assessed their effect on the induction of luciferase expression. This analysis identified an 85-bp sequence, located about 600 bp upstream of the site of initiation of OSTN mRNA synthesis, that is required for efficient activity-dependent induction of the OSTN reporter gene (Fig. 2a, d). The 85-bp sequence induces expression regardless of its orientation in the reporter construct, suggesting that it is a proximal enhancer element (Fig. 2a (teal dashed)). Examination of this sequence revealed three putative myocyte enhancer factor 2 (MEF2)-responsive elements (MREs), referred to here as MRE1–3, two of which were present in human OSTN but not the mouse Ostn gene (Fig. 2d). These differences could explain why activity induces OSTN transcription in human but not mouse neurons.
Figure 2. Primate-specific enhancer regulation by MEF2 drives neuronal activity-dependent induction of OSTN.

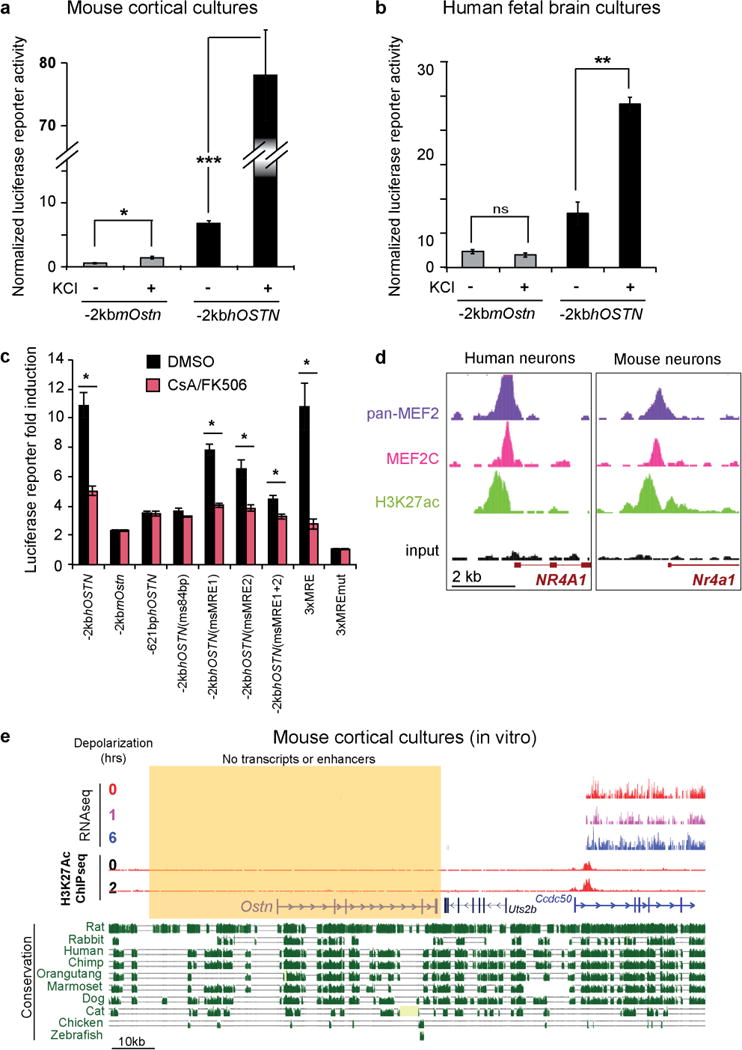
a, The 2-kb human genomic region upstream of OSTN (–2kbhOSTN, black), but not the homologous mouse sequence (–2kbmOstn, grey), drives the expression of a luciferase reporter gene in response to membrane depolarization (55 mM KCl) in mouse cortical cultures. Truncations (green) of –2kbhOSTN identify an 85-bp region that is critical for luciferase induction. Reversal of the 85-bp sequence orientation does not affect gene induction (teal dashed), unlike point mutations that disrupt MEF2 binding (3g mutations, blue). b, Luciferase assays with –2kbhOSTN, mutating the individual MREs or the entire 85-bp enhancer to the corresponding mouse sequence (gold). See Extended Data Fig. 8b. One-way ANOVA degrees of freedom = (33, 266), P < 1.0 × 10⁻¹³, Holm-Sidak overall error rate of 0.05, ***P < 1.22 × 10⁻⁵. c, Quantitative RT–PCR for endogenous OSTN and NPAS4 gene induction in days in vitro (DIV) 21 hFBCs following 6 h of KCl depolarization. Addition of calcineurin inhibitors (CsA and FK506, n = 4) or siRNAs targeting MEF2C (MEF2 siRNA, n = 4) specifically affected OSTN induction. n = number of biological replicates. Mean ± s.e.m., Student’s t-test **P < 0.01, ***P < 0.001, n.s. = not significant. d, Sequence conservation map of the 85-bp enhancer element. Conserved bases are grey, non-conserved bases are black, gaps in alignment are dashed, and sequence changes predicted to disrupt MEF2 binding are red. e, ChIP–seq using a pan-MEF2 antibody (purple), a MEF2C-specific antibody (fuschia), and an H3K27ac antibody (green) indicating active chromatin from hFBCs (left) and mouse cortical cultures (right) shows enrichment for MEF2 binding at the primate-specific 85-bp enhancer region (blue highlight) in hFBCs but not in mouse neurons.
On the basis of the similarity of the MREs in the human OSTN enhancer to the consensus binding site for MEF2 (YTAWWWWTAR)16,17, each of these elements was predicted to bind the MEF2 family of four transcription factors, three of which (MEF2A, C, and D) are prominently expressed in the human cortex13 (http://www.brainspan.org/). MEF2 family members are activated by membrane depolarization-induced calcium influx into neurons, which then triggers activation of the calcium-dependent phosphatase calcineurin and the subsequent dephosphorylation and activation of MEF2 (ref. 7,18,19). To determine whether MEF2 binding to the 85-bp enhancer region is required for the membrane depolarization-dependent induction of reporter gene expression, we either introduced inactivating point mutations18 (3g mutations) into the three MREs of the 85-bp enhancer (Fig. 2a, blue), or exposed neurons to two small-molecule calcineurin inhibitors (CsA and FK506; Extended Data Fig. 7c), which inhibit membrane depolarization-dependent dephosphorylation and activation of MEF2. These experiments demonstrated that activity-dependent induction of −2kbhOSTN:Fluc was calcineurin-dependent and required intact MRE sequences within the 85-bp enhancer. Furthermore, chromatin immunoprecipitation sequencing (ChIP–seq) for MEF2 family members showed enrichment in human but not mouse neurons at the 85-bp enhancer region (Fig. 2e and Extended Data Fig. 7d), indicating that MEF2 binds to the endogenous OSTN locus in human neurons. It is noteworthy that an additional site of shared MEF2 binding was observed in human and mouse neurons upstream of the 85-bp enhancer; in mouse neurons, this site lacks epigenomic marks associated with active chromatin (for example, no enrichment of H3K27ac in Fig. 2e and Extended Data Fig. 7e) and thus is likely to represent a transcriptionally inert site of MEF2 binding in mice. Our findings suggest that evolution of the tandem MEF2-binding sites within the human 85-bp enhancer element probably explains, at least in part, why OSTN is induced in response to neuronal activity in human but not mouse neurons.
The identification of regulatory sequences within the human OSTN gene that confer the response to neuronal activity allowed us to investigate the evolutionary origin of activity-dependent OSTN expression in the brains of other mammals (for example, macaque, marmoset, mouse, rabbit and cat). We interrogated available genome sequences for the presence of the identified MRE sites within the regulatory region of the OSTN gene. This analysis revealed that the combined MRE1/2 motifs are conserved specifically in anthropoid primates but are not present in prosimian primates, rodents or a variety of other species examined (Fig. 2d). Moreover, replacing these two MREs, or the entire 85-bp enhancer element of the human OSTN sequence, with the corresponding mouse sequences, disrupted depolarization-induced −2kbhOSTN reporter gene expression in neurons (Fig. 2b (gold)). Finally, the activity-dependent increase in endogenous OSTN transcript in human neurons was specifically impaired by calcineurin inhibitors (CsA and FK506) or a small inhibitory RNA (siRNA) against MEF2C (per cent knockdown, 48.96 ± 5.7), the most abundant MEF2 family member in the human neocortex (Fig. 2c). Together, these findings indicate that the repurposing of OSTN as a neuronal activity-responsive gene occurred during the evolution of the anthropoid primates through subtle sequence changes (around 5–10 nucleotides) within a highly conserved region of the OSTN gene, and that these changes led to the emergence of a new activity-regulated enhancer element with functional MEF2 sites.
OSTN is regulated by activity in vivo
The finding that the 85-bp OSTN enhancer (including the MREs) is conserved in primates provided us with the opportunity to test whether the induction of OSTN that we observe in cultured neurons in response to membrane depolarization occurs in the intact brain in response to sensory stimuli. If so, it should be possible to use FISH to identify the specific neurons in the cortex that express activity-dependent OSTN mRNA in order to gain insight into the function of OSTN in the brain. Towards this end, we used a monocular inactivation assay in the Old World Macaque monkey (Macaca mulatta), an established model for studying activity-dependent cortical plasticity and gene expression in the primary visual cortex20,21. Vision is the dominant sensory modality in primates, and during evolution the size and complexity of the visual cortex in primates have expanded more than those of any other species in the mammalian lineage22. In primates, under normal conditions, inputs from the left and right eyes remain segregated through the lateral geniculate nucleus (LGN) of the thalamus and innervate the geniculorecipient layers of the primary visual cortex (area 17 or V1). In V1, the two eyes’ inputs form alternating stripes termed ocular dominance columns (ODCs)23 (Fig. 3a). Monocular inactivation in adult monkeys results in a characteristic pattern of alternating active and inactive ODCs that can be used to assess sensory activity-dependent gene expression when labeled by FISH21. To test whether OSTN expression in the macaque brain is induced by visual experience, we blocked retinal activity in one eye of adult rhesus macaques using tetrodoxin injection and one day later removed, froze and sectioned the occipital cortex. FISH analysis in sections of V1 revealed that, after monocular inactivation, OCC1 (also known as FSTL1), a known activity-dependent gene in macaque V124, was expressed in an alternating pattern of greater and lesser gene expression (Fig. 3b). Thus, OCC1 serves as a marker of ODCs receiving input from the active eye. OSTN mRNA was found to be expressed at a higher level in active than in inactive ODCs, indicating that OSTN mRNA expression in the primate brain is induced by sensory experience (Fig. 3b, c and Extended Data Fig. 9a–c). Nuclear staining and FISH with probes that hybridize to mRNAs that are specifically expressed in glutamatergic neurons (VGLUT1+) (Extended Data Fig. 9e) or cortical layer IV (RORB+) neurons (Extended Data Fig. 9f) revealed that OSTN expression was almost exclusively restricted to excitatory neurons in cortical layer IVC, the neurons that receive direct input from the LGN23. In addition, OSTN was coexpressed with MEF2C and MEF2A in layer IVC neurons (Extended Data Fig. 9g, h), consistent with the finding that in primates the activity-dependent induction of OSTN is mediated by MEF2 activation. Together, these observations suggest that activity- and MEF2-dependent regulation of OSTN expression has evolved in the primate brain to regulate excitatory neuron function specifically in the input layers of the larger and more complex neocortex of primates. In line with this idea, we found that OSTN expression was also enriched in layer IV of the macaque multimodal parietal cortex (Extended Data Fig. 9d). While OSTN expression is regulated by the activity of afferent inputs in the adult, it may also be driven by spontaneous activity during the early stages of cortical development25,26 before the majority of synaptic inputs are established.
Figure 3. OSTN expression is induced by sensory experience in the primate cortex.
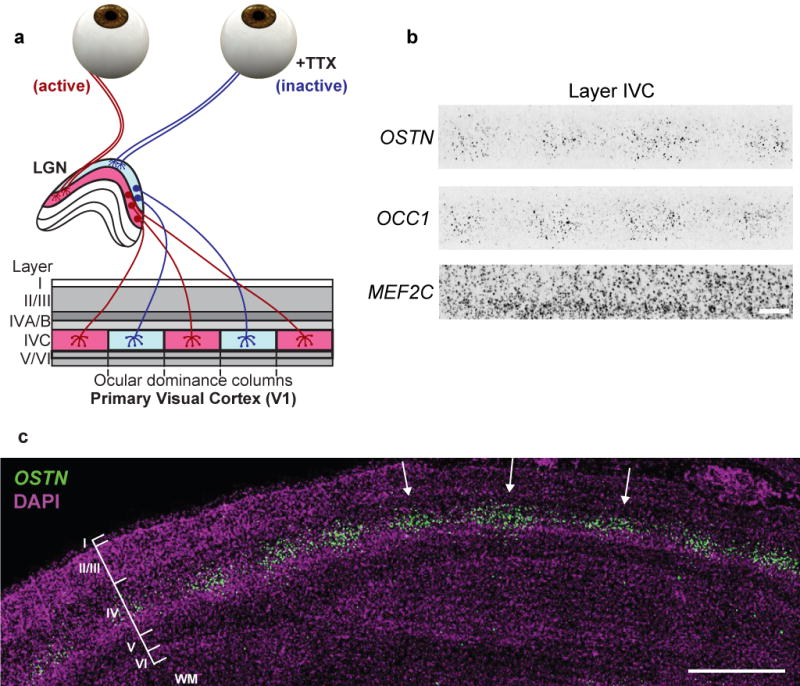
a, Schematic diagram of macaque visual pathway and monocular inactivation assay. For simplicity, only one hemisphere is depicted. b, High magnification FISH images of monocularly inactivated layer IVC neurons for OSTN, OCC1, and MEF2C transcripts. Scale bar, 188 μm. c, FISH image of OSTN from a radial section of monocularly inactivated macaque primary visual cortex. Scale bar, 1,000 μm. Cortical layers I–VI and white matter (WM) are labelled, and active ocular dominance columns are indicated with arrows.
OSTN regulates dendritic growth
To investigate the function of OSTN in the primate brain, we adapted a chronic activity culture paradigm27 (CAP) in which neurons were maintained under mildly depolarizing conditions (20 mM KCl) to mimic neuronal activity, drive OSTN transcription and secretion (Extended Data Fig. 10a, b), and elicit activity-driven changes in neuronal morphology and function. Under these culture conditions, OSTN induction was suppressed by the addition of either of two different OSTN-specific siRNAs (84% and 94% knockdown; Extended Data Fig. 10b) or enhanced by overexpression of OSTN, and the effect on dendritic growth was assessed. Introduction of a GFP-based reporter driven by the −2kbhOSTN regulatory region (−2kbhOSTN:GFP) allowed us to visualize OSTN-expressing cells (Extended Data Fig. 10c, d). Following OSTN knockdown (loss-of-function, LOF) or overexpression (gain-of-function, GOF), cultures were grown for three days to allow the accumulation of GFP and OSTN and then immunostained for GFP and MAP2 to visualize the somata and dendritic arbors of OSTN-expressing cells. Sholl analyses revealed that reductions in OSTN substantially increased dendritic branch number and complexity, whereas increasing OSTN levels led to marked inhibition of dendritic branching (Fig. 4a–d). These findings suggest that OSTN functions to restrict dendritic growth in response to membrane depolarization. Notably, neuronal soma size was also increased when OSTN expression was reduced, suggesting that OSTN may restrict neuronal growth overall (Fig. 4e). Furthermore, immunostaining for endogenous OSTN protein in hFBCs indicated that OSTN was localized to the soma and primary dendrites of neurons, consistent with the proposed role of OSTN in dendritic growth and arborization (Extended Data Fig. 10e–g).
Figure 4. OSTN regulates activity-dependent dendritic growth.
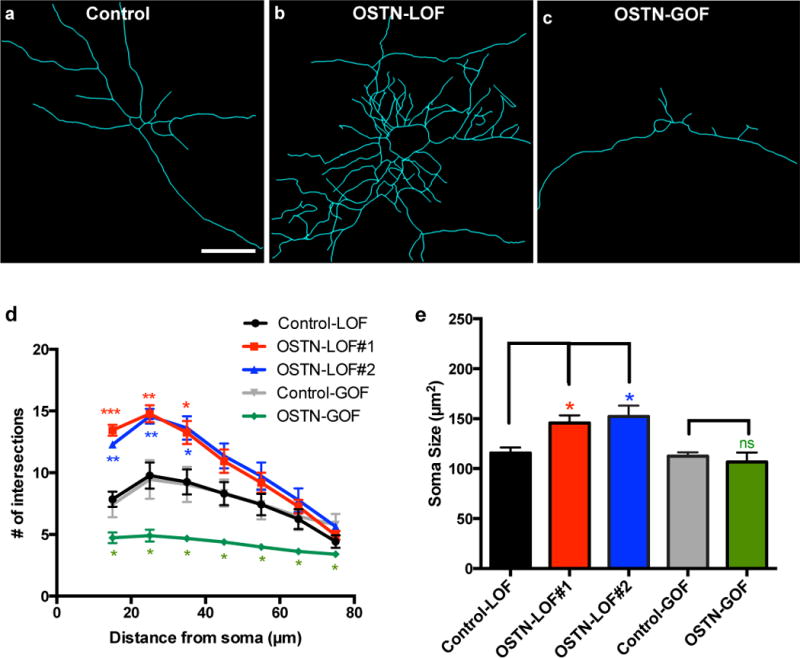
a–c, Representative GFP tracings of individual hFBC neurons transfected with –2kbhOSTN:GFP and treated with scrambled siRNA (Control, a) or OSTN siRNA#1 (OSTN-LOF, b), or co-transfected with an OSTN overexpression construct (OSTN-GOF, c) in the presence of CAP for 3 days. Scale bar, 30 μm. d, Sholl analysis plot showing numbers of dendritic intersections as a function of distance from soma for scrambled siRNA (Control-LOF, in 5 biological replicates, 184 neurons analysed (5; 184)), OSTN siRNA#1 (OSTN-LOF#1 (5; 166)), OSTN siRNA#2 (OSTN-LOF#2 (3; 104)), empty vector transfected (Control-GOF (4; 99)), and OSTN overexpression construct transfected (OSTN-GOF (4; 112)). e, Summary of average soma sizes. Mean ± s.e.m., ***P < 0.001; **P < 0.01; *P < 0.05, ns = not significant Student’s t-test.
Conclusions
In this study, we have identified an example of the evolutionary repurposing of a secreted factor via genetic changes that give rise to a new primate-specific enhancer sequence that binds MEF2. MEF2 has been implicated in human cognition because MEF2C mutations resulting in haploinsufficiency represent a relatively common cause of intellectual disability in humans28,29. In addition, MEF2A- and MEF2C-binding sites are enriched in genes associated with idiopathic autism spectrum disorder (ASD), supporting the idea that dysregulation of activity-dependent transcription plays a role in the pathogenesis of ASD30. One intriguing possibility is that OSTN is a critical target of MEF2 whose function is disrupted in MEF2-dependent brain disorders.
Our findings indicate that MEF2, by regulating OSTN expression, restricts the dendritic growth of layer IVC neurons and thus may play an important role in the organization of dense primate neocortical networks31–33. However, the potential contribution of OSTN function to primate cognitive processing and what drove OSTN repurposing specifically in primates during evolution are still unknown. Notably, evolution of the proximal enhancer required for efficient induction of OSTN by neuronal activity occurred selectively in anthropoid primates (monkeys, apes and humans), which are characterized by diurnal lifestyles, large neocortical volumes and complex socio-cognitive skills.
As neuronal activity has been shown to trigger distinct transcriptional responses in different neuronal subtypes34, it seems likely that, in addition to OSTN, other primate-specific neuronal factors remain to be discovered. In this study, we have begun to uncover evolved primate-specific gene regulatory changes that alter intrinsic cellular mechanisms associated with activity-driven plasticity in the neocortex. Investigation of additional neural factors and their regulatory elements may provide further insights into important aspects of human brain development, function and disease.
METHODS
No statistical methods were used to predetermine sample size. The experiments were not randomized and investigators were blinded to sample identity during imaging and quantification for Sholl analysis.
Human neuronal cultures
Initial research performed on samples of human origin was conducted with the approval of the Beth Israel Deaconess Medical Center Committee on Clinical Investigations (IRB#2001P000527). Fetal brain tissue was received after release from clinical pathology, with a maximum post-mortem interval of 4 h. Cases with known pathology were excluded. Tissue was transported in HBSS medium (Life Technologies, Carlsbad, CA) on ice to the laboratory for processing. For the initial fetal brain culture (hFBC) experiments, obtained fetal tissue was dissected and trypsinized. The resulting cell suspensions were gradient purified to remove cell debris using OptiPrep (Sigma; St. Louis, MO) density gradients, adapting the published protocol36. Subsequent studies used primary human neuronal cells purchased from ScienCell (Carlsbad, CA).
KCl depolarization of neurons
For acute KCl depolarization of neurons, neuronal cultures were first silenced overnight in culture medium with 1 μM tetrodotoxin (TTX) and 100 μM D-APV (both Tocris). The next day, samples were incubated for 0, 1 or 6 h in 55 mM KCl before collection (3 × KCl solution: 170 mM KCl, 10 mM HEPES, 2 mM CaCl2, 1 mM MgCl2, pH 7.4). All cultures were monitored during treatment and no adverse effects to cell health were observed. Additionally, we did not observe upregulation of the excitotoxicity-induced gene Clca1 (data not shown). Samples in Fig. 1b were harvested without stimulation as well as 6 h after KCl (55 mM) depolarization or glutamate receptor agonist (NMDA, 20 μM) treatment. Prior to stimulation, samples were treated with the calcium chelator EGTA (5 mM), the L-type channel blocker nimodopine (Nimod, 5 μM), or the NMDA antagonist APV (100 μM) as indicated.
Transcript sequencing and RNA-seq analysis
Previous studies detected robust changes in expression of activity-dependent genes within KCl membrane-depolarized neuronal cultures using three or fewer biological replicates7,8. For RNA-seq experiments, hFBCs from 5 different individuals (ScienCell) were grown according to the supplier’s instructions. At DIV15, neurons were silenced overnight and then KCl depolarized (see above) for 0, 1 or 6 h before collection. Total RNA was isolated from cultures using Trizol (Invitrogen). After DNase treatment and rRNA depletion, strand-specific and paired-end cDNA libraries were generated using the PE RNA-seq library kit (Illumina). Ribosomal RNA depletion was performed using the RiboMinus Eukaryote Kit for RNA-seq (ThermoFisher) and verified using a Bioanalyzer RNA Nano kit (Agilent). Fragment ends were sequenced to produce strand-specific paired-end reads of at least 76 base pairs (bp) in length. RNA-seq was performed using HiSeq 2000 at the Broad Institute and BGI. For each sample at each stimulation time point, both sets of single-end reads were separately aligned to the human genome (hg19 assembly) using the Burrows-Wheeler Aligner (bwa) program, allowing for up to five mismatches. In addition to the usual 24 chromosomal targets, a set of ~7 million short splice-junction sequences (see below) were also provided as targets and incorporated into the BWA index. Each sequenced library comprised 47–240 million reads, of which 55–95% were mappable. Of those reads that did map at all, typically ~90% were aligned uniquely. We found that for our purposes (expression levels and UCSC Genome Browser tracks) full RNA fragment reconstruction was not necessary, so going forward our data sets comprised just the uniquely mapped single-end reads from ‘end #1’.
The splice-junction target sequences were based on the NCBI RefSeq database for human 37.1 (hg19). For each annotated transcript, we noted all subsets of two or more exons, not necessarily adjacent, that could be spliced together to produce a sequence at least as long as the read length (76 bp). Each of these sequences was then trimmed to the maximum number of bases such that a read mapping to the sequence would have to cross only these ordered exons’ splice junction(s). This procedure produced a library of all unique sets of exons whose intragenic splice junctions could possibly be covered by a read of the given length, based on the RefSeq annotation of exonic loci. Aligned reads thus had the opportunity to align either to genomic (chromosomal) sequences or to exon-junction-crossing sequences found only in mature mRNA. Multiple reads whose 5′ ends were assigned to the same locus on the same strand were not flattened to a single count.
An in-house software tool, MAPtoFeatures37, was used to quantify expression levels for individual genes as follows. A database of genic features (coding sequences (CDSs) and untranslated regions) was constructed from all 29,149 transcripts annotated in RefSeq (human 37.1, 12 March 2009). Merged genes were constructed by combining all exons in all transcripts assigned to each distinct gene; the resulting segments defined the gene’s exonic coordinates used here (with the gaps between them defining introns). Genes with zero CDS exons were labelled ‘noncoding’. These 20,066 genes were supplemented with 1,723 additional noncoding genes specified by the loci of all ribosomal RNA genes obtained from RepeatMasker (where the options Variations and Repeats, rmsk.repFamily = “rRNA” yielded 391 LSU-rRNA_Hsa; 71 SSU-rRNA_Hsa; 1,261 5S). The purpose of this step was to filter out reads stemming from transcription of repeats and rRNA genes, which tend to get populated to inconsistent degrees from sample to sample depending on the variable quality of rRNA depletion.
Reads that aligned uniquely were then queried for their intersection with the exonic ranges of any of the above 21,789 genes, including exon–exon splice junctions. The total number of read bases that overlapped an exonic range in the sense direction was divided by the range’s length to give an average exonic read density (that is, coverage). All reads were assigned to genes or to intergenic regions. However, only those reads not assigned to noncoding genes counted towards the total normalization count N, which ultimately afforded a more stable comparison of expression levels between samples than simply using the total number of reads. All read densities were normalized to a reference total of 10 million reads and a reference read length of 35 bp through multiplication by the factor (107/N) × (35 bp/76 bp). Division of these normalized densities by 0.35 yielded expression levels in alternative units of reads per kilobase of transcript per million mapped reads (RPKM).
Differential expression analyses aimed to produce fold change ratios (between 0 and 1 h or 0 and 6 h time points) and their statistical significance for every expressed gene. For this purpose read counts were preferable to read densities for two reasons: sample-independent parameters such as a gene’s exonic length cancel out of such ratios, and a null model of low read counts would in any case require discrete data. Whole-read counts were monitored for each sample for reads that fell entirely within single exons as well as for those that crossed exon–exon splice-junction boundaries captured by the aforementioned splice library, a not insubstantial fraction (10–30%) of all exonic reads. Relatively few reads (<1–3%) crossed exon–intron boundaries; nevertheless, the exonic fraction of such reads was counted towards a gene’s total ‘fractional read counts’ (frds), rounded up to the nearest integer. Genes were further processed for differential expression between 0 h and 1 h (or 6 h) depolarization only if they passed a minimal read counts filter and an expression level background filter. All five replicates needed to have a total of at least three fractional reads per gene at each time point. Furthermore, the geometric mean density over all non-zero density values (up to five replicates) needed to be at least 0.20 (RPKM ≥ 0.5714) at either 0 h or the later time point. The filtered tables of frds (~12,000 genes over 5 samples per time point) was then taken as input to the R Bioconductor package edgeR38. This tool was appropriate for our samples because it is able to model low counts subject to biological variability via negative binomial distributions. Normalization factors were calculated using the default TMM method; dispersion was estimated ‘tagwise’. In order to control the false discovery rate (FDR), P values were adjusted via the usual Benjamini–Hochberg (BH) procedure39.
RNA-seq was performed on cultured mouse and rat cortical cells from E16.5 C57BL/6 wild-type mice and E17 Long-Evans rats as described7,8. Three biological replicates of mouse and rat cultured neurons were KCl depolarized (see above) for 1 or 6 h at DIV7. Paired-end reads of length 76 bp were sequenced on an Illumina platform and aligned to the mouse genome (GRCm38/mm10 assembly, Dec. 2011) as described above for the human samples. For mouse, the 95,023 transcripts annotated in RefSeq and assigned to 33,102 genes in mm10 were supplemented with 1563 additional rRNA genes from RepeatMasker; a library of splice-junction target sequences was constructed; and normalized RPKM expression levels were assigned to merged genes as described above. Similarly for rat, 58,438 transcripts annotated in RefSeq (RGSC 6.0/rn6, July 2014) and assigned to 28,022 genes were supplemented with 1,641 rRNA genes from RepeatMasker; a splice library was constructed; and normalized RPKM levels were assigned to merged genes.
The RiboTag-Seq experiments were performed as described34,40. Briefly, double-heterozygous mice (Cre/+, RiboTag/+) were reared under a standard light cycle and then housed in constant darkness for two weeks starting from P42; at P56, all mice were either euthanized in the dark (dark-housed condition) or light-exposed for 1, 3, or 7.5 h before being euthanized. Visual cortices were dissected, and immunoprecipitation and purification of ribosome-associated RNA was performed as described34. Visual cortices from three individual animals (each sample contained both male and female animals) were pooled for each biological replicate, and three biological replicates were performed. For all RNA samples of sufficient integrity (RIN >8.0), 5–10 ng RNA was SPIA-amplified with the Ovation RNA Amplification System V2 (NuGEN). For RNA-seq analyses, 2 mg of each amplified cDNA was fragmented to a length of 200–400 bp and used for Seq library preparation using the PrepX DNA kit (IntegenX). The completed libraries were sequenced on an Illumina HiSeq 2000 instrument following the manufacturer’s standard protocols for single-end 50-bp sequencing with single index reads, and reads were mapped to the mouse genome (NCBI37/mm9 assembly, July 2007) using TopHat (v2.0.13) and Bowtie (2.1.0.0).
Data transformation and filters
The scatterplots in Extended Data Fig. 3a, b show expression levels of data for five samples versus five samples, for either 1 h or 6 h post-KCl-stimulation versus unstimulated (0 h). At each time point the five data sets were log-transformed and quantile normalized, with only non-zero data included. Each point shown in the figures represents a gene with at least one non-zero value at each of the two time points; at each time point error bars show ± 1 s.e. over log10 expression levels while their crossing point lies at the two-dimensional mean of the gene’s log10 values (that is, at the geometric mean).
The log of the ratio of mean values (fold-change) is proportional to the distance from the main diagonal. Off-diagonal grey lines mark up or down ratios of 10 and 100. Genes with the most unusual fold-changes were filtered by magnitude, significance, and comparison to background expression levels. A background threshold was chosen at the density value 0.20 (that is, RPKM = 0.20/0.35 = 0.5714 ≡ B). Those genes with a mean density exceeding this threshold at either 0 h or the later time point were submitted to the R package edgeR, as described above, for evaluation of the signficance of their differential expression, including BH-adjusted P values to control FDR. Highlighted points have adjusted P consistent with an FDR threshold 15% or less and fold changes either ≥ 2.0 or ≤ 0.5. For 1 h versus 0 h, 9 of 17,323 genes shown passed all these filters (all upregulated); for 6 h vs. 0 h, 185 of 17,224 did (73 upregulated, 112 downregulated). The highest fold-change of 102.9× was ascribed to OSTN at 6 h of membrane depolarization; the greatest change at 1 h was 47.1× for NPAS4. Supplementary Table 1 contains the lists for early-response genes (ERGs) and late-response genes (LRGs). We categorized a gene as an ERG if the edgeR calculated fold-change (FC) at 1 h was greater than the FC at 6 h. If a gene had a greater FC at 6 h, it was categorized as an LRG. Note that fold changes inferred from Extended Data Fig. 3a, b, based on mean expression levels, may differ slightly from the fold change values cited here, which are taken from Supplementary Tables 1 and 4 and are instead based on read counts and their normalization as calculated by edgeR.
The quantile distribution for the five unstimulated samples is plotted in Extended Data Fig. 2a against log10-expression level (RPKM units) with a colour scale for the heatmaps.
Spearman correlation heat map and panel of human tissues
Spearman correlations (rS) in Extended Data Fig. 1f were calculated using gene expression levels from our five unstimulated hFBC replicates (H1–5). Only those 11,711 RefSeq genes that were annotated in hg19 as coding genes and that had non-zero expression levels in all samples were included in this calculation. The dendogram in Extended Data Fig. 1g was based on the hierarchical clustering of the expression levels of these five samples plus ten previously sequenced human tissues37 (GEO accession number GSE48889), including whole brain, with distance measure 1–rS. In order to emphasize informative genes for this comparison, a subset of ~ 3,000 coding genes was identified that had non-zero expression in at least 5 of the 10 tissues and could be loosely classified as expression outliers in any one of the 10 tissues (Grubbs’s test, α = 0.10, Bonferroni adjusted). The displayed horizontal ordering minimizes the total of the distance measures between adjacent samples. Brain clusters with H1–H5 while correlations among the remaining tissues are unstructured.
BrainSpan data
Expression levels from the publicly available BrainSpan atlas (http://www.brainspan.org/) are derived from RNA-seq for 22,327 genes and 578 human samples, including 41 individuals, 30 different ages ranging from embryonic to adulthood and 26 specific brain regions. The data shown for OSTN and BDNF in Extended Data Fig. 6a–f cover five separate regions: amygdalaloid complex, AMY; cerebellar cortex, CBC; hippocampus, HIP; mediodorsal nucleus of thalamus, MD; and striatum, STR. We further combined the data for 11 cortical regions under ‘Neocortex’ (NCX): primary auditory cortex (core), A1C; dorsolateral prefrontal cortex, DFC; posteroventral (inferior) parietal cortex, IPC; inferolateral temporal cortex, ITC; primary motor cortex, M1C; anterior (rostral) cingulate (medial prefrontal) cortex, MFC; orbital frontal cortex, OFC; primary somatosensory cortex, S1C; posterior (caudal) superior temporal cortex, STC; primary visual cortex (striate cortex), V1C; and ventrolateral prefrontal cortex, VFC. OSTN expression data from these neocortical regions were also grouped into four anatomical categories and displayed in Extended Data Fig. 6g. For each gene, data for all samples at all available time points in each brain region were fit via a local polynomal regression (the Loess function in R version 3.0.2) and shown as mean Loess curves interpolated across the whole Age range. The width of the one-standard-error side bands shown in Extended Data Fig. 6a–g were similarly calculated via a Loess fit to the standard errors deduced at whatever ages data were available in each region for each gene.
Quantitative PCR
Total RNA was isolated from human and mouse neuronal cultures using Trizol. Isolated RNA was treated with Amplification Grade DNaseI (Invitrogen), and cDNA libraries were synthesized using a High Capacity cDNA Reverse Transcription Kit (Applied Biosystems). The cDNA was the source of input for quantitative RT–PCR, using a Step One Plus Real-Time PCR Instrument and SYBR Green reagents (Applied Biosystems). The relative expression plot was constructed using concentration values that were normalized to corresponding GAPDH concentrations. The following primer sets were used for qPCR experiments: Human OSTN F-5′-CAGGAAAAGTCCTCTCAGTAGATG-3′, R-5′-GCAAGAGTTTTGCTGTCAGGTCA-3′; Mouse Ostn F-5′-CCATGGATCGGATTGGTAGA-3′, R-5′-GCCATCTCACACAAGTAAGTCG-3′; Human NPAS4 F-5′-TGGGTTTACTGATGAGTTGCAT-3′, R-5′-TCCCCTCCACTTCCATCTT-3′; Human GAPDH F-5′- GTCTCCTCTGACTTCAACAGCG-3′, R-5′- ACCACCCTGTTGCTGTAGCCAA-3′; Mouse Gapdh F-5′-CATCACTGCCACCCAGAAGACTG-3′, R-5′-ATGCCAGTGAGCTTCCCGTTCAG-3′; Human MEF2C F-5′-TCCACCAGGCAGCAAGAATACG-3′, R-5′- GGAGTTGCTACGGAAACCACTG-3′; Human BDNF_IV F-5′-GCTGCCTTGATGGTTACTTTG-3′, R-5′-AAGGATGGTCATCACTCTTCTCA-3′.
Fluorescence in situ hybridization
FISH detection of transcripts was performed by RNAscope assay (Advanced Cell Diagnostics) per the manufacturer’s instructions. Target probes were either custom-synthesized or purchased from the available probe catalogue. Manufacturer’s standard single red chromogenic/fluorescent (with the Fast Red fluorescent label) or multiplex fluorescent protocols were used for cultured human cells and fresh frozen human and macaque sections. Coverslips or sections were mounted with DAPI Fluoromount-G (Southern Biotech) for the visualization of nuclei. For negative controls, the probe against the bacterial gene dihydrodipicolinate reductase (dapB) was used, and no signal was detected in any of the experiments.
Immunostaining and antibodies
Neuronal cultures grown on glass coverslips were fixed with a solution of 4% paraformaldehyde and 4% sucrose in 1× PBS pH 7.4 for 8 min at 27 °C, blocked for 1 h at 4 °C with 0.1% (w/v) gelatin and 0.3% (v/v) Triton X-100 in 1× PBS pH 7.4 (GDB), and incubated overnight at 4 °C with the following primary antibodies diluted in GDB: anti-GFP (rabbit, 1:500, Life Technologies, A21311), anti-MAP2 (chicken, 1:1,000, Lifespan Biosciences, LS-C61805) and anti-MAP2 (chicken, 1:1,000, Abcam AB5392), anti-GFAP (rabbit, 1:500, Dako, Z033429-2), anti-SATB2 (mouse, 1:500, Abcam AB51502), anti-CTIP2 (rat, 1:300, Abcam, AB18465), anti-TBR1 (rabbit, 1:300, Abcam, AB31940). The OSTN antibody (rabbit, 1:500) was raised against a C-terminal region of OSTN (NP_937827.1, amino acids 112–127, PKRRFGIPMDRIGRNR), then affinity-purified. All secondary antibodies were AlexaFluor-conjugated (Life Technologies). Coverslips were mounted with DAPI Fluoromount G (SouthernBiotech).
Imaging and image quantification
In situ and immunofluorescence experiments were imaged on either an AxioVision Imager Z1 or an LSM 5 Pascal (Zeiss). The individual GFP-positive neurons used for Sholl analyses were selected and imaged using an LSM 5 Pascal with a 40× objective in a blinded manner. The neurons were traced using an ImageJ (NIH) plugin NeuronJ41, and Sholl analysis was performed by a blinded investigator using Sholl tool of Fiji42, quantifying the number of dendritic intersections at 10-μm intervals from the cell body.
hFBC transfections, chronic activity paradigm (CAP) and siRNA treatments
The –2kbhOSTN:GFP construct was transfected into DIV15 hFBCs using Lipofectamine 2000 reagent (Invitrogen) per the manufacturer’s instructions. For RNA knockdown, we used a pool of four synthetic chemically modified ACCELL siRNAs (GE Dharmacon) to target OSTN and MEF2C. The pooled siRNAs, including a control pool consisting of scrambled sequences, were added to the medium for the last 3 days of culture (DIV27–DIV30, final concentration 1 μM) along with 20 mM KCl CAP treatment. The following siRNAs were used in the experiments: scrambled siRNA pool, UGGUUUACAUGUCGACUAA, UGGUUUACAUGUUUUCUGA, UGGUUUACAUGUUUUCCUA, UGGUUUACAUGUUGUGUGA; OSTN siRNA#1 pool, CUGUAGAUCACAAAGGUAA, GCUUCUUGAUGAUGAAUUGGUG, GGAUCGGAUUGGUAGAAAC, CCUUUGAUUCUGGAGUCAU; OSTN siRNA#2 pool, ACAGCAAUAUGGAAGA, GCCUUCUGUAUGGAUU, UCUUUGGCUUCAAUUG, CUCAGGAGUUGAAAGA; MEF2C siRNA pool, GGAUUAUGGAUGAACGUAA, CUCUUGUCUAAUAUUCGUC, GCACUAGCACUCAUUUAUC, CUGCCUUGUACUAAUGUUU.
DNA constructs
The 2-kb cis-regulatory regions directly upstream of the human OSTN (hg19 chr3:190,914,914–190,917,032) and mouse Ostn (mm10 chr16:27,305,609–27,307,640) transcription start sites were PCR amplified from genomic DNA using primers that incorporated SacI (5′) and XhoI (3′) nuclease recognition sequences. Luciferase constructs were cloned using the Firefly luciferase reporter plasmid pGL4.11 (Promega), which was linearized using SacI–XhoI digestion and then ligated with the mouse or human amplified DNA sequences. Further mutagenesis of pGL4.11 –2kbhOSTN was performed using gBLOCKS (IDT) and Gibson Assembly Master Mix (New England Biolabs). The –2kbhOSTN:GFP reporter construct was generated by cloning –2kbhOSTN into pGL4.10[GFP] using SacI and XhoI restriction sites. pCAG-GFP (Addgene #11150) was used as a backbone for cloning the OSTN overexpression construct. pCAG-GFP was digested with the restriction enzymes EcoRI and PstI, while the PCR amplicon corresponding to the ‘full-length’ OSTN cDNA was cloned with EcoRI and SbfI. The predominant OSTN transcriptional variant sequence was determined by RNA-seq and 3′RACE analyses from depolarized hFBCs. The full-length OSTN cDNA is 3,219 bp long and consists of 5 exons. The first exon corresponds to the 5′UTR, the second exon starts with the initiation codon ATG (bold) and the last exon corresponds to the 3′UTR. The full-length OSTN cDNA is as follows (alternating exons are underlined): AGGGCTGAGTTTTGGAGAAACTGCAGAGACAGTACTCTAAAGTTAGAATCTCCTGATCTTTCACGAGATGCTGGACTGGAGATTGGCAAGTGCACATTTCATCCTGGCTGTGACACTGACACTGTGGAGCTCAGGAAAAGTCCTCTCAGTAGATGTAACAACAACAGAGGCCTTTGATTCTGGAGTCATAGATGTGCAGTCAACACCCACAGTCAGGGAAGAGAAATCAGCCACTGACCTGACAGCAAAACTCTTGCTTCTTGATGAATTGGTGTCCCTAGAAAATGATGTGATTGAGACAAAGAAGAAAAGGAGTTTCTCTGGTTTTGGGTCTCCCCTTGACAGACTCTCAGCTGGCTCTGTAGATCACAAAGGTAAACAGAGGAAAGTAGTAGATCATCCAAAAAGGCGATTTGGTATCCCCATGGATCGGATTGGTAGAAACCGGCTTTCAAATTCCAGAGGCTAAATGCAACTTCCTTGGGTGAAATGTCACAGCAATATGGAAGATGCTTCACTGAAGTTATTCACACTTCTTAATGATTAAACTTTTAAGGAACTGACCTTCTGCAAATCCTTTCCAAAGCTTGAACTTCAGTCCATCACATTACAGCATTGTTACAGCTTCAATTAAATTGTGTAAATCATTTTGATGCACGTACATTTTAAAATTATATATTTTAATTATTCAAGAATGGTTAACTTCCCCTTAAACCTTACTTTTAAAAATAATAATTAAATACACAATACAGTGAAATGCCTTCTGTATGGATTTACCATGCACATGTTTGTAGTCAAAGAATAATAACAAAAGACAGATTTGCTTCTGTAAAATTTAGTTATAATCTGTCCATTATTGGGGAATGAGGAAAGGCAATGCTGTGTATTTTCTGTTGAGTACTTTCACTTCCCTGTATTCCATTTTTCCAAGAGTCTGATCGGTAATAATTATGAAATTAGGCTTCTCTTTTCATATTCAAGTTTCAGTCATGTTCAGAAAAATAAAACACAGCCCCAATGAGCCTATTGACTTAGAATTAAGAAAGTGAAGGACATTACTCATTTGTCAAACTTAGATATCACTTGTCCCCTAAAAACTTTCCATTTTTCTAAATTCTGACAGTTAAGAGCAGTAGTGTCTCATTAGGAGGGGAGTAAGCTCACACAGAGGTAAAAATGAAAGTAGGAGGGAAGTCAAAGAATTACCACCAGAACAGGTTAGGACCAGCTAAGCACACATCATTTTAGCTCAGTACACTTCAGCATAGTACAATGTGATCTTTTTGATATCTTGGATTAATCTAAGAAACTGTTTACTGTGTTTCACATATTGGCTTCTTTGGCTTCAATTGTCTTATTATCCTTAGTAAGCCAATTGAAGAGCATAATGATTTTGAGAATGATTTCTTAAAAATCATTCAGATTATTTTTGAATGACTTATTAAAACATAAGTTTTCGTATTGTAGAAAACTCAGTTCTCAGTAATAACTATGATGTTACTGTAGCTTGGACACATAGGTCCATTGTGCATTGGATATACTTTGAAAACACACAAAAAAAACTTTCTATGGAACAGAGATTCATCATAAGTTACTTAGCAGAAGTTTATAAAGCATCGAAAAACACTTCCTCTGTAAACCCTAAAAATCACTGTCTGATACGTGGGAGGAAAAAAGTTTTGTCCAGTAGAGCAAAGGCTTATTTCAGCATAAAAAGAGAGTGTTGTGAGTTGTGAGAAGGTGTCTTAATTTTAAAGGAAGAGGAGAGAAATGGGCAATTGCTAATCTTAACTAAAAATTAATGGACTTGTATGATCCAAAGAATAAAATAAACTCAAAGAAACATAACAAAAATATATTAGAAAAAGAGTTAAACTAAGAAATTGACCTTTATGAAGGACTAATTTTTCAGTTATCCAATGTGCTTTTTAAAGATAAAGTTTAAAAGAGGCAAAAAGAGGTGAAAGAAATGAACATGTGTACTTAGAATATATATATTGGTTTTGTATGTAACTTCTTAGTTTTTCTGGATATTTTTAAAATTGAAAGTCTTCAAAATTAATTTAGGAAAAATAGTAAATAATTTTTTTTCATTGTAGTAGAGGGCTGTAGCCAAGAGAAGTGAATTTTGGGAAATCTAACCAATTCTTTTTTTCATAAACTTGTGTTAGAAAGCTAGCAATAGCACATAGGGAAGTATCCTGGAGGACTCAGGAGTTGAAAGAATTATTTAAGAAGTTGTGATATCCTTGTCTGCCTTTCCCCAACCTTGTGATGAACTATAGAAATGTTTCCTATTGCTTAGAAGCTCTTTCTTTCCTTGTATGCACATTTGGGTATTTGTAAGCTTCTAATCCAATTGGGTTCTGCTTCATGCTTTGACAAAAGGTATTAAAACCTACTTTAGCCTAAAACTTTCTCATGGTAAATATTGGAAGTTGGATTATGCAAATTGATTTCCTCCATTCTTTATTTTTTAATTCAAAATTAGACTATGACATCCAACTTAATTAAAATAAGAAGTCACAATATAGTGATTTATGCTATAGTTTCATGTGTAATGTATTTTCACCTAATATACACACAATTTCCATGAAGGGAAGAAAATGTTTTCTCCACTTATAACTCTATTTTATTTCATATTTTAATTTTTACCACTACTTCATTCAGAGTAGAAAATAAGTCAGCAATATACTAAATAATGGGGCTATTCTTTTAACATAGCAGTAAATTAAGACAGAATTTTTGTTAAGAATATGACAAGTCATCTCACTTATTTATCCAATGCATTAGGTATTACTAATCCAACTATATTTCAACTTGAAGGGACTTTTTTGTTTTGTTTCAAAATAATGCATTACTTTTTTCTCTTTGCTTCTGTATGAACCTTTATAGAGCAAATGAATATATGTATATGGAGTTCTGGGTTCTAGTGTCAATTACATAATCAAATTTCATAAAAGGATGTTAGTTACTGGCTATGTTGTCCTAAAATTTACACACACTAAAAAATGTCTGTCAAGTTGTACCTTTAACCTGTTCATAGCTTTAGGGAATTAAGTTTCTTAAACCAAATTATGAAAAAATAACTTAATGGAATCTTCTAAAAGGAAAAAGTATAAAAAGCTTTCTGAATGATATTACCCCTTATACCTAAAGGCTCAAGATGCTTGAATATGGTTCAACTTTTCCAAAGTTAATAAACAAGGGATGATGAAA. Further construct sequences are available upon request.
hiPSC differentiation to excitatory cortical neurons
Previously characterized healthy control hiPSC lines 20b and 18a43 were maintained in mTEsR medium (StemCell Technolgies) on hESC-qualified matrigel (Corning)-coated tissue culture plates and passaged using Dispase (1 mg/ml, Life Technologies). Cell lines were mycoplasma-negative by PCR (LookOut Mycoplasma PCR Detection Kit, Sigma). HiPSCs were differentiated into dorsal telencephalic neural progenitors using a previously published protocol44 without inducing sonic hedgehog signalling (no SHH, see Extended Data Fig. 5). After 18 days, cultures were enzymatically dissociated to single cells using Accutase (StemPro Accutase, Life Technologies) and were replated on Growth Factor Reduced matrigel (1:30, Corning) at 10,000 cells/cm2 in human neurobasal (hNB) medium supplemented with 10 μM ROCK inhibitor (Y27632, Tocris). hNB media was replaced 24 h later and supplemented every 2–3 days thereafter. Dissociation and replating (100,000 cells/cm2) was repeated at day 40. Cultures were silenced on day 81 and then KCl-depolarized (see above) and harvested on day 82. hNB medium: neurobasal medium (no glutamine), with 1× penicillin/streptomycin, 1× GlutaMax, 1× MEM non-essential amino acids, 1× B27-supplement without vitamin A (all Life Technologies), 1× N2-B supplement (StemCell Technologies), 1 μM ascorbic acid (Sigma), 20 ng/ml rhBDNF and 10 ng/ml rhGDNF (Peprotech).
Luciferase assays
Luciferase assays were performed using the Dual-Luciferase Reporter Assay System (Promega), and all constructs generated in this study were cloned using pGL4.11[Fluc] (firefly luciferase reporter construct – Fluc) and co-transfected with pGL4.74[Ren] (Renilla luciferase expression construct) as an internal transfection control. E16.5 C57BL/6 mouse embryonic cortical cultures were dissected and cultured as previously described45. Briefly, E16 mouse cortices were dissected, dissociated using a 1:100 dilution of papain suspension (Worthington, LS003126), rinsed with a 0.6% (w/v) solution of Ovomucoid Trypsin Inhibitor (Worthington) and BSA (Sigma) in HBSS and triturated briefly to dissociate cells, and single cells were plated at 150,000 cells/cm2 on poly-L-ornithine- (Sigma) and laminin (Life Technologies)-coated tissue culture plates in mouse neurobasal (mNB) medium. mNB medium: neurobasal medium (no glutamine), with 1× penicillin/streptomycin, 1× GlutaMax, 1× B27 supplement (all Life Technologies). At DIV5, control and experimental plasmids were transfected into the cultured cells using Lipofectamine 2000 (Life Technologies) following the manufacturer’s protocols. On DIV6 cultures were silenced, and on DIV7 cultures were KCl-depolarized (see above) for 6 h before washing once with cold 1× PBS and collecting cells in lysis buffer. For luciferase assays, hFBCs were transfected with plasmids on DIV25, silenced/treated on DIV27, and stimulated and harvested on DIV28. Protein lysates were analysed using Promega reagents according to Assay System instructions on a BioTek synergy 4 microplate reader, Gen5 1.11. Firefly luciferase activity readings were normalized for each experimental replicate using the Renilla luciferase activity reading from the same sample: Fluc/Ren. Two or three normalized Fluc values (experimental replicates) were averaged for each biological replicate value. The average normalized Fluc value of each condition treated with KCl was divided by the average normalized Fluc value of that same condition left untreated to obtain the fold-induction of the Fluc reporter for each condition in each biological replicate: avg. +KCl/avg. –KCl. Statistics were performed using a one-way ANOVA and Holm–Sidak test for multiple pair-wise comparisons. For CsA/FK506 treatment comparisons to DMSO treated controls, a one-way unpaired Student’s t-test was applied. All constructs were tested from at least two independent plasmid preparations. Control plasmids used: ‘3xMRE’ (generously contributed by the Eric Olson Laboratory) and ‘3xMREmut’, mutated to inactivate the MRE sites as previously described18.
Drug treatments
Calcineurin activity was inhibited by addition of DMSO solutions of cyclosporin A (10 mM) and FK506 monohydrate (1 mM) (both Sigma) at 10,000× dilutions in NB medium, for final concentrations of 1 μM and 0.1 μM in the culture medium, respectively. DMSO was used as the vehicle control. Cultures were treated at the same time as silencing treatment and were incubated for 18–20 h before KCl depolarization (see above).
Monocular inactivation assay
All procedures conformed to USDA and NIH guidelines and were approved by the Harvard Medical School Institutional Animal Care and Use Committee. Owing to the robust nature of this assay and scarcity of these specimens, we performed this experiment on two animals. One eye of each of the two adult male macaques (monkeys #1 and #2) was inactivated for 22 h by TTX injection as follows: the animal was anaesthetized with 10 mg/kg ketamine. Then 10 μl of sterile TTX solution (Tocris, 4.7 mM in sterile saline) was microinjected at a rate of 1 μl/min into the vitreous of the right eyeball using a sterilized Hamilton 0.5 inch 30 gauge 10 μl microsyringe inserted through the sclera and controlled by an automated syringe pump. The microsyringe was kept in place for an additional 5 min to allow the pressure to equalize before retraction. The pupil of the injected eye dilated after the injection, indicating appropriate TTX delivery. The animal was immediately brought back to its home cage, allowed to recover from anaesthesia, and monitored post-operatively. On the following day, to maximize visualization of possible OSTN transcripts, 6 h after the beginning of the facility’s normal light cycle (22 h after the TTX injection) the animal was anaesthetized with 15 mg/kg ketamine i.m. and then given a lethal dose of euthasol (pentobarbital + phenytoin) i.v. Immediately after death, brain tissue was removed and frozen on dry ice for cryosectioning into 15–25-μm slices.
Human brain sections
The human fetal tissue used for in situ hybridization was acquired from the laboratory of N. Sestan at Yale University. Tissue was fixed using TissueTek VIP fixative for 24 h, then cryoprotected by immersing it in first 15%, then 20%, and finally 30% sucrose in RNase-free PBS at 4 °C. Samples were kept in each sucrose solution until completely equilibrated, when they sank to the bottom of the incubating vessel. Following cryoprotection, tissue was frozen using isopentane and dry ice. Frozen tissue was cut by cryostat into 12-μm slices.
ChIPseq of human neurons
The ChIP assay in Fig. 2e and Extended Data Fig. 7d was performed as described17 using hFBCs at DIV21 and mouse cortical cultures at DIV7 under CAP conditions. H3K27Ac (Abcam ab4729), pan-MEF2 (Santa Cruz Biotechnology (C-21) sc-313) and MEF2C (Proteintech 18290-1-AP) antibodies were used.
Extended Data
Extended Data Figure 1. hFBCs are mixed neuronal cultures that show high reproducibility.
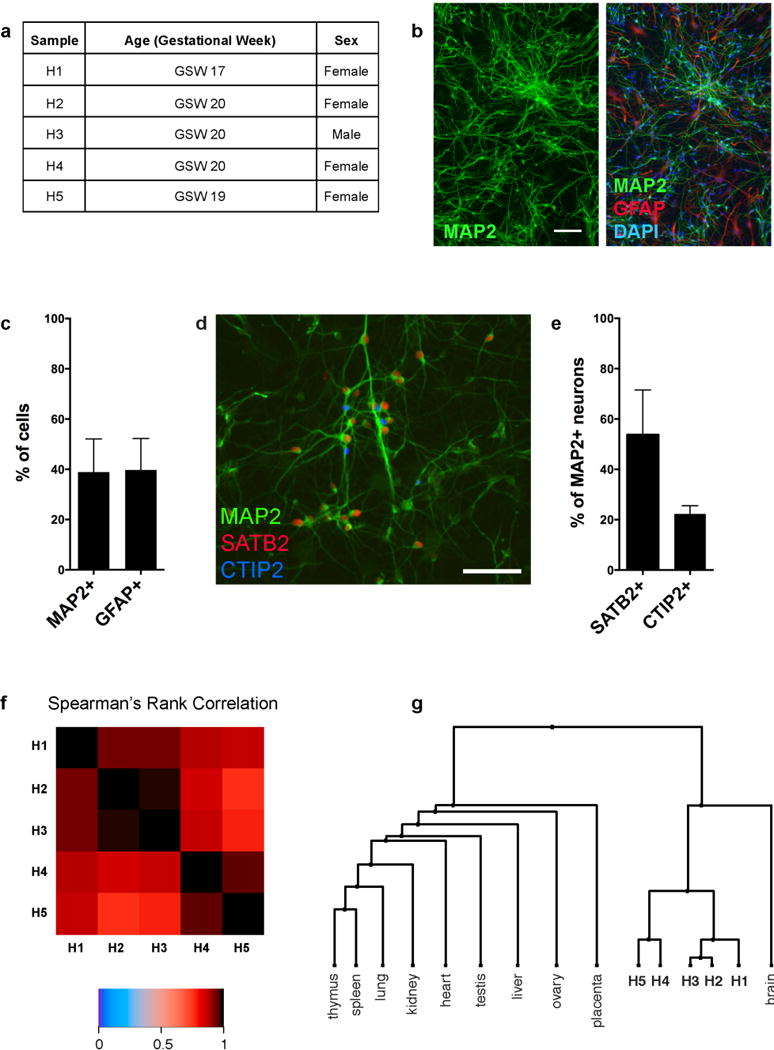
a, Gestational week and sex of hFBC samples used in profiling of activity-dependent gene expression. b, Representative images of DIV6 hFBC neurons immunostained with the neuronal marker MAP2 alone or together with the glial marker GFAP and DAPI nuclear dye. Scale bar, 75 μm. c, Quantification of MAP2- and GFAP-positive cells in hFBCs. Mean ± s.d. from three independent cultures shown. d, Representative image of hFBC neurons immunostained with MAP2 (green), SATB2 (red) and CTIP2 (blue). Scale bar, 57 μm. e, Quantification of the SATB2- and CTIP-immunoreactive subpopulations of MAP2-positive hFBC neurons. Mean ± s.d. from three independent cultures shown. f, Heatmap showing the Spearman correlation rS of coding gene expression profiles among five biological hFBC replicates (H1–5) (unstimulated neurons). g, Dendrogram of correlations among the gene expression profiles of hFBC replicates (H1–H5) and 10 human tissues, including whole brain37, based on hierarchical clustering with distance measure 1 – rS.
Extended Data Figure 2. hFBCs are mixed neuronal cultures with a substantial representation of cortical neuronal subtypes.
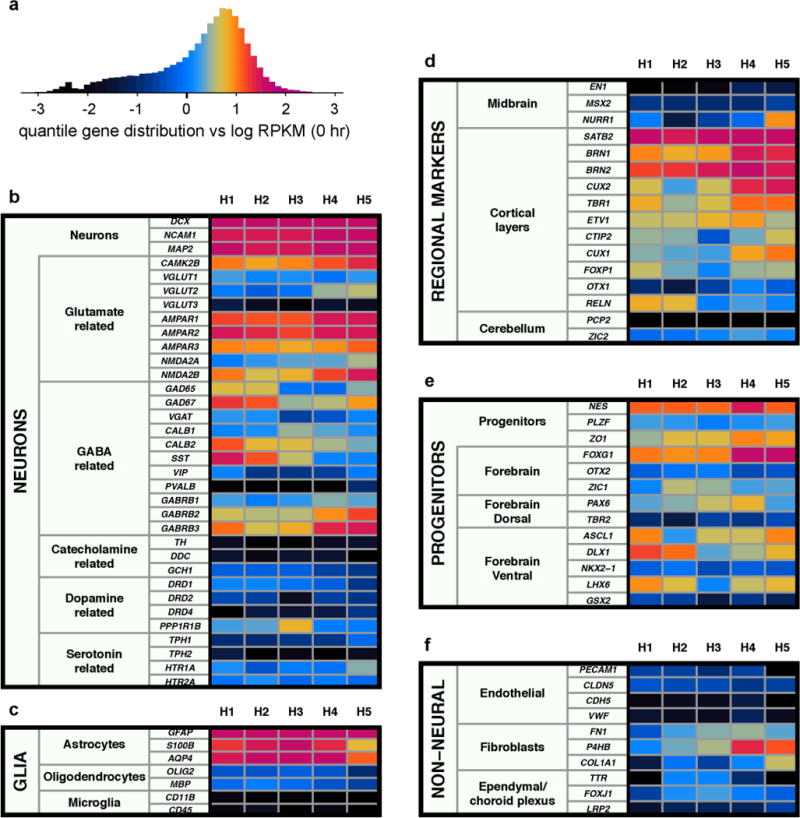
a, Quantile distribution constructed from combined log-gene expression levels of five unstimulated hFBC samples, with associated colour scale (see Methods). b–e, Expression of selected marker genes classified by neuronal subtype (b), glial cell type (c), brain region (d), neural progenitor cell type (e), and non-neural cell type (f).
Extended Data Figure 3. RNA-seq profiling of activity-dependent gene expression in human neuronal cultures.
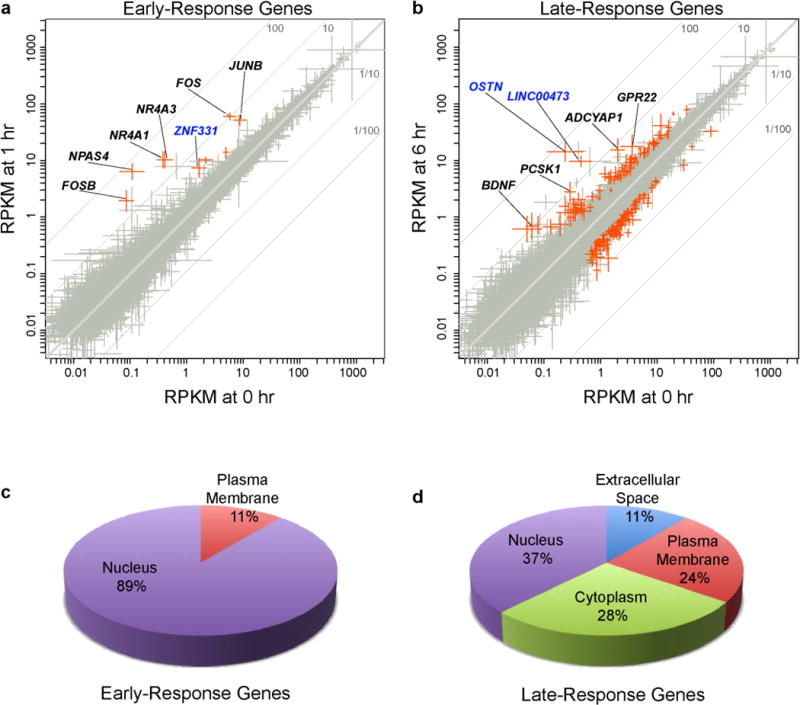
a, b, RNA-seq analysis of membrane depolarization-induced hFBC gene expression changes after 1 h (a) or 6 h (b). Scatterplots depict the geometric mean of genes’ non-zero expression values ± s.e.m. from five independent hFBC cultures. Fold change is proportional to distance from the diagonal. Genes passing filters for expression and significant activity-dependent changes are highlighted in red (BH-corrected P values controlled for FDR ≤ 0.15 based on a negative binomial model38, magnitude of change (ratio ≥ 2.0 or ≤ 0.5), and above-background expression (RPKM > 0.57) on either axis, total reads ≥ 3 per time point). Selected genes exhibiting activity-regulated expression in human neurons but not in mouse neurons are indicated in blue. c, d, Pie charts showing the predicted subcellular localization of hFBC activity-responsive gene products induced following 1 h (c) or 6 h (d) KCl treatment. Analysis was performed using Ingenuity and GeneCards databases.
Extended Data Figure 4. Ostn is neither expressed nor activity-regulated in mouse cortical neurons in vitro and in vivo.
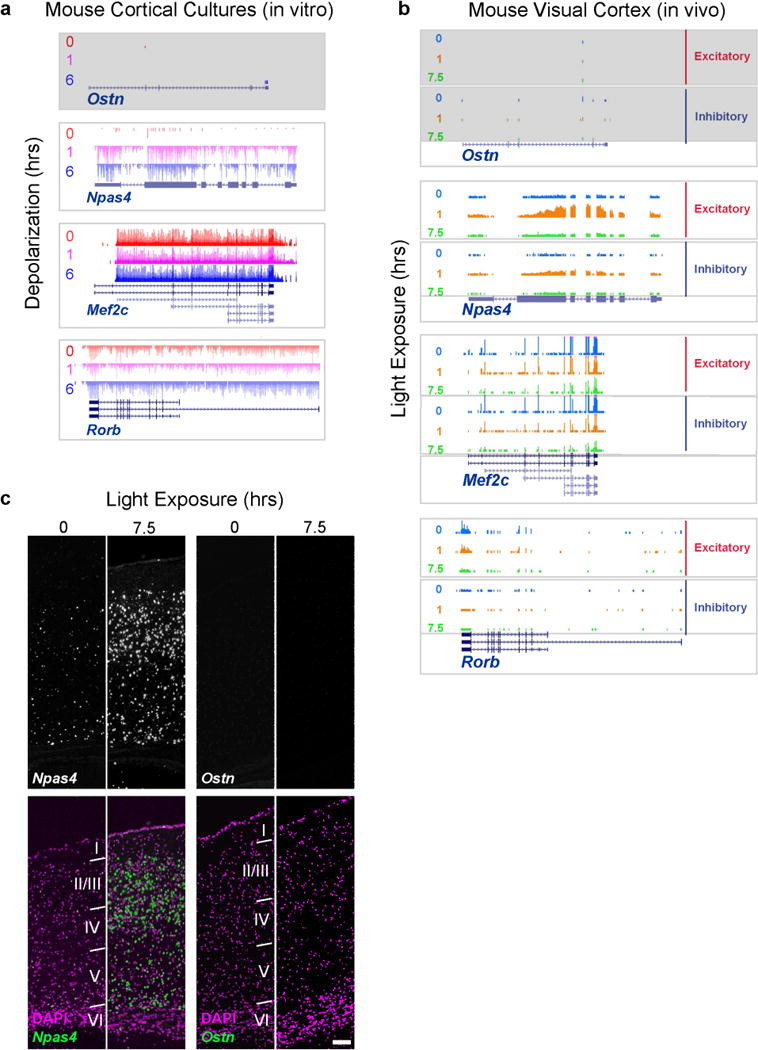
a, UCSC genome browser tracks for RNA-seq data from DIV7 cultured mouse cortical neurons depolarized for 0, 1 or 6 h with 55 mM KCl. The Ostn locus (grey) shows neither basal expression nor activity-dependent induction. The known activity-regulated gene Npas4 shows clear activity-dependent induction at 1 and 6 h. Finally, the cortex-enriched transcription factor Mef2C and the layer IV marker RorB show no significant expression changes in response to depolarization. b, UCSC genome browser tracks for RNA-seq data from visual cortices of dark-adapted (P42–P56) mice that were exposed to light for 0, 1, and 7.5 h. RNAs from excitatory and inhibitory neurons were isolated through the expression of a RiboTag transgene using Emx and Gad2 Cre-lines, respectively34. The Ostn (grey), Npas4, Mef2C and RorB loci show similar responses as in a. All genome browser tracks y-axis min = 0 and max = 10. c, FISH images of radial sections from primary visual cortex of dark-adapted (P42–P56) mice exposed to light for 0 and 7.5 h. Upper panels, grey-scale images of Npas4 (left) and Ostn (right) probes. Lower panels, green-coloured images from upper panels, with nuclei marked with DAPI (magenta). Scale bar, 110 μm; cortical layers I–VI are indicated.
Extended Data Figure 5. Differentiation and characterization of human iPSC-derived cortical neurons.
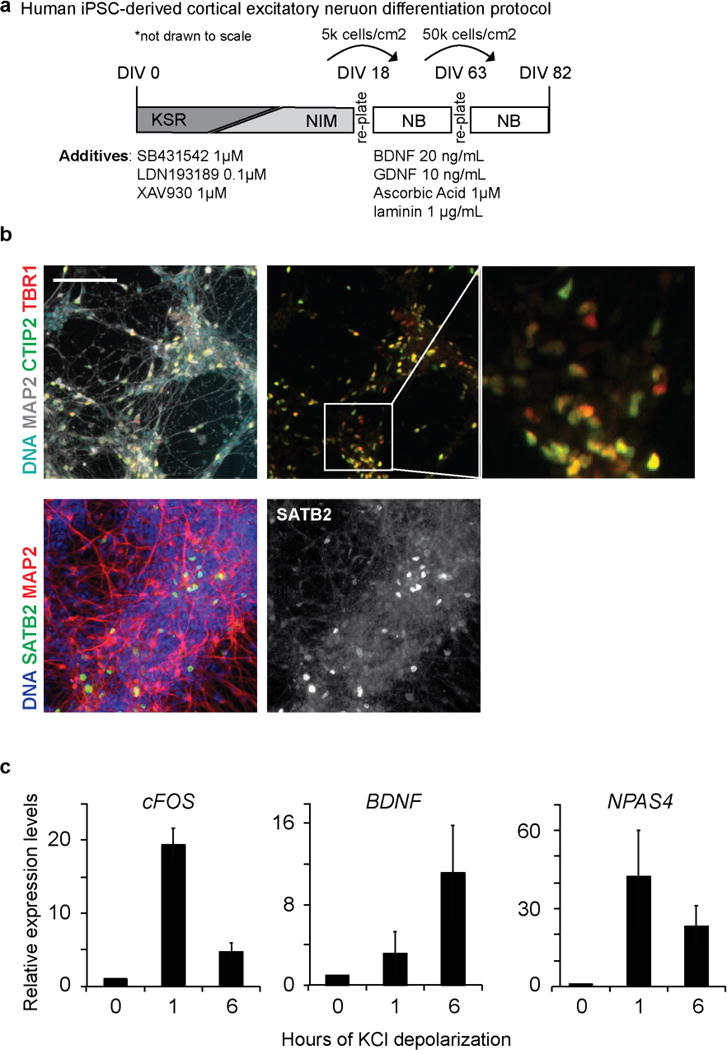
a, Schematic of the iPSC cortical neuron differentiation protocol44 (see Methods). b, Immunostaining of DIV82 iPSC-derived neurons shows expression of cortical layer markers TBR1 (layer VI), CTIP2 (layer V), and SATB2 (layers II–IV). c, Quantitative RT–PCR analysis of known activity-dependent genes from DIV82 iPSC-derived neurons 0, 1, and 6 h after membrane depolarization with 55 mM KCl. Data shown as mean ± s.e.m. from two independent iPSC lines. Scale bar, 100 μm.
Extended Data Figure 6. OSTN is primarily expressed in the neocortex of human brain.
BrainSpan (http://www.brainspan.org) RNA-seq data showing expression levels of OSTN (red) and BDNF (grey) in 6 human brain regions (a–f; neocortex, hippocampus (HIP), amygdala (AMY), striatum (STR), mediodorsal nucleus of the thalamus (MD), and cerebellar cortex (CBC)) and OSTN in subregions of the human cortex from 8 pcw through 40 years old (g). Loess-fit curves depict mean expression with bands showing one s.e.m. h, FISH images showing OSTN expression in a radial section of human fetal brain (pcw16) illustrating selective enrichment of OSTN in the developing cortical plate of the paracentral lobule. Isolated OSTN signal also appears to be localized to migrating neurons (arrowheads) of the subplate. Scale bar, 200 μm. MZ, marginal zone; CP, cortical plate; SP, subplate; IZ, intermediate zone; SVZ, subventricular zone; VZ, ventricular zone.
Extended Data Figure 7. Luciferase and ChIP assays in human and mouse neurons.
Direct comparison of the ability of the human and mouse –2kb regulatory sequences to drive reporter expression in mouse (a; n = 8) and human (b; n = 3) neuronal cultures in response to KCl depolarization. n = number of biological replicates. Mean normalized firefly luciferase activity (Fluc/Ren) ± s.e.m., Student’s t-test, ns = not significant, *P < 0.05, **P < 0.01, ***P < 0.001. c, Luciferase assays performed in mouse neurons in the presence of calcineurin inhibitors (CsA and FK506, red) or vehicle (DMSO, black), Student’s t-test, *P < 0.05. d, ChIP–seq using a pan-MEF2 antibody (purple), an MEF2C-specific antibody (fuschia), and an antibody specific for H3K27ac (green) in hFBCs (left) and mouse cortical neuron cultures (right) shows enrichment for MEF2 binding at the known MEF2-regulated gene Nr4a1 (also known as Nur77). Y-axis scales here and in Fig. 2e were adjusted for each experiment to normalize for variability in ChIP efficiency between these two different culture systems. We chose scales by setting MEF2 and H3K27ac enrichment to approximately equal levels at this positive-control locus, yielding all human tracks at max 10, mouse pan-Mef2, Mef2c, and input tracks at max 20, and mouse active chromatin (H3K27ac) at max 50. e, UCSC genome browser tracks for RNA-seq, ChIP–seq and vertebrate evolutionary conservation at the mouse Ostn locus, shaded yellow. RNA-seq tracks show no Ostn expression or induction in DIV7 mouse cortical neuron cultures following KCl depolarization (0, 1 and 6 h). ChIP–seq tracks45 show H3K27ac peaks that mark active cis-regulatory regions at two time points: 0 h and 2 h after KCl depolarization. The nearby genes Uts2b and Ccdc50 are also shown for comparison. No active cis-regulatory sites were found surrounding the Ostn locus. H3K27ac tracks are shown with max 5 and RNA-seq tracks with max 10.
Extended Data Figure 8. Luciferase reporter constructs and the complete set of assays.
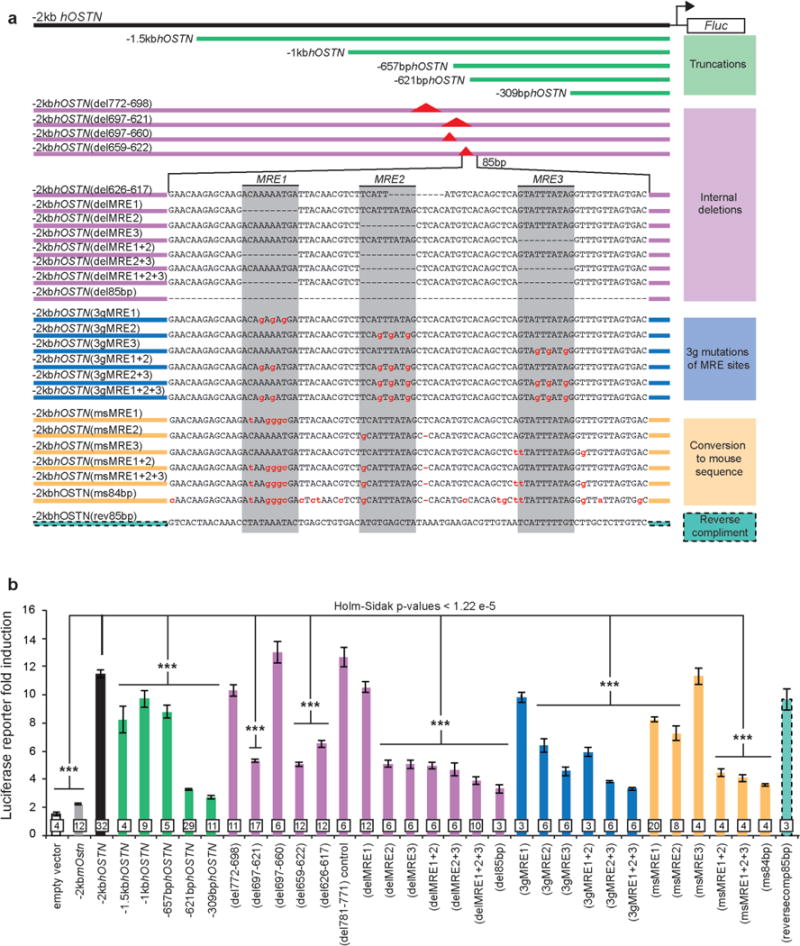
a, Detailed summary of all luciferase assay reporter construct variants of the human genomic sequence –2 kb upstream of the OSTN transcription start site. b, Summary of all luciferase assays performed in mouse cortical cultures. Categories of construct modifications are indicated and grouped by colour. Biological replicate numbers are indicated on the graph. Significant differences tested for by one-way ANOVA DF = (33, 266) and P < 1.0 × 10⁻¹³. Pair-wise comparisons were made using Holm–Sidak test for multiple comparisons using an overall error rate of 0.05, ***P < 1.22 × 10⁻⁵. All values are mean ± s.e.m.
Extended Data Figure 9. FISH for OSTN mRNA in macaque brain.
Layer IVC of active ocular dominance columns in primary visual cortex (V1) shows expression of OSTN after monocular inactivation of monkey#1 (a) and monkey#2 (b). Scale bar, 1,000 μm. c, Expanded panel shows detail of partially tangential portion of tissue section in which OSTN is expressed in layer IVC ocular dominance column stripes. Scale bar, 1,000 μm. d, OSTN expression is also enriched in layer IV of the multimodal parietal cortex. Scale bar, 250 μm. e–h, Representative FISH images of layer IVC neurons from the active columns, showing co-expression of OSTN with various cell-type markers, including VGLUT1 (glutamatergic neurons, e; 94.2 ± 2.8% of OSTN+ cells were VGLUT1+, n = 170), RORB (layer IV, f; 93.3 ± 6.1% of OSTN+ cells were RORB+, n = 92), MEF2C (g; 100% ± 0 of OSTN+ cells were MEF2C+, n = 148), and MEF2A (h; 100% ± 0 of OSTN+ cells were MEF2A+, n = 148). Data are represented as mean ± s.d. Nuclei are visualized with DAPI. Scale bar (e–h), 2 μm.
Extended Data Figure 10. Biochemical detection and immunolocalization of endogenous OSTN protein in human neurons.
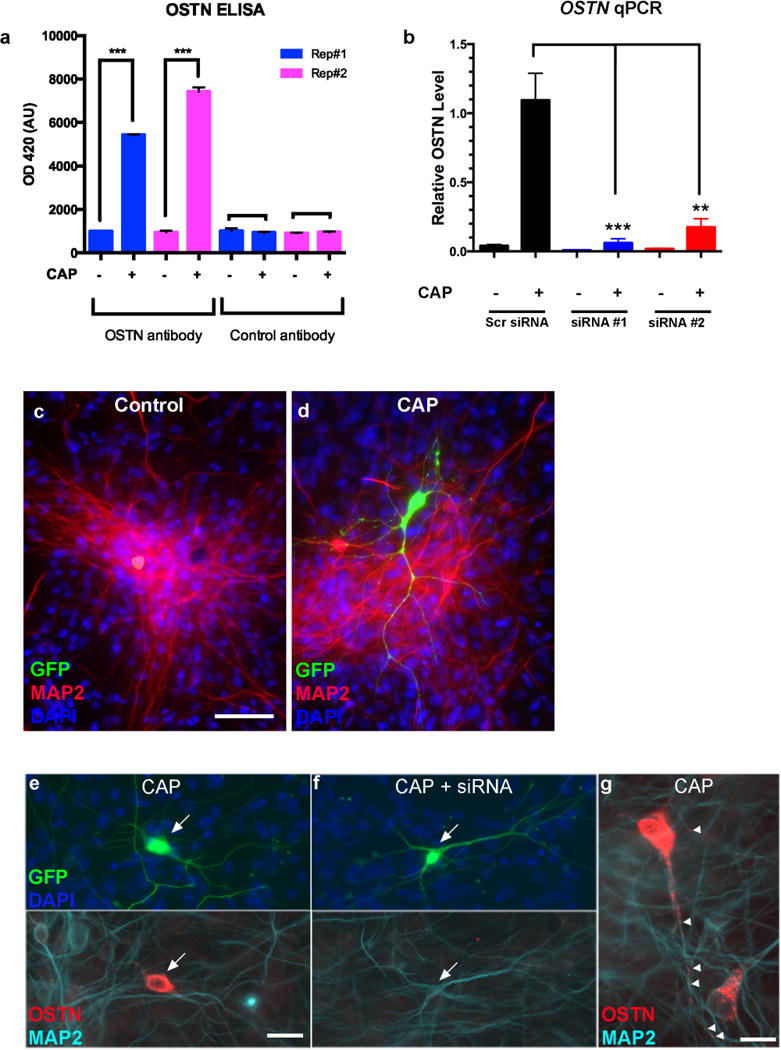
a, ELISA quantification of secreted OSTN in the culture medium of hFBCs under CAP conditions in two biological replicates (Rep#1 and #2). Rat monoclonal anti-OSTN antibody and rat monoclonal anti-CD31 (control antibody) were used as the detection antibodies. n = number of biological replicates. Mean ± s.e.m., Student’s t-test ***P < 0.001. b, Quantitative RT–PCR analysis of OSTN induction in hFBC neurons treated with scrambled siRNA (n = 5) or two independent siRNAs against the OSTN transcript (#1; n = 5 and #2; n = 4) for three days in the presence and absence of CAP. OSTN expression is normalized to GAPDH. c, d, Immunofluorescence images of DIV28 hFBC neurons transfected with –2kbhOSTN:GFP and left untreated (c) or maintained under CAP conditions (d). e–g, Immunofluorescence images of DIV28 hFBC neurons transfected with –2kbhOSTN:GFP (arrows) and treated with CAP for 3 days with (f) or without (e) treatment with siRNA targeting OSTN. Endogenous OSTN is predominantly localized in the soma and primary dendrites. Scale bar, 15 μm. (g) Higher magnification of OSTN immunostaining after 3 day CAP treatment reveals punctate structures (arrowheads) in the dendrites. Scale bars, 48 μm (c, d), 23 μm (e, f), 15 μm (g).
Supplementary Material
Acknowledgments
We thank E. Curran, T. Hartman, P. Schade, P. Zhang, J. M. Gray, M. Hemberg, X. Adiconis, J. Z. Levin, J. Zeig, D. R. Hochbaum, T. J. Cherry and M. M. Andzelm for their technical assistance or advice. This work was supported by grants from the NIH: P50MH106933 and 1RC2MH089952 (M.E.G.), 5F32NS086270 (G.L.B.), EY16187 (M.S.L.), EY12196 (V.K.B.), and T32GM007753 (A.N.M. and E.D.). B.A. is supported by The Ellen R. and Melvin J. Gordon Center for the Cure and Treatment of Paralysis.
Raw and processed RNA-seq data have been submitted to the NCBI Gene Expression Omnibus under accession number GSE78688.
Reviewer Information Nature thanks M. Oldham, F. Polleux and the other anonymous reviewer(s) for their contribution to the peer review of this work.
Footnotes
Supplementary Information is available in the online version of the paper.
Author Contributions B.A., G.L.B., and M.E.G. performed or directed all experiments and wrote the manuscript with E.C.G. B.A., D.A.H. and M.G.Y. performed or analysed gene expression experiments. G.L.B. performed iPSC differentiation and luciferase reporter assays with assistance from M.G.Y., K.M. and M.B.-S. V.K.B., G.L.B. and M.S.L. performed monocular inactivation experiments. B.A., M.G.Y. and G.L.B. performed FISH. B.A. and M.G.Y. performed dendritic growth assays. E.-L.Y. and N.Sh. contributed to overexpression studies. A.N.M. and A.A.R. cloned initial reporter constructs. I.S. provided RiboTag-Seq data and mouse brain sections. L.S.H. generated the OSTN antibody. M.P. and N.Se. provided human brain sections. M.C., J.N.P. and C.A.W. provided human tissue for initial culture experiments. M.A., B.A., M.G.Y., and E.D. performed ChIP experiments. C.R.S. assisted with RNA-seq experiments.
The authors declare no competing financial interests. Readers are welcome to comment on the online version of the paper.
References
- 1.Defelipe J. The evolution of the brain, the human nature of cortical circuits, and intellectual creativity. Front Neuroanat. 2011;5:29. doi: 10.3389/fnana.2011.00029. [DOI] [PMC free article] [PubMed] [Google Scholar]
- 2.Bufill E, Agustí J, Blesa R. Human neoteny revisited: The case of synaptic plasticity. Am J Hum Biol. 2011;23:729–739. doi: 10.1002/ajhb.21225. [DOI] [PubMed] [Google Scholar]
- 3.Geschwind DH, Rakic P. Cortical evolution: judge the brain by its cover. Neuron. 2013;80:633–647. doi: 10.1016/j.neuron.2013.10.045. [DOI] [PMC free article] [PubMed] [Google Scholar]
- 4.Johnson MB, et al. Single-cell analysis reveals transcriptional heterogeneity of neural progenitors in human cortex. Nat Neurosci. 2015;18:637–646. doi: 10.1038/nn.3980. [DOI] [PMC free article] [PubMed] [Google Scholar]
- 5.Pollen AA, et al. Molecular identity of human outer radial glia during cortical development. Cell. 2015;163:55–67. doi: 10.1016/j.cell.2015.09.004. [DOI] [PMC free article] [PubMed] [Google Scholar]
- 6.Kwan KY, et al. Species-dependent posttranscriptional regulation of NOS1 by FMRP in the developing cerebral cortex. Cell. 2012;149:899–911. doi: 10.1016/j.cell.2012.02.060. [DOI] [PMC free article] [PubMed] [Google Scholar]
- 7.Flavell SW, et al. Genome-wide analysis of MEF2 transcriptional program reveals synaptic target genes and neuronal activity-dependent polyadenylation site selection. Neuron. 2008;60:1022–1038. doi: 10.1016/j.neuron.2008.11.029. [DOI] [PMC free article] [PubMed] [Google Scholar]
- 8.Kim TKK, et al. Widespread transcription at neuronal activity-regulated enhancers. Nature. 2010;465:182–187. doi: 10.1038/nature09033. [DOI] [PMC free article] [PubMed] [Google Scholar]
- 9.Greer PL, Greenberg ME. From synapse to nucleus: calcium-dependent gene transcription in the control of synapse development and function. Neuron. 2008;59:846–860. doi: 10.1016/j.neuron.2008.09.002. [DOI] [PubMed] [Google Scholar]
- 10.Banzet S, et al. Musclin gene expression is strongly related to fast-glycolytic phenotype. Biochem Biophys Res Commun. 2007;353:713–718. doi: 10.1016/j.bbrc.2006.12.074. [DOI] [PubMed] [Google Scholar]
- 11.Subbotina E, et al. Musclin is an activity-stimulated myokine that enhances physical endurance. Proc Natl Acad Sci USA. 2015;112:16042–16047. doi: 10.1073/pnas.1514250112. [DOI] [PMC free article] [PubMed] [Google Scholar]
- 12.Moffatt P, et al. Osteocrin is a specific ligand of the natriuretic peptide clearance receptor that modulates bone growth. J Biol Chem. 2007;282:36454–36462. doi: 10.1074/jbc.M708596200. [DOI] [PubMed] [Google Scholar]
- 13.Kang HJ, et al. Spatio-temporal transcriptome of the human brain. Nature. 2011;478:483–489. doi: 10.1038/nature10523. [DOI] [PMC free article] [PubMed] [Google Scholar]
- 14.Molliver ME, Kostović I, van der Loos H. The development of synapses in cerebral cortex of the human fetus. Brain Res. 1973;50:403–407. doi: 10.1016/0006-8993(73)90741-5. [DOI] [PubMed] [Google Scholar]
- 15.Hong EJ, McCord AE, Greenberg ME. A biological function for the neuronal activity-dependent component of Bdnf transcription in the development of cortical inhibition. Neuron. 2008;60:610–624. doi: 10.1016/j.neuron.2008.09.024. [DOI] [PMC free article] [PubMed] [Google Scholar]
- 16.Gossett LA, Kelvin DJ, Sternberg EA, Olson EN. A new myocyte-specific enhancer-binding factor that recognizes a conserved element associated with multiple muscle-specific genes. Mol Cell Biol. 1989;9:5022–5033. doi: 10.1128/mcb.9.11.5022. [DOI] [PMC free article] [PubMed] [Google Scholar]
- 17.Andzelm MM, et al. MEF2D drives photoreceptor development through a genome-wide competition for tissue-specific enhancers. Neuron. 2015;86:247–263. doi: 10.1016/j.neuron.2015.02.038. [DOI] [PMC free article] [PubMed] [Google Scholar]
- 18.Flavell SW, et al. Activity-dependent regulation of MEF2 transcription factors suppresses excitatory synapse number. Science. 2006;311:1008–1012. doi: 10.1126/science.1122511. [DOI] [PubMed] [Google Scholar]
- 19.Potthoff MJ, Olson EN. MEF2: a central regulator of diverse developmental programs. Development. 2007;134:4131–4140. doi: 10.1242/dev.008367. [DOI] [PubMed] [Google Scholar]
- 20.Horton JC, Hocking DR. Monocular core zones and binocular border strips in primate striate cortex revealed by the contrasting effects of enucleation, eyelid suture, and retinal laser lesions on cytochrome oxidase activity. J Neurosci. 1998;18:5433–5455. doi: 10.1523/JNEUROSCI.18-14-05433.1998. [DOI] [PMC free article] [PubMed] [Google Scholar]
- 21.Takahata T, Higo N, Kaas JH, Yamamori T. Expression of immediate-early genes reveals functional compartments within ocular dominance columns after brief monocular inactivation. Proc Natl Acad Sci USA. 2009;106:12151–12155. doi: 10.1073/pnas.0905092106. [DOI] [PMC free article] [PubMed] [Google Scholar]
- 22.Kaas JH. The evolution of neocortex in primates. Prog Brain Res. 2012;195:91–102. doi: 10.1016/B978-0-444-53860-4.00005-2. [DOI] [PMC free article] [PubMed] [Google Scholar]
- 23.Kolb H, Fernandez E, Nelson R. Webvision: The Organization of the Retina and Visual System. University of Utah Health Sciences Center; 1995. [PubMed] [Google Scholar]
- 24.Tochitani S, Liang F, Watakabe A, Hashikawa T, Yamamori T. The occ1 gene is preferentially expressed in the primary visual cortex in an activity-dependent manner: a pattern of gene expression related to the cytoarchitectonic area in adult macaque neocortex. Eur J Neurosci. 2001;13:297–307. doi: 10.1046/j.0953-816x.2000.01390.x. [DOI] [PubMed] [Google Scholar]
- 25.Kostović I, Judaš M. The development of the subplate and thalamocortical connections in the human foetal brain. Acta Paediatr. 2010;99:1119–1127. doi: 10.1111/j.1651-2227.2010.01811.x. [DOI] [PubMed] [Google Scholar]
- 26.Moore AR, et al. Connexin hemichannels contribute to spontaneous electrical activity in the human fetal cortex. Proc Natl Acad Sci USA. 2014;111:E3919–E3928. doi: 10.1073/pnas.1405253111. [DOI] [PMC free article] [PubMed] [Google Scholar]
- 27.O’Leary T, van Rossum MC, Wyllie DJ. Homeostasis of intrinsic excitability in hippocampal neurones: dynamics and mechanism of the response to chronic depolarization. J Physiol (Lond) 2010;588:157–170. doi: 10.1113/jphysiol.2009.181024. [DOI] [PMC free article] [PubMed] [Google Scholar]
- 28.Zweier M, et al. Mutations in MEF2C from the 5q14.3q15 microdeletion syndrome region are a frequent cause of severe mental retardation and diminish MECP2 and CDKL5 expression. Hum Mutat. 2010;31:722–733. doi: 10.1002/humu.21253. [DOI] [PubMed] [Google Scholar]
- 29.Bienvenu T, Diebold B, Chelly J, Isidor B. Refining the phenotype associated with MEF2C point mutations. Neurogenetics. 2013;14:71–75. doi: 10.1007/s10048-012-0344-7. [DOI] [PubMed] [Google Scholar]
- 30.Parikshak NN, et al. Integrative functional genomic analyses implicate specific molecular pathways and circuits in autism. Cell. 2013;155:1008–1021. doi: 10.1016/j.cell.2013.10.031. [DOI] [PMC free article] [PubMed] [Google Scholar]
- 31.Lund JS, Holbach SM, Chung WW. Postnatal development of thalamic recipient neurons in the monkey striate cortex: II. Influence of afferent driving on spine acquisition and dendritic growth of layer 4C spiny stellate neurons. J Comp Neurol. 1991;309:129–140. doi: 10.1002/cne.903090109. [DOI] [PubMed] [Google Scholar]
- 32.Herculano-Houzel S. Neuronal scaling rules for primate brains: the primate advantage. Prog Brain Res. 2012;195:325–340. doi: 10.1016/B978-0-444-53860-4.00015-5. [DOI] [PubMed] [Google Scholar]
- 33.Srinivasan S, Carlo CN, Stevens CF. Predicting visual acuity from the structure of visual cortex. Proc Natl Acad Sci USA. 2015;112:7815–7820. doi: 10.1073/pnas.1509282112. [DOI] [PMC free article] [PubMed] [Google Scholar]
- 34.Mardinly AR, et al. Sensory experience regulates cortical inhibition by inducing IGF1 in VIP neurons. Nature. 2016;531:371–375. doi: 10.1038/nature17187. [DOI] [PMC free article] [PubMed] [Google Scholar]
- 35.Berry BJ, et al. Morphological and functional characterization of human induced pluripotent stem cell-derived neurons (iCell Neurons) in defined culture systems. Biotechnol Prog. 2015;31:1613–1622. doi: 10.1002/btpr.2160. [DOI] [PMC free article] [PubMed] [Google Scholar]
- 36.Brewer GJ, Torricelli JR. Isolation and culture of adult neurons and neurospheres. Nat Protocols. 2007;2:1490–1498. doi: 10.1038/nprot.2007.207. [DOI] [PubMed] [Google Scholar]
- 37.Gray JM, et al. SnapShot-Seq: a method for extracting genome-wide, in vivo mRNA dynamics from a single total RNA sample. PLoS One. 2014;9:e89673. doi: 10.1371/journal.pone.0089673. [DOI] [PMC free article] [PubMed] [Google Scholar]
- 38.Robinson MD, McCarthy DJ, Smyth G. K edgeR: a Bioconductor package for differential expression analysis of digital gene expression data. Bioinformatics. 2010;26:139–140. doi: 10.1093/bioinformatics/btp616. [DOI] [PMC free article] [PubMed] [Google Scholar]
- 39.McCarthy DJ, Chen Y, Smyth GK. Differential expression analysis of multifactor RNA-Seq experiments with respect to biological variation. Nucleic Acids Res. 2012;40:4288–4297. doi: 10.1093/nar/gks042. [DOI] [PMC free article] [PubMed] [Google Scholar]
- 40.Spiegel I, et al. Npas4 regulates excitatory-inhibitory balance within neural circuits through cell-type-specific gene programs. Cell. 2014;157:1216–1229. doi: 10.1016/j.cell.2014.03.058. [DOI] [PMC free article] [PubMed] [Google Scholar]
- 41.Meijering E, et al. Design and validation of a tool for neurite tracing and analysis in fluorescence microscopy images. Cytometry A. 2004;58:167–176. doi: 10.1002/cyto.a.20022. [DOI] [PubMed] [Google Scholar]
- 42.Ferreira TA, et al. Neuronal morphometry directly from bitmap images. Nat Methods. 2014;11:982–984. doi: 10.1038/nmeth.3125. [DOI] [PMC free article] [PubMed] [Google Scholar]
- 43.Boulting GL, et al. A functionally characterized test set of human induced pluripotent stem cells. Nat Biotechnol. 2011;29:279–286. doi: 10.1038/nbt.1783. [DOI] [PMC free article] [PubMed] [Google Scholar]
- 44.Maroof AM, et al. Directed differentiation and functional maturation of cortical interneurons from human embryonic stem cells. Cell Stem Cell. 2013;12:559–572. doi: 10.1016/j.stem.2013.04.008. [DOI] [PMC free article] [PubMed] [Google Scholar]
- 45.Malik AN, et al. Genome-wide identification and characterization of functional neuronal activity-dependent enhancers. Nat Neurosci. 2014;17:1330–1339. doi: 10.1038/nn.3808. [DOI] [PMC free article] [PubMed] [Google Scholar]
Associated Data
This section collects any data citations, data availability statements, or supplementary materials included in this article.