Abstract
Clear cell renal cell carcinoma (ccRCC), the most common form of kidney cancer, is usually linked to inactivation of the pVHL tumor suppressor protein and consequent accumulation of the HIF2α transcription factor 1. Here we show that a small molecule (PT2399) that directly inhibits HIF2α causes tumor regression in preclinical models of primary and metastatic pVHL-defective ccRCC in an on-target fashion. pVHL-defective ccRCC cell lines display unexpectedly variable sensitivity to PT2399, however, suggesting the need for predictive biomarkers.
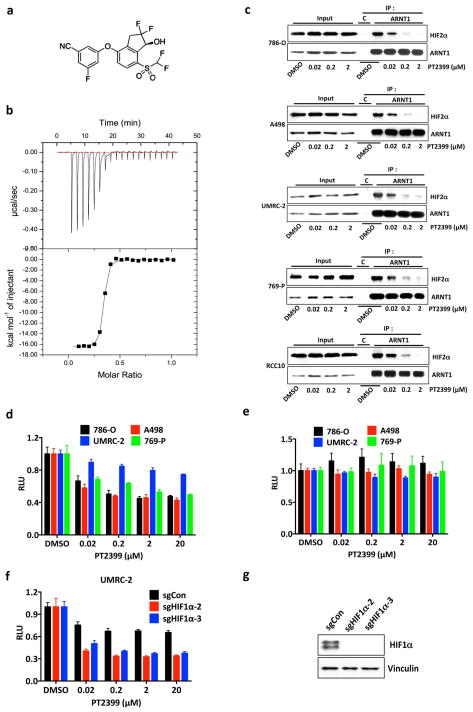
HIF2α, as a bHLH-PAS domain protein, would usually be deemed undruggable. Bruick and Gardner’s work, however, followed by medicinal chemistry efforts at Peloton Therapeutics, led to drug-like chemicals such as PT2399 (Fig. 1a) that can bind directly to the HIF2α PAS B domain (Fig. 1a and Extended Data Fig. 1a, b) and cripple HIF2α’s ability to bind to ARNT (Fig. 1b and Extended Data Fig. 1c), and hence to DNA 2–6. PT2399 minimally affected a panel of 68 receptors, ion channels, and enzymes (Supplementary Table 1).
Figure 1.
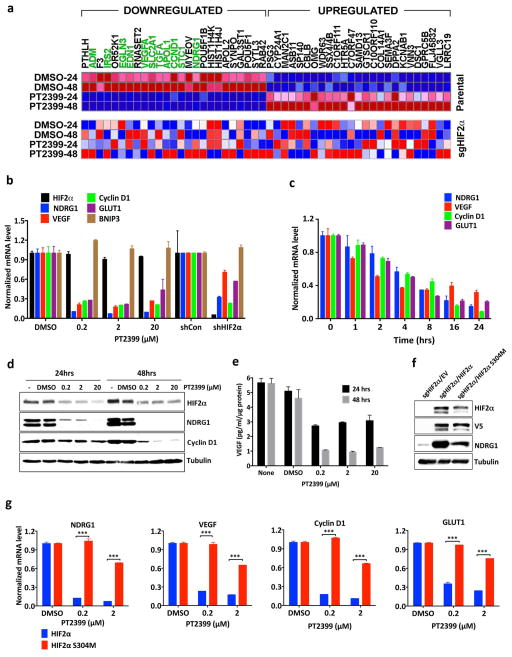
PT2399 downregulates HIF target genes. a, Binding of PT2399 (inset) to human HIF2α PAS-B domain assayed by isothermal calorimetry (n=2) b, Immunoblots of anti-ARNT1 immunoprecipitates (IP) and whole cell extracts (input) from ccRCC cell lines treated with PT2399 or DMSO. C = control IP without ARNT1 antibody. c, Heat map of changes in mRNAs in 786-O cells [parental and HIF2α−/− generated with sgHIF2α (guide #6)] treated with 2 μM PT2399 or DMSO for indicated duration (hours). n=1. Examples of HIF target genes are indicated in green. d, Venn diagram of gene sets regulated by PT2399. 249 gene sets were regulated in parental 786-O cells, but not in 786-O HIF2α −/− cells. e, f, Levels of the indicated mRNAs, normalized to beta actin, and then to DMSO controls, in 786-O cells treated with PT2399 at the indicated concentration for 24 hrs (e) or duration with 2 μM PT2399 (f). 786-O cells expressing a HIF2α shRNA or control shRNA were included in (e) for comparison; n=3. g, Immunoblots of 786-O cells treated with PT2399. h, VEGF concentration, normalized to total cellular protein, in media conditioned by 786-O cells treated with PT2399; n=3 biological replicates. Data as mean ± s.e.m. (e and f) or mean ± s.d. (h)
Treating 786-O VHL−/− ccRCC cells with PT2399 repressed various HIF target genes in mRNA microarray (Fig. 1c), real-time PCR (Fig. 1e and f and Extended Data Fig. 1d), immunoblot (Fig. 1g) and ELISA (Fig. 1h) assays. PT2399 did not suppress HIF1α-specific targets such as BNIP3 (Fig. 1e and Extended Data Fig. 1e). PT2399 destabilized HIF2α, which might enhance its effects on HIF2α DNA-binding activity (Fig. 1e, g and Extended Data Fig. 1f). PT2399 downregulated genes sets induced by hypoxia, HIF, and c-Myc, consistent with reports that HIF2α and c-Myc cooperate to promote ccRCC 7,8 (Fig. 1d, Extended Data Fig. 1g and Supplementary Table 2).
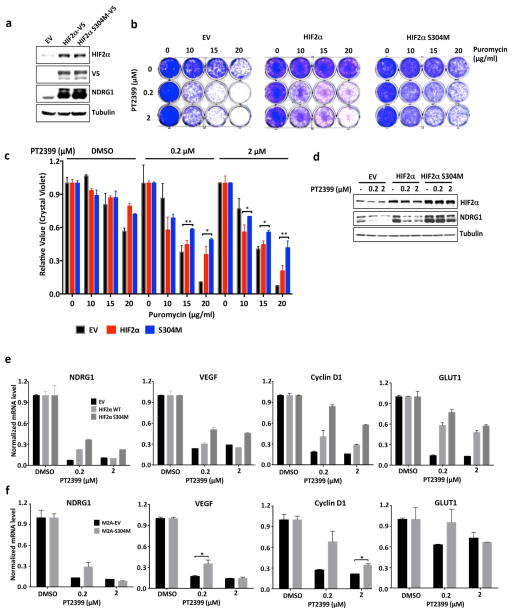
Next we made HIF2α −/− 786-O cells using CRISPR-Cas9 (Extended Data Fig. 2a). They proliferated under standard conditions (Extended Data Fig. 2c–f), consistent with the effects of HIF2α shRNA and pVHL in 786-O cells 9,10. We then lentivirally reintroduced wild-type HIF2α, or a HIF2α missense mutant (S304M) with an occluded PT2399-binding pocket 4, into these cells (Fig. 2a). PT2399’s effects on HIF-responsive mRNAs was largely eliminated in cells lacking HIF2α (Fig. 1c, d) or producing HIF2α S304M (Fig. 2b).
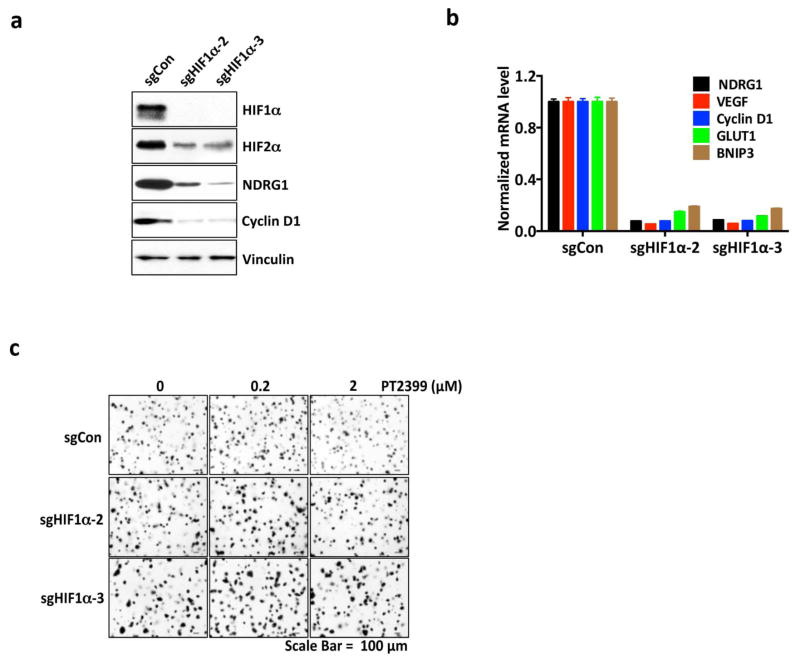
Figure 2.
On-target effects of PT2399 on transcription and soft agar growth. a, Immunoblots of HIF2α−/− 786-O cells (sgHIF2α #6) infected with a lentivirus encoding V5-tagged HIF2α (wild-type), HIF2α (S304M), or empty vector. b, Levels of the indicated mRNAs, normalized to beta actin mRNA, and then to DMSO treatment, in cells from (a) treated with PT2399 or DMSO for 48 hours; n=3. c, d, Soft agar colonies formed by 786-O cells infected with a lentivirus encoding HIF2α S304M (d) or the empty vector (c) in the presence of PT2399 at the indicated concentrations for 21 days; n=3 biological replicates. e, f, Soft agar colonies formed by 786-O clones as in (Extended Data Figure 2a, b); n=3 biological replicates. In f, the 786-O HIF2α−/− cells (sgHIF2α #6) were superinfected with a lentivirus encoding a sgRNA-resistant HIF2α cDNA (HIF2α) or with the empty vector (EV). g, Quantification of soft agar colony formation in (c–f). Data as mean ± s.e.m. *P<0.05, **P<0.01 and ***P<0.001 by two-tailed Student’s t-tests (b, g).
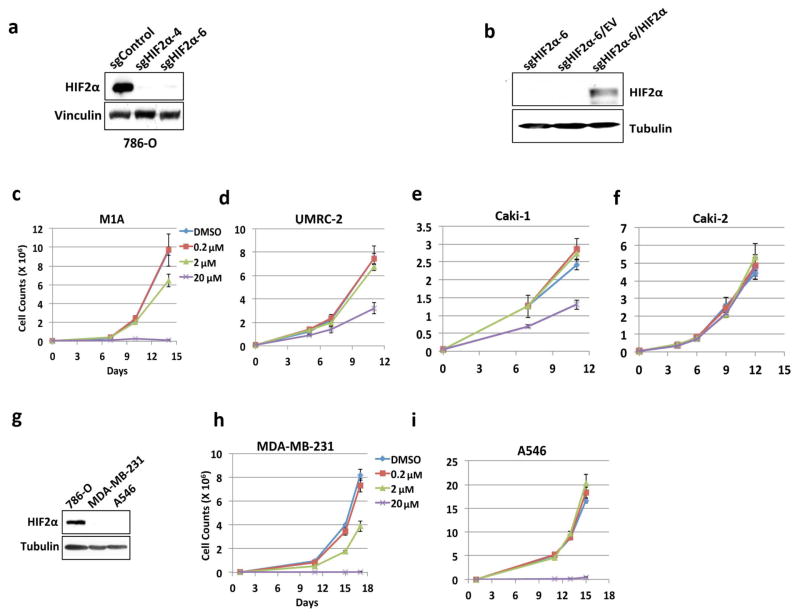
PT2399 (up to 2 μM) minimally altered ccRCC cell line proliferation under standard cell culture conditions (Extended Data Fig. 2c and g–j). 20 μM PT2399 caused off-target toxicity because it inhibited the proliferation of HIF2α −/− 786-O cells (Extended Data Fig. 2a, d–f) and other cancer cell lines with undetectable HIF2α (Extended Data Fig. 2k–m). PT2399 did, however, inhibit 786-O cell soft agar growth at 0.2–2 μM (Fig. 2c and g and Extended Data Fig. 3a and f). This effect was specific because it was reversed by HIF2α S304M (Fig. 2d, g) and not seen in SLR21 VHL+/+ ccRCC cells (Extended Data Fig. 3c and f). Similarly, HIF2α −/− 786-O cells did not form soft agar colonies unless rescued with exogenous HIF2α (Fig. 2e–g and Extended Data Fig. 2b). Therefore, PT2399 decreases HIF-dependent transcription and soft agar growth in an on-target manner.
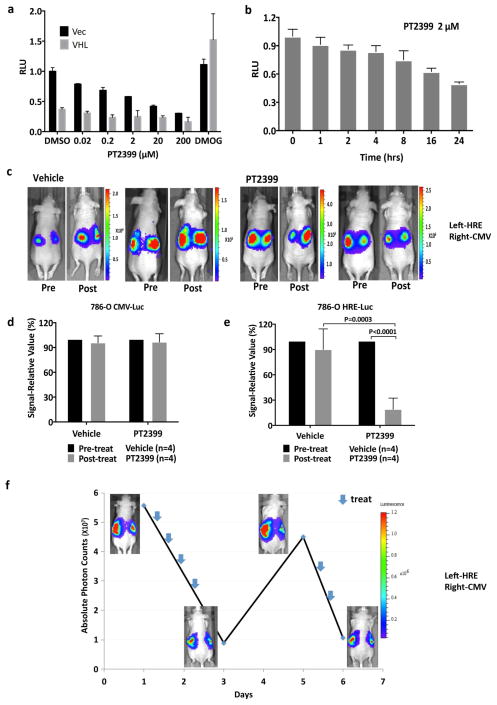
As a step toward imaging studies we infected 786-O cells, as well as isogenic cells expressing exogenous pVHL, with a lentivirus encoding firefly luciferase (Luc) driven by a HIF-responsive promoter (3XHRE-Luc). As expected, PT2399 inhibited Luc activity in the VHL−/− cells, but not in their pVHL-proficient counterparts (Fig. 3a, b). Conversely, the diooxygenase inhibitor DMOG, which blocks the binding of pVHL to HIFα, induced Luc activity in the pVHL-proficient cells, but not the VHL−/− cells (Fig. 3a). As expected, PT2399 did not affect Luc driven by constitutive promoters, such as the CMV promoter (Fig. 3c).
Figure 3.
PT2399 pharmacodynamic effects in vivo. a, b Light emission, normalized to total cellular protein (a) and cell number (b) in 786-O 3XHRE-Luc reporter cells expressing VHL or an empty vector (Vec). The cells were treated with PT2399 overnight (a) or at 2 μM for the indicated durations (b). 1 mM DMOG was included in (a) as a control; n=3. c, Luc values of 786-O derivatives expressing Luc driven by the indicated promoters and then exposed to either PT2399 or to 1 mM DMOG; n=3 biological replicates. d, Representative bioluminescent images (BLI) of mice with orthotopic tumors formed by 786-O 3XHRE-Luc reporter cells (left kidney) or 786-O CMV-Luc reporter cells (right kidney). Images were obtained before and after two days of PT2399 30 mg/kg given twice daily (n=6 mice from two independent experiments) or vehicle (n=6 mice from two independent experiments) by oral gavage. e, f, Quantification of BLI from mice as in (d); n=4 mice from two independent experiments. Values were normalized to the pretreatment values for each treatment. g, Serial BLI of a mouse as in (d) treated with PT2399 (blue arrows). Shown on the y-axis are absolute photon counts for the 3XHRE-Luc tumor. Data as mean ± s.e.m. (a–c, e and f). Statistical significance was assessed using Mann-Whitney tests (f).
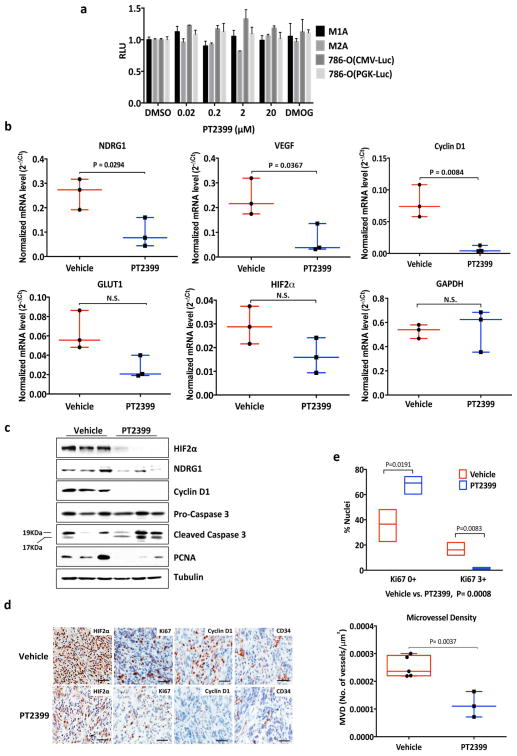
Next, 786-O 3XHRE-Luc cells and 786-O CMV-Luc cells were injected into opposing kidneys of nude mice. Once tumors were established, as determined by serial bioluminescence imaging (BLI), the mice were given PT2399 or vehicle twice daily (Extended Data Fig 1h and i). Two days of PT2399 decreased the 3XHRE-Luc signal by more than 60%, similar to its effects in vitro (Fig. 3d, f). These effects were not observed in the CMV-Luc tumors nor with the vehicle (Fig. 3d, e). The 3XHRE-Luc signal recovered after a drug washout period and decreased again after drug rechallenge (Fig. 3g). Analysis of kidneys removed after 2 days of PT2399 treatment revealed decreased HIF-responsive mRNAs, decreased Ki-67 staining, increased Caspase 3 cleavage and decreased microvessel density (Extended Data Fig. 4a–e).
To assess antitumor efficacy 786-O CMV-Luc cells were grown orthotopically in nude mice and, once established, treated with PT2399 or vehicle. As expected, tumors continued to grow in vehicle treated mice, as shown by weekly BLI. In contrast, PT2399 caused tumor stasis or regression (Fig. 4a–c, Extended Data Fig. 4f), which correlated with decreased circulating tumor-derived VEGF (Extended Data Fig. 4g), decreased proliferation and decreased angiogenesis (Extended Data Fig. 4h).
Figure 4.
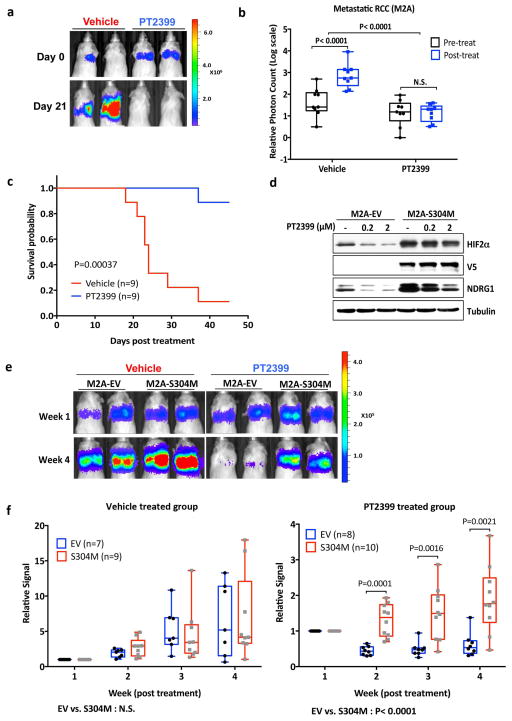
PT2399 antitumor activity. a, Representative BLI of orthotopic tumors formed by 786-O CMV-Luc cells before and after PT2399 30 mg/kg or vehicle twice daily by oral gavage for 30 days (vehicle, n=15 mice from three independent experiments and PT2399, n=13 mice from three independent experiments) b, Spider plot showing growth of tumors as in (a) as determined by serial BLI. For each tumor the BLI values were normalized to the corresponding day 0 value. c, Quantification of BLI from mice as in (a). For c, the value for each tumor was normalized to the pretreatment value for that tumor. d, Representative BLI of lung colonies formed by M2A-Luc cells and treated with PT2399 30 mg/kg or vehicle twice daily by oral gavage (vehicle, n=9; PT2399, n=9 from two independent experiments). e, f, Quantification of BLI values (e) and Kaplan-Meier survival curves (f) from mice treated as in (d) (vehicle, n=9 mice from two independent experiments and PT2399, n=9 mice from two independent experiments). g, Immunoblots of M2A cells infected with a lentivirus encoding HIF2α S304M or empty vector. h, Representative BLI of lung colonies formed by M2A cells in (g) treated with PT2399 30 mg/kg or vehicle twice daily by oral gavage (for EV, vehicle and PT2399, n=7 and n=8, respectively; for S304M, vehicle and PT2399, n=9 and 10, respectively). i, Quantification of BLI values as in (h); for EV, vehicle and PT2399, n=7 and n=8, respectively; for S304M, vehicle and PT2399, n=9 and 10, respectively from two independent experiments. Data as median with range(c, e and i) Statistical significance was assessed using Mann-Whitney test (c and i ), unpaired t-test (e) or log-rank test (f).
Kidney-confined ccRCC can often be treated surgically. We therefore obtained a metastatic variant of 786-O cells (M2A cells) expressing Luc under an HSV TK promoter, which form diffuse lung colonies after tail vein injection 11. In this model PT2399 still caused marked tumor regressions and prolonged survival (Fig. 4d–f). Similar results were obtained when a limited number of cells were injected in an effort to better mimic established lung metastases (Extended Data Fig. 5a, b). Introducing HIF2α S304M into M2A cells (Fig. 4g) conferred partial resistance to PT2399’s pharmacodynamic (Extended Data Fig. 5c) and antitumor effects (Fig. 4h and i).
PT2399 also inhibited A498 VHL−/− ccRCC cells in soft agar and orthotopic tumor assays (Extended Data Fig. 3b, f, and Extended Data Fig. 6), consistent with the effects of HIF2α shRNAs in these cells10, and inhibited a VHL−/− ccRCC patient-derived xenograft (PDX) (Extended Data Fig. 5d and e). In contrast, PT2399 did not suppress orthotopic tumors formed by VHL−/− UMRC-2 cells or VHL−/− 769-P cells (Fig. 5a–d) despite inhibiting HIF2α dimerization and HIF2α-dependent transcription in these cells with IC50s comparable to those seen in 786-O and A498 cells (Fig. 1b and Extended Data Fig. 7a–d) and despite effective suppression of HIF target genes, when measured, in vivo (Extended Data Fig. 8a).
Figure 5.
Variable sensitivity of ccRCC lines to PT2399. a, c, Representative BLI of orthotopic tumors formed by UMRC-2 CMV-Luc cells (a) (vehicle, n=8 and PT2399, n=9 mice from two independent experiments) and 769-P CMV-Luc cells (c) (vehicle, n=7 and PT2399, n=8 mice from two independent experiments) before and after (30 and 35 days, respectively) treatment with PT2399 30 mg/kg or vehicle by oral gavage. b, d, Quantification of BLI as in (a) and (c), respectively. e, Immunoblots ccRCC cells lines, including quantification of HIF2α protein levels, normalized to tubulin. HIF1α in A498 and SKRC20 cells is mutated and defective14. f, NDRG1 mRNA levels in ccRCC cell lines treated with PT2399 for 24 hrs; n=3 biological replicates. For each cell line, after normalization to beta actin, NDRG1 mRNA levels were normalized to untreated value for that cell line. SLR21 VHL+/+ renal carcinoma cells were included in (e) and (f) for comparison. g, i, Immunoblots of UMRC-2 cells (g) and 769-P cells (i) after CRISPR-based gene editing with control sgRNA or HIF2α sgRNA (guides 4 and 6). h, j, Soft agar colonies formed by cells as in (g) and (i); n=3 biological replicates. Data as median with range (b, d) and mean ± s.d. (f). Statistical analysis was performed by using two-tailed Student’s t-tests (b, d). N.S., P>0.05.
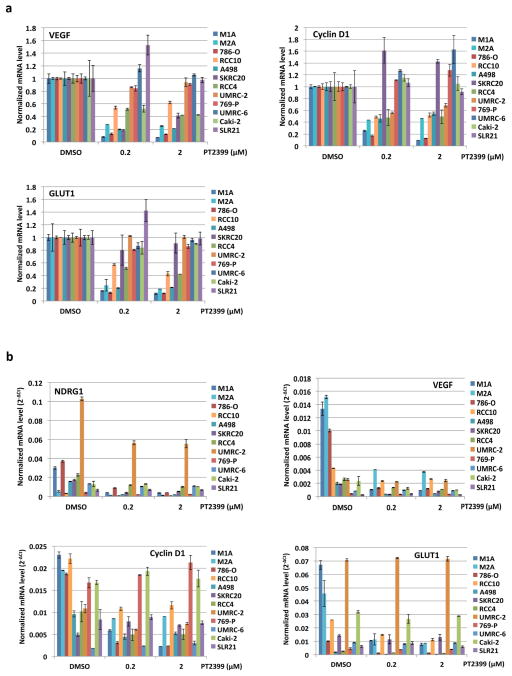
To study this differential sensitivity further we measured HIF2α abundance and the response of selected HIF target genes to PT2399 and to pVHL across a VHL−/− ccRCC cell line panel. The PT2399-sensitive 786-O and A498 cells had higher HIF2α levels than the insensitive UMRC-2 and 769-P cells (Fig. 5e). They also exhibited the greatest inhibition of HIF target genes, as a percentage of basal expression, in response to PT2399 (Fig. 5f and Extended Data Fig. 8d, e) and, where tested, pVHL (Extended Data Fig. 8b, c). The latter further supported that this differential sensitivity to PT2399 reflects differences in HIF2α dependence rather than differences in intracellular drug accumulation. Indeed, soft agar growth by UMRC-2 cells and 769-P cells was, in contrast to 786-O and A-498 cells, insensitive to Cas9-mediated inactivation of HIF2α and to PT2399 (Fig. 5g–j and Extended Data Fig. 3c, f and g). Similarly, soft agar growth by SKRC-20 and UMRC-6 VHL−/− ccRCC cells was unaffected by genetic disruption of HIF2α and to PT2399 (Extended Data Fig. 3c–g). RCC10 cell soft agar growth was unaffected by PT2399, but was suppressed in an on-target manner by Cas9-mediated loss of HIF2α, despite a similar decrease in HIF2 target mRNAs in response to both (Extended Data Fig. 3c–g, and Extended Data Fig. 9a–f). The significance of this discrepancy is unclear because the HIF2α−/− RCC10 cells quickly regained the ability to grow in soft agar after repeated culture despite persistent HIF2α loss (see also below). Finally, we confirmed that genetic disruption of HIF2α, like PT2399, did not affect orthotopic tumor growth by UMRC-2 cells (Extended Data Fig. 10).
Differential HIF2α dependence amongst ccRCC lines is not linked to their HIF1α status because the insensitive cell lines 769-P and SKRC-20, like the sensitive cell lines 786-O and A498, lack wild-type HIF1α 12. Moreover, Cas9-mediated ablation of HIF1α in UMRC-2 cells did not render them HIF2α-dependent in soft agar assays (Extended Data Fig. 7e–g).
In contrast, HIF2α dependence across the ccRCC lines we examined loosely correlated with their basal HIF2α levels and the dependence of HIF target genes in those lines on HIF2α itself. A caveat is that some of these lines might have lost their dependence on HIF2α due to prolonged passage in culture, especially as HIF2α is not required under standard culture conditions. On the other hand, freshly explanted ccRCC PDXs are also variably sensitive to PT239913.
To begin to understand this differential HIF2α dependence further, we focused on RCC10 cells because HIF target genes and soft agar growth are less HIF2α-dependent in these cells than in 786-O and A498 cells despite their comparably high HIF2α levels (Fig. 5e, Extended Data Fig. 3c–g, and Extended Data Fig. 9b). We discovered that RCC10 cells harbor the canonical p53 R248W mutant (Extended Data Fig. 9g). p53 R248W also arose spontaneously in a 786-O subclone made in our laboratory (Extended Data Fig. 9h) and was associated with acquired resistance to PT2399 (Extended Data Fig. 9i). p53 was not induced by DNA damage in the HIF2-independent lines UMRC-2 and 769-P, suggesting they also have p53 pathway mutations, but was induced in the HIF2-independent lines UMRC-6 and Caki-2 (Extended Data Fig. 9g, j). Of note, p53 was modestly induced by PT2399 and Cas9-mediated loss of HIF2α in p53+/+ 786-O cells (Extended Data Fig. 9h, k), consistent with reports that HIF2α constrains p53 activity in ccRCC14,15. Therefore an intact p53 pathway seems necessary, but not sufficient, for HIF2-dependence in ccRCC.
Our findings suggest that the response of VHL−/− ccRCC to HIF2α antagonists will be variable and will demand predictive biomarkers, perhaps including measures of HIF2α activity and p53 status. The current view that p53 mutations are uncommon in ccRCC is based mainly on studies of primary tumors removed at nephrectomy1. p53 pathway mutations might be more common in metastatic ccRCC, from which most ccRCC lines are derived, or might arise after ccRCC therapies 16. Alternatively, some p53 mutations in ccRCC lines might have arisen ex vivo. Another important question is whether adding HIF2α antagonists will enhance the activity of existing ccRCC drugs.
Extended Data
Extended Data Figure 1. Binding of PT2399 to PAS-B domain of human HIF2α as determined by X-Ray co-crystal structure.
a, X-Ray co-crystal of PT2399 (magenta) bound to HIF2α/ARNT PAS-B domains (ARNT removed for clarity). b, X-Ray co-crystal of PT2399 (magenta) with HIF2α/ARNT PAS-B domains (zoomed in on HIF2α PAS-B pocket). c, Immunoblots of anti-ARNT1 immunoprecipitates (IP) of Hep3B cells treated with PT2399 or DMSO. d, Immunoblot of 786-O cells expressing shRNA against HIF2α (3806) or control shRNA. e, HIF2α specific gene regulation in Hep3B; n=3 biological replicates. f, Immunoblot analysis (top) and quantification (bottom) of HIF2α in 786-O cells treated with DMSO or PT2399 for 16 hours and then exposed to cycloheximide for the indicated time periods; n=3 biological replicates. g, Enrichment plots for representative gene sets previously linked to HIF, hypoxia, or c-Myc. h, i, Plasma PT2399 levels after administration of a single dose of PT2399 to CD-1 mice; n=3 per time point from one experiment.
Extended Data Figure 2. Inhibition of cell proliferation by PT2399 ex vivo.
a, b, Immunoblot analysis of 786-O cells after CRISPR-based gene editing with control sgRNA or HIF2α sgRNA (guides 4 and 6). In (b) cells were also infected with an empty vector (EV) or a virus expressing an HIF2α sgRNA guide 6-resistant HIF2α cDNA. c–f, Cell proliferation of parental 786-O cells (c) and 786-O clones subjected to CRISPR-based gene editing with a control sgRNA (d) or in which endogenous HIF2α was successfully inactivated using two different HIF2α sgRNAs (guides 4 and 6) (e, f); n=3 biological replicates. g–j, Proliferation curves for 786- M1A cells (g), UMRC-2 (h), Caki-1 cells (i), and Caki-2 cells (j) treated with the indicated concentrations of PT2399. k, Immunoblot analysis of the indicated cell lines. l, m, Proliferation curves for MDA-MB-231 (l) and A549 cells (m) treated with indicated concentrations of PT2399; n=3 biological replicates. Data as mean ± s.d. (c–j, l and m)
Extended Data Figure 3. Effects of PT2399 on soft agar growth.
a–c, Soft agar colonies formed by 786-O cells (a), A498 cells (b), and the indicated cell lines (c) in the presence of PT2399 at the indicated concentrations for 21 days; n=3 biological replicates. d, Soft agar colonies formed by the indicated polyclonal cell line populations after CRISPR-based gene editing with control sgRNA or HIF2α sgRNA (guides 4 and 6); n=3 biological replicates. The reason for the differential sensitivity of RCC10 cells to PT2399 and the HIF2α sgRNAs is not yet clear. e, Immunoblot analysis of the cells used in (d). For SLR21 cells, 1mM DMOG was treated for 16 hrs to detect HIF2α. f, g, Quantification of soft agar colonies formed in (a–d and Fig. 5h, j), respectively; n=3. Data as mean ± s.e.m. *P<0.01 by two-tailed Student’s t-tests (f, g).
Extended Data Figure 4. Pharmacodynamic effects of PT2399 in vivo.
a, Levels of the indicated mRNAs, normalized to beta actin, in 786-O orthotopic tumors treated with PT2399 30 mg/kg (n =3 mice from two independent experiments) or vehicle (n=3 mice from two independent experiments) twice daily for two days in vivo. b, Immunoblot analysis of 786-O orthotopic tumors treated with PT2399 30 mg/kg or vehicle twice daily for two days in vivo; for vehicle, n=3 mice from two independent experiments and PT2399, n=3 mice from two independent experiments. c, Quantification of Ki-67 staining (vehicle, n=3; PT2399, n=3 mice from two independent experiments) d, Immunohistochemistry of representative 786-O orthotopic tumors treated with PT2399 30 mg/kg or vehicle twice daily for two days in vivo; for vehicle, n=3 and PT2399, n=3. Scale bars, 50 μm. e, Microvessel Density (vehicle, n=5; PT2399, n=3 mice from two independent experiments) from tumors as in (d). f, g, Representative tumors at necropsy (f) and serum VEGF concentrations (vehicle, n=10; PT2399, n=11 mice from three independent experiments) (g) from mice as in Fig. 4a–c just prior to necropsy. h, Representative immunohistochemical staining of 786-O tumors treated as in Fig. 4a–c (vehicle, n=4; PT2399, n=5); Scale bars, 50 μm. Data as median with range (a, c, e and g). Statistical significance was assessed by using Mann-Whitney test (e) or Unpaired t-test (g). N.S., P>0.05.
Extended Data Figure 5. Antitumor activity of PT2399 in lung colonization and PDX models.
a, BLI of lung colonies formed after tail vein injection of 9,000 786-M2A cells treated with PT2399 30 mg/kg or vehicle twice daily by oral gavage. Treatment began at week 1. b, Quantification of BLI values as in (a). Data as median with range (Vehicle, n=2 and PT2399, n=3 mice from one experiment). c, Partial rescue of PT2399 pharmacodynamic effect by HIF2α S304M; n=3 biological replicates Levels of the indicated mRNAs, normalized to beta actin mRNA and then to DMSO treatment, in cells from Fig. 4g treated with PT2399 at the indicated concentrations for 48 hours; n=3. Data as mean ± s.e.m. *P<0.05 by two-tailed Student’s t-tests. Note that rescue is only partial, perhaps because these cells still produce endogenous wild-type HIF2α in addition to exogenous HIF2α S304M. d, Subcutaneous PDX measurements in mice randomized to the indicated treatments, including the FDA-approved ccRCC drug sunitinib, when the tumors reached 200 to 300 mm3. P<0.05 for difference between PT2399 and vehicle (n = 8, unpaired t-test). e, Immunohistochemistry of PDX in (d) before treatment. Scale bars, 100 μm. Data as mean ± s.e. m. (d).
Extended Data Figure 6. Antitumor activity of PT2399 using A498 cells.
a, b, Representative BLI (a) and quantification of BLI measurements (b) of orthotopic tumors formed by A498 cells expressing firefly luciferase under the control of CMV promoter before and after (30 days) treatment with PT2399 30 mg/kg or vehicle twice daily by oral gavage (vehicle, n=10 and PT2399, n=10 mice from two independent experiments) c, d, Representative tumors (c) and tumor masses (d) at necropsy from mice treated as in (a) (vehicle, n=10 and PT2399, n=10 mice). e, Serum VEGF concentrations from mice treated as in (a) at time of necropsy (vehicle, n=4; PT2399, n=4 mice from two independent experiments). f, Immunoblot of representative tumors from (a); for vehicle and PT2399, n=4 and n=3, respectively. g, Levels of the indicated mRNAs, normalized to beta actin, in A498 orthotopic tumors (vehicle, n=4; PT2399, n=3 mice from two independent experiments) treated as in (a). Data as median with range. Statistical significance was assessed by using two-tailed Student’s t-tests with Welch’s correction (b and d) or Mann-Whitney test (d and e). N.S., P>0.05.
Extended Data Figure 7. Elimination of HIF1α does not render UMRC-2 cells sensitive to PT2399 in soft agar assays.
a–c, Firefly luciferase activity in the indicated cell lines after infection with a virus containing firefly luciferase under the control of a HIF-responsive (HRE-Luc) promoter (a, c) or CMV promoter (b) and treatment with the indicated concentrations of PT2399 for 16 hrs relative to DMSO-treated controls; n=3 biological replicates. d, Immunoblot analysis of HRE-Luc expressing UMRC-2 cells after CRISPR-based gene editing with control sgRNA or HIF1α sgRNA (guides 2 and 3). Note that deletion of HIF1α in (c) and (d) was used to eliminate the contribution of HIF1α in (a). e, f, Immunoblot (e) and mRNA levels (f) of UMRC-2 cells after CRISPR-based gene editing with control sgRNA or HIF1α sgRNA (guides 2 and 3). In (f) mRNA levels were normalized to beta-actin and then to the corresponding control sgRNA value; n=3 biological replicates. g, Soft agar assays of the cells analyzed in (e) and (f) in the presence of the indicated concentrations of PT2399; n=3 biological replicates. Data as mean ± s.e.m. (a–c and f).
Extended Data Figure 8. Variable sensitivity of ccRCC lines to PT2399 and pVHL.
a, Levels of the indicated mRNAs, normalized to beta actin, in UMRC-2 orthotopic tumors treated with PT2399 30 mg/kg or vehicle twice daily for 1 month; for vehicle, n=2; PT2399, n=2 mice from one experiment. b, c, Downregulation of HIF-responsive mRNAs by PT2399 in indicated cell lines. For each cell line the mRNA levels were normalized to beta actin mRNA (c) and then normalized to untreated value for that cell line (b); n=3 biological replicates. Data as median with range (a) and mean ± s.d. (b, c). d–e, Variable suppression of HIF target genes by PT2399 across a panel of ccRCC cell lines. Downregulation of HIF-responsive VEGF, Cyclin D1, and GLUT1 mRNAs by PT2399 in the indicated cell lines. For each cell line the mRNA levels were normalized to beta actin (e) and then normalized to untreated value for that cell line (d); n=3 biological replicates. SLR21 VHL+/+ renal carcinoma cell was included for comparison. Data as mean ± s.d.
Extended Data Figure 9. HIF2 dependence of RCC10 cells.
a, Immunoblot analysis of anti-ARNT1 immunoprecipitates (IP) and whole cell extracts (input) prepared from RCC10 cells treated with increasing amounts of PT2399 or DMSO. Control IP without ARNT1 antibody was marked as ‘C’. b, Levels of the indicated mRNAs, normalized to beta actin, in 786-O, A498 and RCC10 cells treated with PT2399 at the indicated concentration for 24 hrs or an effective HIF2α sgRNA (sgHIF2α-6), and then normalized to cells treated with DMSO or a control sgRNA, respectively. Data as mean ± s.d.; n=3 biological replicates. c, immunoblot analysis of RCC10 cells after CRISPR based editing with HIF2α sgRNAs or control sgRNA. d, e, soft agar colonies formed by RCC10 cells as in (c); n=3 biological replicates. In (e) cells were engineered to express an exogenous sgRNA-resistant HIF2α or empty vector (EV);n=3. f, Soft agar colony counts as in (e) using ImageJ software. Colonies were counted using the following criteria: circularity range from 0.5 to 1.0 and size (pixels2) from 200 to infinity. Data shown mean ± s.e.m. Statistical significance was assessed by using two-tailed Student’s t-tests (f). *P<0.05.
g–k, p53 pathway status in ccRCC lines. g, j, Immunoblot analysis of the indicated cell lines treated for 16 hours with etoposide or vehicle. Note overproduction of p53 in RCC10 cells and off-size p53 band in UMRC-2 cells. SLR21 cells are VHL+/+. Red = PT2399 sensitive in soft agar assays. Blue = PT2399 insensitive. RCC4 cells do not form soft agar colonies and are therefore indeterminate. h, Immunoblot analysis of 786-O cells that were infected with an empty lentivirus conferring puromycin resistance and then later found to have spontaneously acquired a p53 mutation (R248W) compared to cells that retained wild-type p53. Cells were treated with PT2399 for 48 hours or with nutlin-3 (30 μM) or etoposide (20 μM) for 16 hrs. i, soft agar colony formation from cells in (h) treated with PT2399; n=3 biological replicates. k, Immunoblot analysis of parental 786-O cells that underwent CRISPR-based gene editing with a control sgRNA or HIF2α sgRNA (guide 6) (as in Extended Data Fig. 2a) then treated with PT2399 for 58 hours or treated with nutlin-3 (30 μM) or etoposide (20 μM) for 10 hrs.
Extended Data Figure 10. Loss of HIF2α does not suppress UMRC-2 orthotopic tumor growth.
a–c, Tumors (a), tumor weights (b), and tumor immunoblots (c) at necropsy from mice after orthotopic injection of UMRC-2 cells that had undergone CRISPR-based editing with sgControl or sgHIF2α-6 as in Fig. 5g; sgCon, n=5 and sgHIF2α, n=5 mice from two independent experiments. The reason for the variable HIF2α levels in (c) is unknown but could reflect, at least partly, variable amounts of host-derived cells in the tumor samples. d, Levels of the indicated mRNAs, normalized to beta actin, in tumors from a–c. Data as median with range (b, d). Statistical significance was assessed by using two-tailed Student’s t-tests (b) or Mann-Whitney test (d). Loss of HIF2α did suppress subcutaneous tumor growth (data not shown).
Supplementary Material
Figure 6.
Acknowledgments
We thank Dr. Joan Massague for 786-M1A and M2A cells. Supported by grants from NIH. WGK is an HHMI Investigator. R.K.B. is the Michael L. Rosenberg Scholar in Medical Research and was supported by the Cancer Prevention and Research Institute of Texas (RP130513).
Footnotes
RCSB PDB ID for PT2399:HIF2A-PASB*:ARNT-PASB*: 5T0T.
CONTRIBUTIONS
W.G.K conceived the study, analyzed data and, with H.C., wrote the manuscript; H.C. designed and did all of the experiments, except for the structural, ITC, and PK studies and the experiments for Extended Data Figs. 1c and e; X.D. generated protein, performed ITC experiments and collected and solved the HIF2:PT2399 co-crystal structure; J.P.R., J.A.J and E.M.W. coordinated discovery, synthesis and characterization of PT2399; J.A.J. and E.M.W. designed the PDX experiment; E.L assisted with lung colonization assays; A.A.C did bioinformatic analyses; W.G designed and generated CRISPR reagents; I.C. and S.S. performed and analyzed immunohistochemistry; R.B. designed the PT2399-resistant HIF2α.
COMPETING FINANCIAL INTERESTS
X.D., J.P.R., R.B., J.A.J, E.M.W., and W.G.K. own equity in Peloton as Peloton employees (X.D., J.P.R., J.A.J., and E.M.W), licensors (R.B), or advisors (R.B. and W.G.K.).
References
- 1.Kaelin W. Kidney Cancer: Principles and Practice. Vol. 3. Springer International Publishing; 2015. pp. 31–57. [Google Scholar]
- 2.Scheuermann TH, et al. Artificial ligand binding within the HIF2alpha PAS-B domain of the HIF2 transcription factor. Proc Natl Acad Sci U S A. 2009;106:450–455. doi: 10.1073/pnas.0808092106. [DOI] [PMC free article] [PubMed] [Google Scholar]
- 3.Scheuermann TH, et al. Allosteric inhibition of hypoxia inducible factor-2 with small molecules. Nat Chem Biol. 2013;9:271–276. doi: 10.1038/nchembio.1185. [DOI] [PMC free article] [PubMed] [Google Scholar]
- 4.Rogers JL, et al. Development of inhibitors of the PAS-B domain of the HIF-2alpha transcription factor. J Med Chem. 2013;56:1739–1747. doi: 10.1021/jm301847z. [DOI] [PMC free article] [PubMed] [Google Scholar]
- 5.DIXON DD, et al. ARYL ETHERS AND USES THEREOF. 2015035223. WO. 2015
- 6.Wallace EM, et al. Anti-Tumor Activity of a Small Molecule Hypoxia Inducible Factor-2α Antagonist in Models of Renal Cell Carcinoma. Cancer Research. Under Review. [Google Scholar]
- 7.Gordan JD, et al. HIF-alpha effects on c-Myc distinguish two subtypes of sporadic VHL-deficient clear cell renal carcinoma. Cancer Cell. 2008;14:435–446. doi: 10.1016/j.ccr.2008.10.016. [DOI] [PMC free article] [PubMed] [Google Scholar]
- 8.Gordan JD, Bertout JA, Hu CJ, Diehl JA, Simon MC. HIF-2alpha promotes hypoxic cell proliferation by enhancing c-myc transcriptional activity. Cancer Cell. 2007;11:335–347. doi: 10.1016/j.ccr.2007.02.006. [DOI] [PMC free article] [PubMed] [Google Scholar]
- 9.Iliopoulos O, Kibel A, Gray S, Kaelin WG. Tumor Suppression by the Human von Hippel-Lindau Gene Product. Nature Medicine. 1995;1:822–826. doi: 10.1038/nm0895-822. [DOI] [PubMed] [Google Scholar]
- 10.Kondo K, Kim WY, Lechpammer M, Kaelin WG., Jr Inhibition of HIF2alpha Is Sufficient to Suppress pVHL-Defective Tumor Growth. PLoS Biol. 2003;1:439–444. doi: 10.1371/journal.pbio.0000083. [DOI] [PMC free article] [PubMed] [Google Scholar]
- 11.Vanharanta S, et al. Epigenetic expansion of VHL-HIF signal output drives multiorgan metastasis in renal cancer. Nat Med. 2013;19:50–56. doi: 10.1038/nm.3029. [DOI] [PMC free article] [PubMed] [Google Scholar]
- 12.Shen C, et al. Genetic and Functional Studies Implicate HIF1alpha as a 14q Kidney Cancer Suppressor Gene. Cancer Discov. 2011;1:222–235. doi: 10.1158/2159-8290.CD-11-0098. [DOI] [PMC free article] [PubMed] [Google Scholar]
- 13.Chen W, et al. Targeting Renal Cell Carcinoma with a HIF-2 antagonist. Nature. doi: 10.1038/nature19796. Under Review. [DOI] [PMC free article] [PubMed] [Google Scholar]
- 14.Bertout JA, et al. HIF2alpha inhibition promotes p53 pathway activity, tumor cell death, and radiation responses. Proc Natl Acad Sci U S A. 2009;106:14391–14396. doi: 10.1073/pnas.0907357106. [DOI] [PMC free article] [PubMed] [Google Scholar]
- 15.Roberts AM, et al. Suppression of hypoxia-inducible factor 2alpha restores p53 activity via Hdm2 and reverses chemoresistance of renal carcinoma cells. Cancer Res. 2009;69:9056–9064. doi: 10.1158/0008-5472.CAN-09-1770. [DOI] [PMC free article] [PubMed] [Google Scholar]
- 16.Fay AP, et al. Whole-Exome Sequencing in Two Extreme Phenotypes of Response to VEGF-Targeted Therapies in Patients With Metastatic Clear-Cell Renal Cell Carcinoma. Journal of the National Comprehensive Cancer Network. :14. doi: 10.6004/jnccn.2016.0086. (in Press) [DOI] [PMC free article] [PubMed] [Google Scholar]
Associated Data
This section collects any data citations, data availability statements, or supplementary materials included in this article.


