Abstract
Aim
To longitudinally investigate retinal ganglion cell (RGC) expression of Thy-1, a cell-surface glycoprotein specifically expressed in RGCs, with a blue-light confocal scanning laser ophthalmoscope, following retinal ischaemia induced by acute elevation of intraocular pressure.
Methods
A blue-light confocal scanning laser ophthalmoscope (bCSLO, 460 nm excitation and 490 nm detection) was used to image Thy1-cyan fluorescent protein (CFP) mice before and weekly for 4 weeks after transiently elevating the intraocular pressure to 115 mm Hg for 45 min (n = 4) or 90 min (n = 5) to induce ischaemic injury. Corresponding retinal areas before and after the intraocular pressure (IOP) elevation, during the period of ischaemic reperfusion, were compared, and the fluorescent spots (Thy-1 expressing RGCs) were counted. The longitudinal profile of CFP-expressing RGCs was modelled with a linear regression equation. The spatial distribution of RGC damage was analysed in the superior, nasal, inferior and temporal quadrants of the retina.
Results
No significant change was found at 4 weeks after 45 min of IOP elevation (n = 4, p = 0.465). The average RGC densities before and 4 weeks after IOP elevation were 1660 (SD 242) cells/mm2 and 1624 (209) cells/mm2, respectively. However, significant loss of CFP-expressing RGCs was detected at 1 week following 90 min of IOP elevation (n = 5, p<0.001). After this initial RGC loss, no significant change was detected subsequently. The proportion of RGC fluorescence remaining was variable and ranged from 14.5% to 79.5% at 4 weeks after the IOP elevation. The average RGC densities before and 4 weeks after IOP elevation were 1443 (162) cells/mm2 and 680 (385) cells/mm2, respectively. Diffuse loss of fluorescent RGCs was observed in the spatial distribution analysis.
Conclusions
The longitudinal profile of Thy-1 expressing RGC fluorescence loss after ischaemic injury is non-progressive and unrelated to the duration of reperfusion.
Retinal ischaemia is an important cause of visual impairment in retinal vascular occlusion, diabetic retinopathy and acute angle closure. In experimental studies, loss of retinal ganglion cells (RGCs) and their axonal fibres has been demonstrated after retinal ischaemic reperfusion injury.1–4 Nevertheless, the time course and spatial distribution of RGC loss that follow retinal ischaemia are less well defined. It has been suggested that RGCs undergo delayed death after retinal ischaemia and that a longer duration of reperfusion might lead to more extensive loss of RGC.2,3 However, because of the lack of an experimental model that could serially monitor the same RGCs, it has been difficult to evaluate the longitudinal profile of RGC degeneration precisely.
One approach to study RGC degeneration following retinal ischaemia is to measure the retinal levels of Thy-1 expression.1,5 Thy-1 is a cell-surface glycoprotein specifically expressed in RGCs.6 It has been shown that Thy-1 mRNA decreased to less than 60% relative to the control eyes after 60 min of high intraocular pressure (IOP) induced ischaemia followed by 7 days of reperfusion.1 It was proposed that studying Thy-1 expression provides a powerful way to monitor the biochemical changes of RGC induced by ischaemia.5 We have developed a confocal scanning laser ophthalmoscope (blue-light CSLO or bCSLO) to visualise the expression of Thy-1 in RGCs in a strain of transgenic mice expressing cyan fluorescent protein (CFP) under the control of Thy-1 promoter.7 With this technique, the expression of CFP in individual RGCs can be serially followed and monitored. The goal of this study is to characterise the longitudinal profile and pattern of CFP- expressing RGC fluorescence following high-IOP-induced ischaemic injury and to investigate if RGC survival is related to the duration of reperfusion following the ischaemia.
MATERIALS AND METHODS
Blue light confocal scanning laser ophthalmoscope (bCSLO) imaging
The methods of bCSLO imaging have been described.7 The instrument was modified to visualise cyan fluorescent protein (460 nm excitation and 490 nm detection). During imaging with the bCSLO, the mice were held steady by an assistant. Pupils were dilated with topical mydriatic agents (tropicamide and phenylephrine, 0.5% each) to about 2 mm in diameter. The imaging was non-invasive and non-contact. No anaesthesia was required. The scan rate of the bCSLO is 12 frames per second with a resolution of 512×512 pixels covering an area of 30° field of view per image frame, which represents about 13% of total retinal area.19 For longitudinal analysis of RGC degeneration, corresponding retinal areas in 30° field of view in which the cells are in focus before and after ischaemic injury were compared, and the fluorescent spots were counted manually. For the estimation of cell density, the retinal calibration is based on a schematic eye model for the C57BL/6J mouse derived by Remtulla and Hallett.8 It was estimated that 1° of field is subtended by 30 μm of retina at λ = 488 nm. The spatial distribution of RGC loss was examined with retinal montages constructed from multiple bCSLO images covering a retinal area of approximately 2×2 mm2 with centre at the optic disc before and 2–3 weeks after the ischaemic injury. Thy-1 expressing RGCs at the superior, nasal, inferior and temporal quadrants were counted and analysed respectively.
Experimental animals
Animals used in this study were treated in accordance with the ARVO Statement for the Use of Animals in Ophthalmic and Vision Research. Transgenic mice in which Thy-1 promoter sequences drive expression of the enhanced cyan fluorescent protein (CFP), designated B6.Cg-TgN (Thy1-CFP) 23Jrs, were generated by Feng and assoicates.9 Breeding pairs of Thy1-CFP mice were obtained from the Jackson laboratory (Bar Harbor, Maine). Homozygous mating pairs were used to expand the number of mice used for analysis. The mice were maintained in standard housing with white pine shavings for bedding. The environment was kept at 21°C with a 12 h light and 12 h dark cycle. All mice were fed with ad libitum.
Ischaemic-reperfusion injury with acute intraocular pressure elevation
Retinal ischaemia was induced by elevation of intraocular pressure. After anaesthetising the mice (aged 9–12 months) by intraperitoneal injection ketamine (100 mg/kg, Ketaset, Fort Dodge Animal Health, Fort Dodge, Iowa) and xylazine (9 mg/kg, TranquiVed, Vedco, St Joseph, Missouri), the anterior chamber was cannulated with a fine glass pipette connected by polyethelyne tubing to a pressure transducer and a reservoir containing phosphate-buffered saline. The intraocular pressure was raised to 115 mm Hg by elevating the reservoir for 45 (n = 4) or 90 (n = 5) min. At the end of the ischaemic period, the glass pipette was removed. Topical antibiotic and steroid ointment (TobraDex, Alcon Laboratories, Fort Worth, Texas) was applied to the conjunctival sac.
Statistical analysis
The relative densities (%) of fluorescent spots in corresponding retinal areas were calculated before and after the ischaemic injury. Wilcoxon signed ranks test and the Freidman test were used to evaluate the differences of surviving proportion of RGCs. The Freidman test was also used to examine the differences in the spatial distribution of CFP-expressing RGCs after the ischaemic injury. The longitudinal profile of RGC degeneration after the ischaemic injury was fitted with a linear regression model. A p value of <0.05 was considered to be statistically significant.
RESULTS
Longitudinal profile of RGC degeneration after ischaemic reperfusion injury
Thy-1 expressing RGCs were detected by the bCSLO as individual fluorescent spots (fig 1). These fluorescent spots had round cell bodies, although the dendritic structures were not readily visible. The retinal blood vessels were visible as dark trajectories in the bCSLO image. The average RGC density was approximately 1539 (SD 219) cells/mm2 (n = 9). With an estimated total retinal area of 18.48 mm2,8 the total number of RGCs was about 28 441 (4047).
Figure 1.
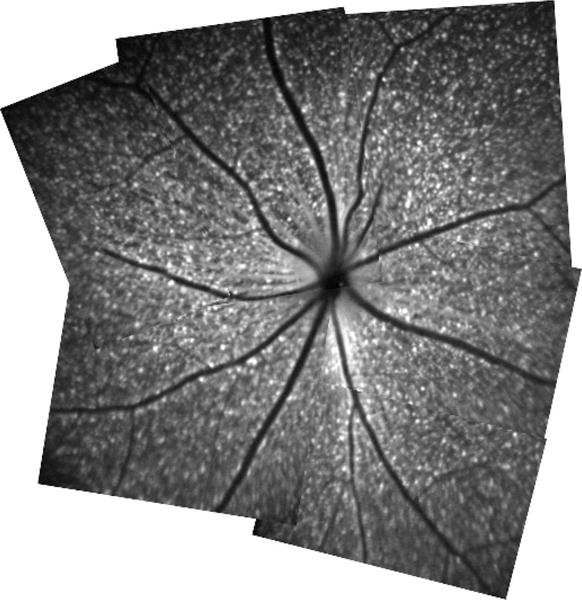
Retinal montage constructed from multiple in vivo blue-light confocal scanning laser ophthalmoscopy images. Each fluorescent spot represents Thy-1 expressing retinal ganglion cell.
There was no significant change in the number of RGC 4 weeks after 45 min of IOP elevation at 115 mm Hg (p = 0.465, n = 4) (fig 2). The average RGC densities before and 4 weeks after IOP elevation were 1660 (242) cells/mm2 and 1624 (209) cells/mm2, respectively (table 1). In contrast, all of the tested eyes showed a significant decrease in RGCs (p<0.001, n = 5) after 90 min of IOP elevation (fig 3). No significant change was detected thereafter measured at weeks 2, 3 and 4 (p = 0.648). The average RGC densities reduced from 1443 (162) cells/mm2 to 680 (385) cells/mm2 at week 4 after the IOP elevation (table 1). The number of RGCs before and 4 weeks after IOP elevation is shown in table 1. Figure 4 shows the longitudinal profile of proportion of RGC fluorescence loss relative to baseline measurements in the same eyes (obtained prior to surgery) for each of the mice that had RGC loss. The magnitude of RGC loss was variable with the proportion of remaining CFP expressing RGCs measured at week 4 ranging from 14.5% to 79.5%. A linear regression model was used to fit the relationship between proportion of RGC fluorescence loss after the first week of ischaemic reperfusion injury and the time of measurement (fig 5). The slope of the linear regression equation was −0.001 (0.047) with a 95% confidence interval between −0.099 and 0.097 (p = 0.981, n = 5) suggesting that the RGC damage was not progressive.
Figure 2.
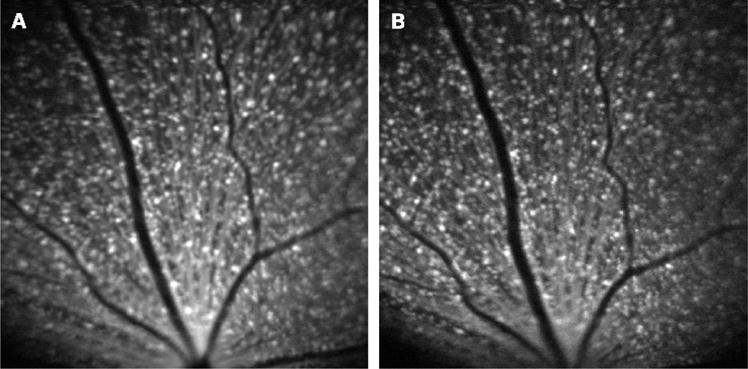
In vivo blue-light confocal scanning laser ophthalmoscope images in the same retinal area of a transgenic Thy1-cyan fluorescent protein mouse (A) before and (B) 4 weeks after elevation of intraocular pressure to 115 mm Hg for 45 min. No significant change in the number of retinal ganglion cells was found.
Table 1.
Summary of retinal ganglion cell density before and 4 weeks after ischaemic reperfusion injury
| Mouse | Baseline (cells/mm2) | 4 weeks post intraocular pressure elevation (115 mm Hg for 90 min) (cells/mm2)(% remaining) | Mouse | Baseline (cells/mm2) | 4 weeks post intraocular pressure elevation (115 mm Hg for 45 min) (cells/mm2) (% remaining) |
|---|---|---|---|---|---|
| (a) | 1526 | 1213 (79.5%) | (a) | 1738 | 1631 (93.8%) |
| (b) | 1333 | 893 (67.0%) | (b) | 1686 | 1775 (105.3%) |
| (c) | 1275 | 527 (41.3%) | (c) | 1322 | 1326 (100.3%) |
| (d) | 1680 | 562 (33.5%) | (d) | 1893 | 1765 (93.2%) |
| (e) | 1399 | 203 (14.5%) |
Figure 3.

In vivo blue-light confocal scanning laser ophthalmoscope images in the same retinal area of a transgenic Thy1-cyan fluorescent protein mouse (A) before and (B) 2 weeks and (C) 4 weeks after elevation of intraocular pressure to 115 mm Hg for 90 min. There were 66%, 63%, 67%, 67% of retinal ganglion cells remaining at 1, 2, 3 and 4 weeks after the ischaemic injury, respectively.
Figure 4.
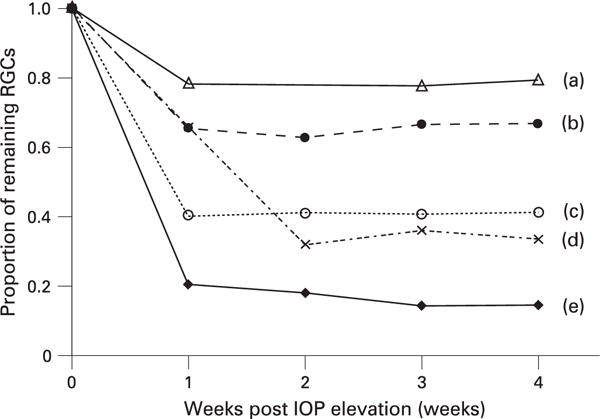
Longitudinal profile of retinal ganglion cell (RGCs) loss in five mice after acute elevation of intraocular pressure (IOP) at 115 mm Hg for 90 min. For mouse (d), images captured at the 1st week after the ischaemic injury were not analysed because of poor image quality secondary to residual intraocular inflammation. For mouse (a), no image was captured at the 2nd week.
Figure 5.
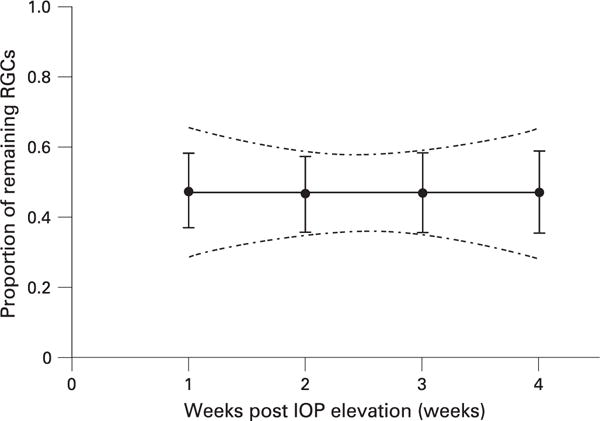
Relationship between the proportion of retinal ganglion cells (RGCs) loss and time (week) following ischaemic reperfusion injury, evaluated using linear regression analysis. The best-fit line (y = −0.001×+0.474) and the 95% confidence band are shown. The 95% confidence interval of the slope was estimated at −0.099 to 0.097. IOP, intraocular pressure.
Spatial distribution of RGC loss after ischaemic reperfusion injury
Different retinal locations in the same eyes were imaged before and 2–3 weeks after the IOP elevation. Retinal montages were constructed from multiple bCSLO images and divided equally into superior, nasal, inferior and temporal quadrants in an area of approximately 2×2 mm2. There was no spatial distribution difference in fluorescent RGC loss among the four quadrants (p = 0.564) (fig 6).
Figure 6.
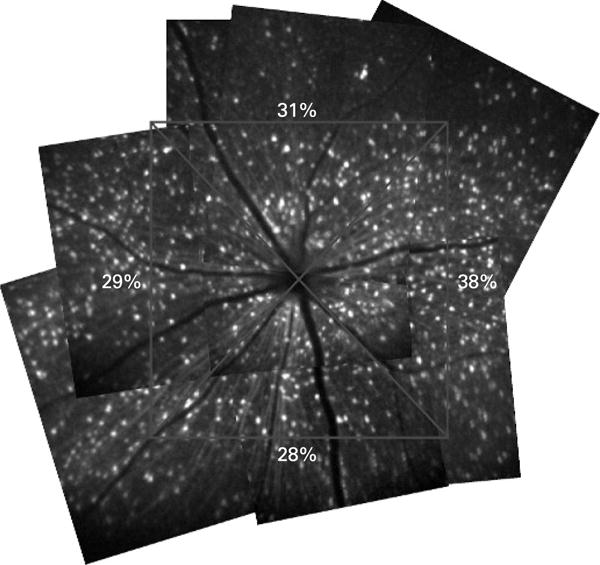
Retinal montages showing diffuse loss of retinal ganglion cells (RGCs) after ischaemic reperfusion injury. The spatial distribution of RGC loss was examined with retinal montages constructed from multiple blue-light confocal scanning laser ophthalmoscope images covering a retinal area of approximately 2×2 mm2 with centre at the optic disc. The remaining proportions of RGCs in each quadrant are shown.
DISCUSSION
In vivo bCSLO imaging provides a novel approach to monitor Thy-1 expression in RGCs longitudinally. In this study, we demonstrated that loss of RGC Thy-1 expression was evident after ischaemic reperfusion injury, and the loss is generally non-progressive. This result suggests that the duration of reperfusion after ischaemic injury in this model is unlikely to be related to the extent of RGC damage.
The use of Thy1 CFP mouse strain has been shown useful for investigations requiring identification of RGCs. In a validation study, we reported that over 95% of CFP expressing cells were also retrogradely labelled.7 In a recent histochemical study, Raymond et al characterised CFP expression in the retina of Thy-1 CFP mice with a number of independent RGC and amarcine cell markers and concluded that most RGCs also express CFP.10 Although about 20% of CFP expressing cells were found to be immunolabelled with choline acetyltransferase, the observation that 9.6% of CFP cells were immunolabelled with HPC-1, a general amacrine and displaced amacrine cell marker, is in agreement with our finding. Genetic variability between inbred mouse strains, tissue processing and sampling methods may account for the differences of CFP expression in RGCs between the two studies.
High IOP-induced retinal ischaemia in mice is a well-established model to study RGC degeneration.1–5 Most studies typically cannulated the anterior chamber to elevate the IOP above 110 mm Hg so that the IOP is above the ocular perfusion pressure with total occlusion of retinal and choroidal circulation. While it has been reported that at least 20 min were required to induce irreversible functional loss of the retina recorded by electroretinogram (ERG),1 observable histological change was evident only after elevating the IOP above 110 mm Hg for at least 60 min.2 In the study by Sellés-Navarro et al, 63% of retrograde labelled RGCs remained at 1 week following 60 min of pressure induced ischaemia.2 Although Osborne and Larsen did not find any significant histological change in the retina 7–10 days after elevating the IOP to 120 mm Hg for 60 min, they showed that Thy-1 expression was reduced in these retinas using immunohistochemical staining.5 Likewise, Chidlow and Osborne showed that there was reduced immunohistochemical staining of Thy-1 and NF-L, as well as their mRNA levels, after ischaemic reperfusion injury.11 In agreement with their studies, we demonstrated loss of Thy-1 CFP-expressing RGCs imaged with bCSLO after pressure-induced ischaemia. More importantly, the longitudinal profile of RGC damage, as measured by the reduction in CFP expression and which is likely related to Thy-1 expression, can be characterised longitudinally with bCSLO imaging. This capability cannot be achieved by histological, biochemical or molecular analysis of the retina.
The present results indicate that following the initial damage that occurs within the first week after ischaemia, there is no further RGC damage. The number of CFP-expressing RGCs remained largely unchanged from week 1 onwards after the ischaemic injury. In other words, the RGC damage appears to be independent of the duration of reperfusion. This finding is different from the previous studies showing that RGC loss was progressive after retinal ischaemia, and such loss was related to the duration of reperfusion.2,3 However, it is worth noting that loss of Thy-1 expression in RGCs does not necessarily indicate loss of RGCs. Differences in species and methods of anaesthesia may also result in different profiles of RGC degeneration.12 Furthermore, in these studies, retinal ischaemia was induced by ligation of ophthalmic vessels3 or applying traction over the eyeball.2 These procedures may induce additional stress or trauma to the optic nerve. In addition, the contralateral eyes were used as controls to estimate the proportional loss of RGCs on the damaged eye. It is conceivable that serial analysis in the same eyes would provide a more accurate and reliable approach to measure the change.
The longitudinal profile of RGC damage following ischaemic reperfusion injury is different to that obtained following optic nerve crush in which the loss of Thy-1 expressing RGCs is progressive.13 It is uncertain which mediators are involved in sustaining the progressive damage of RGCs. While the release of toxic mediators from the primary injured RGCs or activated microglia, oxidative stress-induced dysfunction of glial cells and activation of autoimmune response may be responsible for spreading RGC damage by secondary degeneration,14 the exact cellular and molecular mechanisms in directing the time course of RGC degeneration following retinal ischaemia and optic nerve crush remained to be determined.
It has been shown that retinal damage was irregular with patchy areas of tissue preservation and injury after pressure-induced ischaemia.15 Sampling small area of histological sections could thus lead to an inaccurate estimation of the damage. In this study, spatial analysis on the bCSLO retinal montages did not reveal any significant difference in fluorescent RGC density among superior, nasal, inferior and temporal quadrants. Of note, localised loss of RGCs may be difficult to visualise if the corresponding retinal areas before the injury were not available. Previous studies on regional damage of RGC were primarily based on histological examination on retinal flat mount or cross-sections of the optic nerve.16,17 Cioffi et al showed that localised damage of the optic nerve occurred at varying regions in a model of chronic optic nerve ischaemia.16 Using a rat glaucoma model, Mittag et al demonstrated variable focal loss of RGCs with retinal flatmounts.17 While the mechanisms leading to RGC death may be different between acute retinal ischaemia, chronic optic nerve ischaemia and glaucoma, regional differences in vascular supply, cellular metabolism and susceptibility to pressure gradient may contribute to diffuse or localised damage observed in different types of RGC degeneration.17
We observed a variable degree of fluorescent RGC loss even when the eyes were subject to the same level of ischaemic insult. The finding that the contralateral control eyes demonstrated no significant change suggests that experimental manipulation other than IOP elevation did not contribute to fluorescent RGC loss. In fact, a wide range of percentage of RGC loss was also evident in the study by Sellés-Navarro et al2 in which 20% to 72% loss of RGCs was reported a week after pressure-induced ischaemia for a duration of 105 min. In contrast to histological or biochemical methods, the bCSLO imaging method has the advantage of being non-contact and non-invasive. In vivo retinal images of RGCs can be captured within seconds without anaesthesia. In contrast to retrograde labelling techniques in which microglial cells would also become fluorescent after phagocytosing cell debris of RGCs, it is likely that the degradation of CFP inside the RGCs occurs prior to phagocytosis by microgia because no new fluorescent spot appeared after the ischaemic injury. While specialised software and image editing may be required to differentiate RGCs and microglia after optic nerve crush with the technique of retrograde labelling,18 analysis of the bCSLO images can be performed without further image processing. The major limitation for in vivo imaging is the potential development of media opacity during the course of the study. Intraocular procedures, including cannulation of the anterior chamber, occasionally induce variable degree of intraocular inflammation and cataract, which might degrade the image quality. Blue light exposure with bCSLO imaging is unlikely to cause cataract formation. In a recent study, we showed that repeated bCSLO imaging over a year is possible without formation of any media opacity.9 Although a long duration (from few hours to few days) of blue light exposure has been shown to induce apoptosis of RGCs and reduce visual function,19–21 the short duration for bCSLO imaging in our study (with a scan speed of 12 frames per second) is unlikely to induce RGC damage. Further investigation is needed to evaluate the safety of bCSLO imaging.
In summary, in vivo bCSLO imaging of Thy-1 expressing RGCs offers a unique opportunity to longitudinally study RGC damage. As loss of Thy-1 expression precedes loss of RGC bodies, monitoring CFP expression in RGCs in Thy1-CFP mice thereby provides a sensitive method to indicate RGC stress.22 In contrast to the progressive damage of RGC after optic nerve crush, the longitudinal profile of RGC damage after ischaemic reperfusion injury is largely non-progressive. In vivo bCSLO imaging may serve as an important model to characterise the longitudinal profile of different types of acute and chronic optic neuropathy and to evaluate treatment effects on the course of disease.
Acknowledgments
Funding: Supported in part by National Eye Institute Grants EY11008 (JDL) and EY014661 (JDL)
Footnotes
Competing interests: RW received research instruments from Heidelberg Engineering.
References
- 1.Osborne NN, Casson RJ, Wood JP, et al. Retinal ischemia: mechanisms of damage and potential therapeutic strategies. Prog Retin Eye Res. 2004;23:91–147. doi: 10.1016/j.preteyeres.2003.12.001. [DOI] [PubMed] [Google Scholar]
- 2.Sellés-Navarro I, Villegas-Pérez MP, Salvador-Silva M, et al. Retinal ganglion cell death after different transient periods of pressure-induced ischemia and survival intervals. A quantitative in vivo study Invest Ophthalmol Vis Sci. 1996;37:2002–14. [PubMed] [Google Scholar]
- 3.Lafuente MP, Villegas-Pérez MP, Sellés-Navarro I, et al. Retinal ganglion cell death after acute retinal ischemia is an ongoing process whose severity and duration depends on the duration of the insult. Neuroscience. 2002;109:157–68. doi: 10.1016/s0306-4522(01)00458-4. [DOI] [PubMed] [Google Scholar]
- 4.Adachi M, Takahashi K, Nishikawa M, et al. High intraocular pressure-induced ischemia and reperfusion injury in the optic nerve and retina in rats. Graefes Arch Clin Exp Ophthalmol. 1996;234:445–51. doi: 10.1007/BF02539411. [DOI] [PubMed] [Google Scholar]
- 5.Osborne NN, Larsen AK. Antigens associated with specific retinal cells are affected by ischaemia caused by raised intraocular pressure: effect of glutamate antagonists. Neurochem Int. 1996;29:263–70. doi: 10.1016/0197-0186(96)00005-8. [DOI] [PubMed] [Google Scholar]
- 6.Barnstable CJ, Drager UC. Thy-1 antigen: a ganglion cell specific marker in rodent retina. Neuroscience. 1984;11:847–55. doi: 10.1016/0306-4522(84)90195-7. [DOI] [PubMed] [Google Scholar]
- 7.Leung CK, Lindsey JD, Crowston JG, et al. In vivo imaging of murine retinal ganglion cells. J Neurosci Meth. 2008;168:475–8. doi: 10.1016/j.jneumeth.2007.10.018. [DOI] [PubMed] [Google Scholar]
- 8.Remtulla S, Hallett PE. A schematic eye for the mouse, and comparisons with the rat. Vision Res. 1985;25:21–31. doi: 10.1016/0042-6989(85)90076-8. [DOI] [PubMed] [Google Scholar]
- 9.Feng G, Mellor RH, Bernstein M, et al. Imaging neuronal subsets in transgenic mice expressing multiple spectral variants of GFP. Neuron. 2000;28:41–51. doi: 10.1016/s0896-6273(00)00084-2. [DOI] [PubMed] [Google Scholar]
- 10.Raymond ID, Vila A, Huynh UC, et al. Cyan fluorescent protein expression in ganglion and amacrine cells in a thy1-CFP transgenic mouse retina. Mol Vis. 2008;14:1559–74. [PMC free article] [PubMed] [Google Scholar]
- 11.Chidlow G, Osborne NN. Rat retinal ganglion cell loss caused by kainate, NMDA and ischemia correlates with a reduction in mRNA and protein of Thy-1 and neurofilament light. Brain Res. 2003;963:298–306. doi: 10.1016/s0006-8993(02)04052-0. [DOI] [PubMed] [Google Scholar]
- 12.Ozden S, Isenmann S. Neuroprotective properties of different anesthetics on axotomized rat retinal ganglion cells in vivo. J Neurotrauma. 2004;21:73–82. doi: 10.1089/089771504772695968. [DOI] [PubMed] [Google Scholar]
- 13.Leung CK, Lindsey JD, Crowstan JN, et al. Longitudinal profile of retinal ganglion cell degeneration after optic nerve crush—a blue-light confocal scanning laser ophthalmoscope imaging study. Invest Ophthalmol Vis Sci. 2008;49:4898–902. doi: 10.1167/iovs.07-1447. [DOI] [PMC free article] [PubMed] [Google Scholar]
- 14.Tezel G, Yang X, Luo C, et al. Mechanisms of immune system activation in glaucoma: oxidative stress-stimulated antigen presentation by the retina and optic nerve head glia. Invest Ophthalmol Vis Sci. 2007;48:705–14. doi: 10.1167/iovs.06-0810. [DOI] [PMC free article] [PubMed] [Google Scholar]
- 15.Marmor MF, Dalal R. Irregular retinal and RPE damage after pressure-induced ischemia in the rabbit. Invest Ophthalmol Vis Sci. 1993;34:2570–5. [PubMed] [Google Scholar]
- 16.Cioffi GA, Wang L, Fortune B, et al. Chronic ischemia induces regional axonal damage in experimental primate optic neuropathy. Arch Ophthalmol. 2004;122:1517–25. doi: 10.1001/archopht.122.10.1517. [DOI] [PubMed] [Google Scholar]
- 17.Mittag TW, Danias J, Pohorenec G, et al. Retinal damage after 3 to 4 months of elevated intraocular pressure in a rat glaucoma model. Invest Ophthalmol Vis Sci. 2000;41:3451–9. [PubMed] [Google Scholar]
- 18.Higashide T, Kawaguchi I, Ohkubo S, et al. In vivo imaging and counting of rat retinal ganglion cells using a scanning laser ophthalmoscope. Invest Ophthalmol Vis Sci. 2006;47:2943–50. doi: 10.1167/iovs.05-0708. [DOI] [PubMed] [Google Scholar]
- 19.Wu J, Seregard S, Spångberg B, et al. Blue light induced apoptosis in rat retina. Eye. 1999;13:577–83. doi: 10.1038/eye.1999.142. [DOI] [PubMed] [Google Scholar]
- 20.Osborne NN, Li GY, Ji D, et al. Light affects mitochondria to cause apoptosis to cultured cells: possible relevance to ganglion cell death in certain optic neuropathies. J Neurochem. 2008;105:2013–28. doi: 10.1111/j.1471-4159.2008.05320.x. [DOI] [PubMed] [Google Scholar]
- 21.Berninger TA, Canning CR, Gündüz K, et al. Using argon laser blue light reduces ophthalmologists’ color contrast sensitivity. Argon blue and surgeons’ vision. Arch Ophthalmol. 1989;107:1453–8. doi: 10.1001/archopht.1989.01070020527032. [DOI] [PubMed] [Google Scholar]
- 22.Schlamp CL, Johnson EC, Li Y, et al. Changes in Thy1 gene expression associated with damaged retinal ganglion cells. Mol Vis. 2001;7:192–201. [PubMed] [Google Scholar]


