

Abstract
The western honeybee, Apis mellifera is a prominent model organism in the field of sociogenomics and a recent upgrade substantially improved annotations of the reference genome. Nevertheless, genome assemblies based on short-sequencing reads suffer from problems in regions comprising e.g. multi-copy genes. We used single-molecule nanopore-based sequencing with extensive read-lengths to reconstruct the organization of the major royal jelly protein (mrjp) region in three species of the genus Apis. Long-amplicon sequencing provides evidence for lineage-specific evolutionary fates of Apis mrjps. Whereas the most basal species, A. florea, seems to encode ten mrjps, different patterns of gene loss and retention were observed for A. mellifera and A. dorsata. Furthermore, we show that a previously reported pseudogene in A. mellifera, mrjp2-like, is an assembly artefact arising from short read sequencing.
Keywords: MinION™, gene duplication, Apis mellifera, Apis florea, Apis dorsata
1. Introduction
The emergence of second-generation sequencing technologies has led to an accumulation of genome sequence data providing broad access to reference genomes and thus, depicting important resources for addressing evolutionary questions. However, the quality of reference genome assemblies often suffers from short-sequencing reads and even sophisticated assembly algorithms can struggle with repetitive and duplicated regions, either not detecting specific stretches or artificially duplicating polymorphic regions.1–3
In the western honeybee Apis mellifera, the major royal jelly protein (mrjp) gene cluster provides an excellent system to test for assembly problems in regions comprising multi-copy genes. The gene cluster is located on chromosome 11 between two yellow genes (y-e3 and y-h)4,5 consisting of nine protein coding genes mrjp1 to 9 and one pseudogene – mrjp-Ψ, recently renamed into mrjp2-like.4–7 All major royal jelly proteins (MRJP) show a remarkable pairwise identity ranging from 47% to 74%8 and have mostly been identified in royal jelly (RJ),9,10 a hypopharyngeal gland secretion produced by nurse bees feeding the brood.11 In A. mellifera, the RJ-feeding regime determines the prospective caste (queen or worker) of developing female larvae and although it has been under discussion that a specific MRJP in RJ might interfere with queen determination there is according to newer investigations no indication that MRJPs transcend the long proposed nutritional value in RJ.6,12
Whereas the nine mrjps found in the genome have been confirmed on mRNA and protein level in A. mellifera,10,13 similar information about the mrjps in other honeybee species is missing and only available for some mrjp homologues.14–17 Based on draft genome sequences, first insights in the gene cluster organization of the most basal species A. florea suggested a highly conserved gene order except for the position of the pseudogene (mrjp-Ψ/2-like).8 However, because mrjps have all evolved from the same yellow gene, they share high-sequence similarity and structural resemblance4: a challenge for an accurate assembly of this complex region based on short sequence reads. And indeed, in A. mellifera certain indications for local mis-assemblies are given: nearly identical sequence stretches of two adjacently located genes, the pseudogene mrjp2-like (GB55211) and mrjp2 (GB55212), provide evidence for artificially duplicated regions present in the current gene cluster assembly (Supplementary Fig. S1). In addition, Sanger sequencing of mrjp2 revealed the absence of a duplicated 430 bp region (GenBank: KX951418; Supplementary Fig. S2). These hints indicate that the currently available mrjp cluster sequence might have suffered from short-sequencing read assembly mistakes due to repetitive and duplicated regions.
Sequencing technologies that allow for extensive read lengths, as e.g. PacBio® or Illumina® TruSeq Synthetic Long-Read, provide unprecedented power to improve genome assemblies18,19 and to solve assembly problems even in highly repetitive and/or duplicated regions. An alternative to these established long-read sequencing technologies is the MinIONTM sequencer (Oxford Nanopore Technologies Ltd), which uses a very different sequencing strategy. This technique facilitates sequencing through pore-forming proteins (so-called nanopores) that naturally act as ion or small molecule channels, embedded in a polymer membrane. Upon applying voltage across the membrane, the nanopore is passed by ionic current which is in turn subject to characteristic interruptions dependent on the DNA base crossing the pore. In contrast to next-generation sequencing usually based on DNA fragments of 200–400 consecutive bases which are later on assembled, nanopores allow for sequencing of long DNA strands in one piece currently limited to a length of approximately 200,000 bases.20 Thus, assembly caused problems do not even occur in the first place and if amplicon sequencing is performed read lengths are rather limited by PCR restrictions than by the sequencing itself. We here validate and reconstruct the genomic organization of the mrjp region by combining long-range PCR and long-read nanopore sequencing to investigate synteny of mrjp genes between the three honeybee species, Apis mellifera, Apis florea and Apis dorsata.
2. Material and methods
2.1. Samples and DNA extraction
Gene order conservation of the mrjp gene cluster was analyzed in three species of the genus Apis: A. mellifera carnica (Halle/Saale, Germany, 2014), A. dorsata (Manaol, Phillipines, 2013) and A. florea (Dien Bien, Vietnam, 2013), each represented by a single worker. Genomic DNA was extracted from thoraces using phenol/chloroform extraction. DNA purity was determined using the NanoDrop ND-1000 (Peqlab, Erlangen, Germany).
2.2. PCR/purification
DNA primers (Metabion, Planegg, Germany) were designed using Primer321 spanning at least two neighbouring genes. Primer sequences are reported in Table 1. PCR conditions were 94 °C for 1 min; 35 cycles at 98 °C for 10 s; 66 °C for 15 s; 68 °C for 1 min/kb; with a final elongation at 68 °C for 16 min. Each 10 µl reaction contained 8.0 mM dNTPs, 0.3 µM of each gene-specific forward and reverse primer, 0.25 U of PrimeSTAR GXL DNA Polymerase (Takara Bio Europe/S.A.S., Saint-Germain-en-Laye, France) and 1 µL DNA. Fragment sizes were inspected on a 0.7% TAE agarose gel. PCR products were purified using Agencourt AMPure XP (Beckman Coulter GmbH, Krefeld, Germany). Quantity of purified amplicons was determined using ND-1000 (Peqlab, Erlangen, Germany). For some primer combinations, PCR amplification yielded an additional 2.5 – 3.0 kb PCR product (see Table 1 and Supplementary Fig. S3). Thus, we set a minimum read length of 6.5 kb to exclude reads possibly produced from these additional PCR products (see below).
Table 1.
Primers used for PCR and summary of MinIONTM read count
| Amplicon | Primer (sequence 5'–3') | Size (kb) | Selection criteria | Read count | |
|---|---|---|---|---|---|
| afAmp1 | F: | AAAGTGGTTGTTGCTGGTGG | 10.2a | Length: 0.7 Similarity: 0.6 | 38 |
| R: | CCTGATGTGATTTAGCTTTCGC | ||||
| afAmp2 | F: | GCTGAAGCGAGACACAAACA | 10.2 | 32 | |
| R: | TTGACCTTGGCCGCTTTTAG | ||||
| afAmp3 | F: | ACTCGCGCATATATGTCACG | 9.8 | 100 | |
| R: | TGCAGACTGTTTTGTTTAACTCC | ||||
| afAmp4 | F: | TGTTGCAGTTCACATTCACTCT | 9.5 | 140 | |
| R: | CGTCACGTGTCATAATGGTTACT | ||||
| afAmp5 | F: | TCAGATCAATTTGCAAAGGAACA | 8.8 | 89 | |
| R: | TGAAGGCCATCGAAACTGAT | ||||
| afAmp6 | F: | TTGCCCAACCGTGACAATTC | 8.0 | 99 | |
| R: | CGATTAAGCAGCAGTAAAATCCA | (exp. 12.3) | |||
| amAmp1 | F: | AAAGTGGTTGTTGCTGGTGG | 9.1a | Length: 0.7 Similarity: 0.6 | 89 |
| R: | TATCGGGATTTTCGCAACGA | ||||
| amAmp2 | F: | ATCAAAGAGTGGCGTCCTCT | 10.7a | 79 | |
| R: | CAACTAGCGATACGGGTCCT | ||||
| amAmp3 | F: | TGTGAAGTACACGTCAATACCT | 9.5 | 61 | |
| R: | TCATGATGCCATGCTTAATTTTTGT | ||||
| amAmp4 | F: | TGAAGTACACGTCATTATCGCCT | 14.0 | 32 | |
| R: | CACGTGACACGATGATACTCGAT | (exp.22.0) | |||
| amAmp5 | F: | GCTCCAAAGTTGCACGTCTT | 10.8 | 79 | |
| R: | AGGAGTTGTGGAGGGCATAC | ||||
| amAmp6 | F: | CTCTTCTGGCACCGTATCCT | 12.1 | 16 | |
| R: | TTGATTTACAGGCGCATTCAAA | ||||
| adAmp1 | F: | AAAGTGGTTGTTGCTGGTGG | 10.7a | Length: 0.7 Similarity: 0.6 | 60 |
| R: | GAAGCAAGTGAAGTGTGATATGATT | ||||
| adAmp2 | F: | TATTTGGCCGATCGTTGGTC | 10.9a | 25 | |
| R: | TTCTGCCTGCATTTAATGTTTCA | ||||
| adAmp3 | F: | ACACGCGCATTTATGTCACG | 11.6 | Length: 0.5 Similarity: 0.5 | 37 |
| R: | GGAATACTTACTCGTGGCTGAT | ||||
| adAmp4 | F: | ACCGACCGTCAATCAAAATTCA | 10.5 | Length: 0.7 Similarity: 0.6 | 24 |
| R: | AAGTGAAGAGATGTGACAGAGAT | ||||
| adAmp5 | F: | ACACGTCATTACCGCCTATATAT | 10.3 | 76 | |
| R: | TCAAGTGTCATGATACGATGCT | ||||
| adAmp6 | F: | AGGTGTGACAAAGCTGACAA | 12.0 | Length: 0.5 Similarity: 0.5 | 40 |
| R: | GCCCGCTTAATTATCATACAGTT | (exp.14.9) | |||
| adAmp7 | F: | TTGCCCAACCGTGACAATTC | 12.0 | 42 | |
| R: | ATTCGGAAATGCAAGACGGC | ||||
For the location of the respective amplicons within the cluster see Fig. 3. Expected sizes were calculated based on the reference genomic sequences. The last column refers to the number of reads that mapped using the selection criteria given in the previous column. Due to assembly errors or sequencing gaps in reference sequences, selection criteria for adAmp3, adAmp6 and adAmp7 were less stringent compared to the other amplicons. Consensus calling was adjusted to the minimum number of reads (amAmp6: 16 reads).
aAmplification yielded an additional smaller PCR product (Supplementary Fig. S3).
2.3. Sequencing
Long-amplicon sequencing was performed with MinION (Oxford Nanopore Technologies Ltd)—a nanopore-based sequencing technology capable of producing read length s of up to 200 kb20,22,23 facilitating continuous sequencing across the entire mrjp cluster region.
Prior to MinION library preparation, amplicons were pooled in equimolar amounts. The amplicon pool was end-repaired using the NEBNext End Repair Module (NEB, Ipswich, MA, USA), followed by Agencourt AMPure XP (Beckman Coulter GmbH, Krefeld, Germany) purification and dA-tailing for 10 min at 37 °C using NEBNextdA-Tailing Module. dA-tailed DNA was purified as described above. The dA-tailed DNA was further processed using the SQK-MAP006 sequencing kit (Oxford Nanopore) following manufacturer’s instructions. Finally 150–195 ng of the pre-sequencing mix were loaded into the flow cells (N = 2). The 48 h sequencing protocol was chosen. The sequencing protocol was run for 2 h (MinKNOWTM software 0.50.2). Base calling was performed using the MetrichorTM Agent (Oxford Nanopore). Metrichor produces the fast5 file format containing fastq files, which were extracted using poRe.24 Oxford Nanopore raw reads have been uploaded to the Sequence Read Archive (Accession number: SRR4426288). Only 2D reads (comprising information from both DNA strands) with a minimum read length of 6.5 kb (see above) were included in subsequent analyses (Supplementary Fig. S4). Reads were first mapped against the three reference genomes (ftp://ftp.ncbi.nlm.nih.gov/genomes/all/GCA_000469605.1_Apis_dorsata_1.3; ftp://ftp.ncbi.nlm.nih.gov/genomes/all/GCA_000184785.1_Aflo_1.0 (11 January 2017, date last accessed); Amel4.5) in order to assign reads to the corresponding amplicon (by species and genomic target). Read mapping was performed using CLC Genomics Workbench 8.0 (CLC Bio, Aarhus, Denmark). With regard to the high error rate less stringent mapping parameter settings were used: mismatch cost of 2; insertion/deletion costs of 2 and 1, respectively; insertion/deletion open and extend cost of 6 and 1, respectively; length fraction of 0.7/0.5; a similarity fraction of 0.6/0.5 (see below).
2.4. Data analyses
A graphical presentation of the data analysis pipeline is provided in Fig. 1. Sequencing yielded 8468 2D reads, with a median length of 2814 bp (range: 165–15,889 bp) and a mean sequence quality of 10 (Phred score) (Supplementary Fig. S4). For subsequent analyses, only reads ≥ 6.5 kbp were included resulting in 2261 reads that matched these size requirements.
Figure 1.
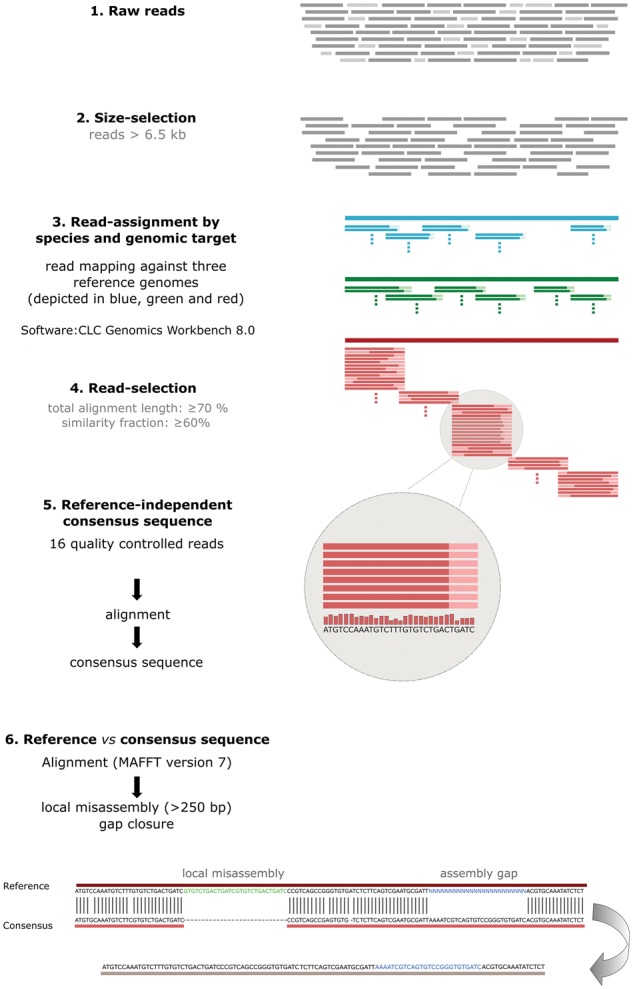
Graphical presentation of the data analysis pipeline. 2D raw reads (1) were size-selected (minimum read length of 6.5 kb) (2) and mapped against the three reference genomes, in order to assign the reads by species and genomic target (3). Only those reads that matched our quality filters (similarity fraction: 0.6 [0.5 for adAmp3, 6 and 7], length fraction: 0.7 [0.5 for adAmp3, 6 and 7]) were included in further analyses (4). Per amplicon sixteen reads (minimum number of reads that mapped to an amplicon—amAmp6) were selected and aligned to each other independent of a reference sequence to build the nanopore-derived consensus sequence (5). Finally, the consensus sequence and the reference sequence were aligned (6). In order to correct the genomic reference sequences of the mrjp gene cluster of A. mellifera, A. florea and A. dorsata, assembly gaps (N) and local mis-assemblies were identified based on this consensus/reference sequence alignment. Assembly gaps (N) in the reference sequence were replaced with the consensus sequence and mis-assemblies were either discarded (when only present in the reference but not in the consensus sequence) or included (when only present in the consensus but not in the reference sequence).
Only reads where at least 70% of the alignment matched the reference sequence and displayed at least 60% identity were included in the analyses. These selection criteria were chosen as others reported on MinION error rates between 30% and 40%.22,23 Applying the stringent quality filters (similarity fraction: 0.6; length fraction: 0.7), only 46% of the 2261 reads mapped to the reference sequences (A. mellifera 356, A. florea 498, A. dorsata 185; Table 1). These selection criteria did only result in 21 reads mapping to the amplicons adAmp3, adAmp6 and adAmp7 as assembly errors or sequencing gaps in the reference sequences caused reduced mappability. Therefore, read selection criteria for these amplicons were reduced (similarity fraction: 0.5; length fraction: 0.5) leading to 98 additional reads mapping to adAmp3, adAmp6 and adAmp7. As 16 reads was the minimum number of reads that mapped to an amplicon (amAmp6; Table 1), for each amplicon, a subset of 16 random reads were selected, aligned to each other (gap open and extend cost 5.0 and 1.0, respectively) and a Nanopore-derived consensus sequence was built. We used for each amplicon the same number of reads in order to account for amplicon coverage-bias. However, the accuracy of an inferred consensus sequence is always dependent on various parameters such as the alignment program, their parameters, thresholds and the depth of the aligned reads and thus using different analysis programs might lead to slightly different consensus sequences.
The nanopore-derived consensus and the corresponding genomic reference sequences were aligned (MAFFT Version 7) in order to close assembly gaps and identify misassembled regions in the reference sequences (Fig. 1). Assembly gaps are stretches of undefined nucleotides (N) of a predicted size in reference sequences. In regions comprising assembly gaps, the alignments of the gap-spanning nanopore consensus sequence to gap-flanking regions were used to infer the actual gap size and nucleotide sequence. To identify and correct misassembled regions alignment discrepancies encompassing >250 bp were considered as indication for a local misassembly. Stretches of unaligned bases in the reference genome without counterpart in the consensus sequence were considered as ‘foreign’, whereas unaligned bases present in the consensus sequence but absent from the reference were scored as ‘missing’. The genomic reference sequences were accordingly corrected (gap closure; elimination of foreign sequence stretches) and are available as Supplementary Fig. S7- S9.
The MRJP amino acid sequences were derived from the corrected genome sequences and used for a subsequent phylogenetic analysis. Amino acid sequences of Bombus terrestris yellow e-3 (GenBank accession: ADW82101.1) and Bombus impatiens yellow-like (GenBank accession: XP_003493839.1) were used as an outgroup. We constructed a maximum-likelihood tree based on multiple sequence alignment using MEGA version 5,25 to infer the evolutionary relationships among Apis MRJP proteins (model: Jones-Taylor-Thornton + Gamma distribution; bootstrap analysis: 500 replications).
2.5. Sanger sequencing
In order to validate the presence of mrjp10 in A. dorsata and A. florea and for the purpose of re-sequencing mrjp2 in A. mellifera, these genes were sequenced using traditional Sanger sequencing. Therefore, amplification was performed in a thermocycler, with denaturation at 94 °C for 1 min; 35 cycles at 98 °C for 10 s; 60 °C for 15 s; 68 °C for 6 min and a final elongation step for 10 min at 68 °C. The PCR reaction setup was as described above. Sequencing of afmrjp10 and admrjp10 has been performed by LGC genomics (Berlin, Germany). The initial sequencing step has been performed using the amplification primer. In order to cover the full-length sequence, nested (internal) sequencing primers were used. Amplification- and sequencing-primers are given in Supplementary Table S1. Sanger sequences are deposited on GenBank (GenBank accession numbers: KX925848 (A. dorsata mrjp10), KX925849 (A. florea mrjp10) and KX951418 (A. mellifera mrjp2).
3. Results and discussion
3.1. Error rates of MinIONTM sequencing
To analyze error patterns of the MinION sequencing, one gene, admrjp10, independently sequenced using Sanger sequencing (GenBank accession number: KX925848) was used to exemplarily infer the error rate and patterns of individual sequencing reads for the aligned region (≈ 3200 bp) using NGS-eval.26 In total, 21 individual sequencing reads were used to exemplarily infer the error patterns. For an individual read, the most prominent error type is substitution (average substitution per aligned base: 0.098). Average insertions and deletions per aligned base are 0.053 and 0.066, respectively (Fig. 2A). The highest substitution rates were observed for adenine (A) and the lowest substitution rates for cytosine (C) (Fig. 2B). Adenine and thymine got frequently substituted by guanine and cytosine. This pattern most likely reflects the base composition of the target sequence, which is A/T rich. In order to describe the relationship between error rates and sequencing depth, several consensus sequences were built averaging sequence information from multiple reads. For this purpose, consensus sequences (2–4 replications each) were generated using 3, 5, 7, 11 or 21 reads. Here, substitutions, ambiguous nucleotides and insertions per aligned base decreased with increasing sequencing depth, while deletions were almost unaffected by sequence coverage (Fig. 2A). This suggests that the occurrence of deletions is rather a systemic error. Indeed, deletions primarily occur in regions comprising homopolymer stretches (85.7%), while the remaining deletions occurred in other repetitive regions like dinucleotide motifs (Fig. 2C). Furthermore, the number of deleted bases is directly related to the length of a homopolymer stretch (Fig. 2D).
Figure 2.
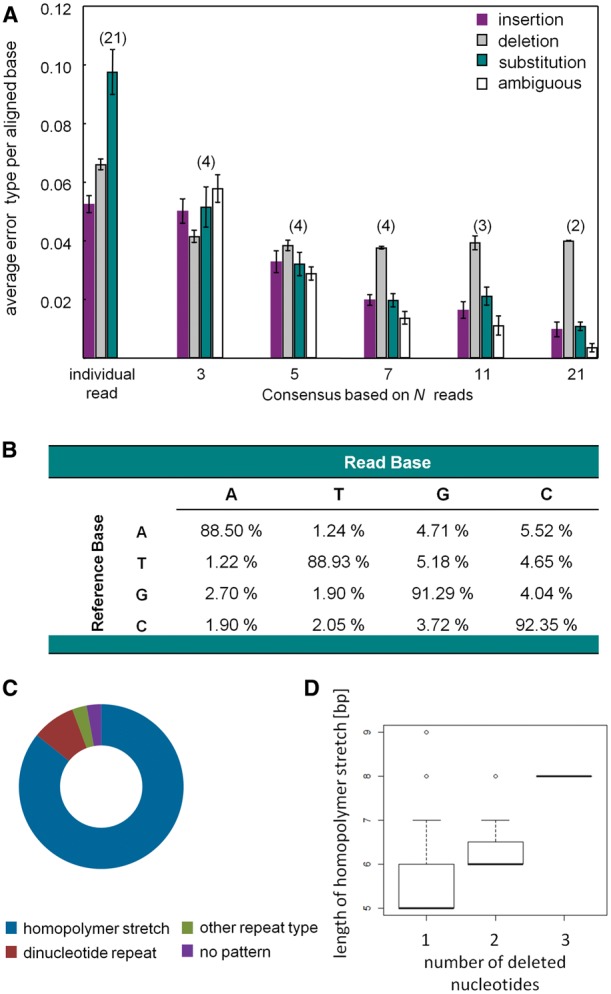
Error patterns of sequencing reads. (A) Average (mean ±SE) insertion, deletion and substitution per aligned base for individual reads (n = 21), consensus sequences based on three reads (n = 4), five reads (n = 4), seven reads (n = 4), 11 reads (n = 3) and 21 reads (n = 2). Ambiguous refers to unknown nucleotides (N) in consensus sequence. (B) Substitution matrix. (C) Distribution of deletions according to the underlying local sequence characteristics: homopolymer stretches, dinucleotide repeats, other repeat types or no patterns. 86% of deletions occur in homopolymer stretches. (D) Dependency of the number of deleted nucleotides on the length of the homopolymer stretch.
3.2. Apis mellifera
For A. mellifera, six overlapping PCR products were sequenced spanning the entire mrjp gene cluster comprising ≈ 57 kb (Fig. 3; GenBank accession: KY087961) broadly confirming the original structure of the cluster4,5 with mrjp3, 1, 4, 6 and 5 located at the 5′ end of the cluster. In the reference genome, mrjp5 is than followed by a partial mrjp-like sequence (LOC102654393), the pseudogene mrjp2-like and mrjp2 (Supplementary Fig. S5). However, we observed an 8 kb-fragment size variation in the region spanning mrjp5 to 2 (amAmp4) (expected: ≈ 22 kb; observed: ≈ 14 kb). In contrast to the reference genome, the sequence of amplicon amAmp4 did neither include the pseudogene mrjp2-like nor its flanking region (Supplementary Fig. S5). The high-sequence identity between mrjp2-like (GB55211) and mrjp2 (GB55212) suggests that this sequence stretch is a segmental duplication resulting from a short read sequencing assembly error (Supplementary Fig. S1). Thus mrjp2-like (GB55211) is actually an assembly artefact and not a pseudogene within the cluster. In order to confirm our findings, we amplified the region spanning mrjp5–mrjp7 using two different primer combinations. For both primer pairs observed and expected amplicon size differed by ≈ 8 kb (I. primer: expected: ≈27.5 kb; observed ≈19.5 kb; II. primer pair: expected: ≈25.0 kb; observed ≈17.0 kb) (Supplementary Fig. S6). In addition, the amAmp4 consensus sequence is not in line with the current mrjp2 (GB55212) annotation (Supplementary Fig. S5). The original 430 bp duplication in GB55212 (comprising the first two introns, as well as exon2, OGSv3.2) was absent in our amAmp4 sequence, probably also representing an assembly artefact in Amel_4.5. Sanger sequencing of ammrjp2 confirmed the absence of this sequence stretch (Supplementary Fig. S2). However, our sequence of mrjp2 matched the NCBI mRNA prediction (NM_001011580.1). A partial mrjp-like sequence (LOC102654393), symbolized by the black destructed arrow in Fig. 3, located between mrjp5 and 2 (Amel_4.5)27 could be verified (Supplementary Fig. S5).
Figure 3.

Schematic organization of the major royal jelly protein gene cluster across three species of the genus Apis. To emphasize the structural organization of mrjps, exons are illustrated in black. Grey arrows refer to putative mrjps based on draft genome sequences. Black destructed arrows illustrate pseudogenized genes. Location of the respective amplicons (adAmp 1–7; afAmp 1–6; amAmp 1–6) within the cluster is also illustrated; with dashed lines referring to fragments deviating from expected product sizes. ad, A. dorsata; am, A. mellifera; af, A. florea. Gene names are the corrected ones after the phylogenetic analysis.
To independently validate our findings, we used A. m. carnica short sequencing data28 to analyze coverage variation between the original mrjp gene cluster (GC) and our long-read guided assembly (lacking segmental duplications). Whereas sequence coverage for an unchanged control region (mrjp1) is similar (72×) for both gene cluster assemblies, coverage of mrjp2 considerably increased when mapped against our long-read guided assembly (original GC: 16×; new GC: 64×).
The genomic organization of the genes mrjp7, mrjp8 and mrjp9 located downstream of mrjp2 could be verified (Fig. 3).
3.3. Apis florea
First insights in the gene cluster of A. florea suggested a similar gene order to A. mellifera (mrjp3, 1, 4, 6, 5, 2, Ψ, 7, 8 and 9), with a switch in position of the so far predicted pseudogene (mrjp-Ψ/2-like) and mrjp2 (for more information see Fig. 2 in Buttstedt et al.8). The amplicon sizes for A. florea were in the expected range, except for afAmp6 (expected: ≈ 10.8 kb; observed: ≈ 7.8 kb; see below). Sequencing four overlapping PCR products at the 5′prime end of the gene cluster (Fig. 3), confirmed the proposed gene order8 for five mrjps (afmrjp3–5). We were not able to amplify the region between mrjp5 and 7 which was supposed to harbour afmrjp2 and afmrjp-Ψ8. However, analyzing the reference genomic sequence revealed indeed two full-length genes to be located between mrjp5 and mrjp7 (Fig. 3). This is in contrast to A. mellifera, where mrjp5 is followed by one partial mrjp-like sequence and a full-length mrjp (mrjp2). Amplicons afAmp5 and 6 confirmed the presence of mrjp7 and 8 but not mrjp9. Instead we identified an additional afAmp6-R primer-binding site on an unplaced genomic scaffold04303 (1909 bp). This scaffold showed a ≈550bp sequence overlap with the 3′prime end of afAmp6, whereas a part (the last 60 bp) of the remaining sequence is highly identical to the 5′prime region of mrjp9. Thus, scaffold04303 should be replaced between mrjp8 and mrjp9, to close the gap in the current assembly. Assemblies based on MinIONTM consensus sequences have been deposited on Genbank (Accession nos. KY087959 and KY087960).
3.4. Apis dorsata
For A. dorsata, up to now no mrjp gene order has been proposed. Here, seven overlapping PCR products were sequenced spanning two contiguous parts of the mrjp gene cluster (Fig. 3; GenBank accession nos. KY087957 and KY087958). The observed amplicon sizes were in the expected range, except for adAmp6 (expected: ≈ 14.9 kb; observed: ≈ 12.5 kb). The majority of the reads mapped to the unplaced genomic scaffold_260 (KI273360.1) comprising admrjp3–8, whereas a minor proportion mapped to the unplaced genomic scaffold_444 (KI273484.1) containing admrjp9. The mrjp region contained several gaps within the partial reference sequences, which could be resolved based on the nanopore-derived consensus sequence. Our sequence analysis confirmed the general arrangement of mrjp3–5. One full-length mrjp-like gene, located downstream of admrjp5 (amplicon adAmp5) (Fig. 3), could not unambiguously assigned to an A.mellifera homologue. Furthermore a ≈ 1.4 kb sequence stretch, present in the partial genome sequence between admrjp2 and admrjp8, was absent in our adAmp6 sequence, probably representing an assembly artefact. Whereas amplicon adAmp6 confirmed the presence of admrjp2, we only found a truncated A. dorsata homologue of mrjp7 at the supposed position in A. mellifera and A. florea. The location of mrjp8 and 9 at the 3′ end of the cluster was verified by amplicon adAmp7.
3.5. A new member of the mrjp family—mrjp10
In all three Apis species, mrjp3, 1, 4, 6 and 5 showed an identical location at the 5′ end of the cluster and mrjp8 and 9 were always found at the 3′ end (Fig. 3). Between mrjp5 and 8, the gene order seems to be less clear: In A. mellifera, a partial mrjp-like sequence is followed by ammrjp2 and 7; in A florea, two full-length afmrjps (which have previously been described as afmrjp2 and afmrjp-Ψ8) are followed by afmrjp7 and in A. dorsata an unknown full-length admrjp is followed by admrjp2 and a partial admrjp (Fig. 3). Phylogenetic reconstruction based on MRJP amino acid sequences suggest that A. dorsata and A. florea seem to encode a previously uncharacterized member of the gene cluster, located directly downstream of mrjp5, which we propose to be called mrjp10 (Fig. 4). Thus, the full-length mrjp of A. florea found downstream of afmrjp5 is not as formerly predicted afmrjp28 but indeed afmrjp10. In our analyses, afMRJP10 clustered together with adMRJP10, missing a homologous protein in A. mellifera where multiple sequence alignment suggests a truncated ammrjp-like gene (corresponding to LOC102654393) located between ammrjp5and ammrjp2. Evidence for a full-length mrjp10 homologue in A. mellifera is missing due to the absence of the first three exons. The occurrence of mrjp10 in A. florea and A. dorsata has in addition been validated by Sanger sequencing (GenBank: KX925848 and KX925849).
Figure 4.
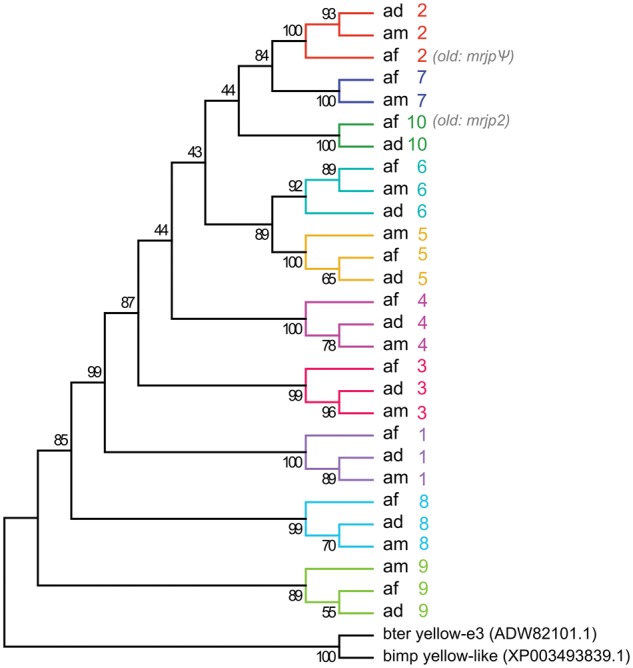
Phylogeny of Apis major royal jelly proteins (MRJP). The maximum-likelihood tree was reconstructed from aligned amino acid sequences using Jones–Taylor–Thornton, including bootstrapping (500 replications). A discrete Gamma distribution was used to model evolutionary rate differences among sites (five categories, G parameter = 2.1115). All positions containing gaps and missing data were eliminated. There were a total of 365 positions in the final dataset. Model selection was performed using MEGA version 5 (Tamura et al.25). Sequences for afMRJP10 (old = afMRJP2), afMRJP2 (old = afMRJPψ) and afMRJP9 were derived from the draft genome (scaffold 1824). Ad, A. dorsata; am, A. mellifera; af, A. florea.
The protein sequence inferred from the gene located downstream of afmrjp10, formerly predicted as afmrjp-Ψ,8 formed a separate clade together with amMRJP2 and adMRJP2 (Fig. 4). Thus, all three Apis species possess a full-length mrjp2. In contrast, amMRJP7 clustered together with afMRJP7 but a full length homologue in A. dorsata was missing (Fig. 4).
4. Conclusions
In the era of sociogenomics, comparative analyses are key to understand features linked to advanced social organization (e.g.29,30)—presuming high-quality (draft) genomes and reliable gene predictions. However, even well-studied genomes are not error-free2,3 and this might affect downstream dependencies. Technical innovations including improved sequencing strategies, assembly algorithms and gene prediction methods, have been shown to substantially enhance the initial A. mellifera reference genome.27 However, our results provide evidence that even additional incorporation of alternative sequencing strategies (ABI SOLiD and Roche 454 paired-end sequencing) was insufficient to fully resolve a complex region.
In A. mellifera, gene order within a multi-copy gene cluster has been previously determined by Drapeau et al. as y-e3, ammrjp3, ammrjp1, ammrjp4, ammrjp6, ammrjp5, a truncated RJ gene ammrjp-Ψ, ammrjp2, ammrjp7, ammrjp8, ammrjp9 and y-h.4,5 In the current NCBI annotation, ammrjp5 is followed by a truncated mrjp (probably mrjp-Ψ in the publication by Drapeau et al.4) and a full-length mrjp named ammrjp2-like (in recent publications referred to as pseudogene). The proposed ammrjp2-like gene (pseudo; GB55211) located between ammrjp5 and ammrjp2 appears to be an assembly artefact arising from short read sequencing as we show here by long-amplicon sequencing. The truncated variant already described by Drapeau et al.4 as pseudogene was also found in our study. The honeybee genome sequence has repeatedly been used as a framework studying key mechanisms of eusociality. However, sequence assembly errors will affect reference genome-guided analyses: e.g. variant calling (polymorphisms) or skew large-scale gene expression analyses. For example Mao et al.31 and Vojvodic et al.32 reported on the expression of mrjp2-like (pseudo; GB55211) in A. mellifera. However, these reads most likely belonged to ammrjp2, thus biasing the gene expression estimates of ammrjp2. Evolutionary rate estimates33,34 might be biased as well. Moreover, long-amplicon reads are also suitable to solve inter-scaffold gaps as shown for A. florea. For example scaffold04303 between mrjp8 and mrjp9, replaced the gap in the current assembly. Thus, even in spite of ∼10% nucleotide-sequencing errors, MinION reads were most suitable to reconstruct the organization of extensive gene clusters. The combination of long-range PCR with third-generation sequencing overcame the intrinsic problems of short-sequencing reads assemblies.
Our results suggest a similar gene cluster organization among the three Apis species. However, the number of full-length homologues is different. Whereas the A. florea genome possesses 10 full-length mrjp genes, A. dorsata and A. mellifera comprise only nine. In that regard, our results indicate lineage-specific evolutionary fates of mrjp duplicates located between mrjp5 and 8. In A. florea, the region between mrjp5 and 8 encodes three full-length mrjps: afmrjp10—a previously uncharacterized member of the mrjp/yellow family, afmrjp2 and afmrjp7. A full-length copy of mrjp10 is also existing in A. dorsata but only partially present in A. mellifera (LOC102654393). In contrast, mrjp7 is present in A. mellifera and A. florea, but a full-length homolog in A. dorsata is missing.
A phylogenetic reconstruction based on the MRJP amino acid sequences revealed 10 terminal MRJP clades (Fig. 4). However, the various orthologous mrjp genes are more similar among species than the within-species paralog genes, suggesting a common ancestral gene cluster structure for all studied species. Taking into account recent phylogenetic findings, indicating that A. florea is basal to the cavity nesting and giant honeybees,35 we conclude that the common ancestor likely encoded 10 mrjps. This is further supported by the presence of incomplete gene copies in the more derived species, A. mellifera (mrjp10) and A. dorsata (mrjp7). The region from mrjp5–8 thus might have experienced a period of reduced selective constraint accompanied with accumulation of non-synonymous deleterious mutations, facilitating independent gene loss in A. mellifera and A. dorsata after their divergence.
Temporal functional redundancy following gene duplication is assumed to reduce selective constraint on one copy und thus provides a prerequisite for pseudogenization, neo- and/or sub-functionalization,36–38 ultimately determining the evolutionary fate of gene copies (preservation or loss). In case of the Apis mrjp genes, neo- and subfunctionalization might synergistically contribute to their accumulation and preservation. Expression patterns for the ancestral mrjp8 and 9 differ remarkably from the remaining mrjps. Almost ubiquitous transcript abundances of mrjp8 and 9 across various body sections and independent of caste suggest a more general physiological than a nutritive function for both gene products.4,13 Hence, subfunctionalization might explain preservation of this ancestral gene pair mrjp8 and 9. In contrast, worker- and tissue-biased expression of mrjp1–7 indicates spatial and functional separation from mrjp8 and 9, suggesting neofunctionalization of an ancestral duplicate. All worker-mrjps are predominantly expressed in heads, although their spatial expression patterns indicate further differentiation–with preferential expression in hypopharyngeal glands (for those genes encoding proteins with nutritional value) and/or the brain.39 Moreover, elevated transcript abundances of some mrjps in brood-raising nurse bees compared with foragers (and vice versa) indicate more specialized functions related to division of labor.13,32 Phylogenetic trajectories revealed different complements of worker-mrjp genes within Apis and in this regard, each species might express a slightly different set of mrjps, whose conditional expression is assumed to impact their evolution. Genes almost exclusively expressed in sterile workers (in A. mellifera: mrjp1–7) but with a phenotypic effect in another individual, are considered as indirect effect genes and are thus expected to evolve under relaxed purifying selection.40 In contrast, mrjp8 and 9 are both evenly expressed across all body sections and irrespective of social state,13 thus exert a direct effect in the individual itself. Therefore, different evolutionary modes of mrjps might be a consequence of species-specific conditional expression of worker-mrjps. However, currently we lack information concerning timing and tissue specificity of expression even for the shared set of worker-mrjps for A. florea and A. dorsata. Nevertheless, at least we can draw on expression data for A.florea.41 Using the TSA BLAST database from NCBI, we were able to identify transcripts supporting the expression of the afmrjps including transcripts matching afmrjp2 and afmrjp10 (Supplementary Table S2). However, using the A. florea antennal transcriptome (Bioproject PRJNA325192), we identified reads supporting the expression of all mrjps except mrjp10.
Also the cause of pseudogenization/loss of mrjp7 in A. dorsata and mrjp10 in A. mellifera, while preservation in the respectively other species and conservation of both duplicates in A. florea, remains obscure. Whereas increased transcript abundance of mrjp7 in the mushroom bodies of A. mellifera are indicative for a function in the honeybee brain,13,39 absolutely nothing is known about the expression/function of mrjp10 in A. dorsata or A. florea. Maybe both gene products exhibit at least partial functional redundancy and reciprocal gene loss is a consequence of dosage-sensitivity in the respective lineages. However, different patterns of mrjp-like gene loss and retention are common in Hymenoptera8 and may be a consequence of lineage specific adaptation.
Characterization and comparative analysis of mrjp expression pattern in A. florea and A. dorsata would help to infer the extent of gene expression diversity or might indicate functional redundancy between lost/retained genes. In addition, comparative analyses of the mrjp gene cluster organization in other honeybee species belonging to the three subgenera (Micrapis, Megapis and Apis) might also help to unravel the evolutionary history of this multi-gene family.
Supplementary Material
Acknowledgements
We thank Alexis Beaurepaire for travelling around the world collecting bees and Eduard Schwarz for sequencing mrjp2 in A. mellifera. We would like to thank G. Robinson, O. Rueppell, C. Elsik and the Baylor College of Medicine Human Genome Sequencing Center for making the genome data of A. florea and A. dorsata available pre-publication. This project was supported by the German Research Foundation (Deutsche Forschungsgemeinschaft—DFG, Grant MO 373/32-1 to R.F.A.M.).
Conflict of interest
The authors declare that they have no competing interests. H.M.G.L. is part of the MinIONTM Access Programme (MAP). Oxford Nanopore Technologies Ltd contributed reagents free of charge and had no role in study design, data collection and analysis, or preparation of the manuscript.
Accession number
KY087957, KY087958, KY087959, KY087960, KY087961, KX925848, KX925849, KX951418, SRR4426288.
Supplementary data
Supplementary data are available at www.dnaresearch.oxfordjournals.org.
Funding
This project was supported by the German Research Foundation (Deutsche Forschungsgemeinschaft - DFG, Grant MO 373/32-1 to RFAM).
References
- 1. Salzberg S. L., Yorke J. A.. 2005, Beware of mis-assembled genomes. Bioinformatics, 21, 4320–1. [DOI] [PubMed] [Google Scholar]
- 2. Kelley D. R., Salzberg S. L.. 2010, Detection and correction of false segmental duplications caused by genome mis-assembly. Genome Biol., 11, R28. [DOI] [PMC free article] [PubMed] [Google Scholar]
- 3. Zhang Q., Backström N.. 2013, Assembly errors cause false tandem duplicate regions in the chicken (Gallus gallus) genome sequence. Chromosoma, 123, 165–8. [DOI] [PubMed] [Google Scholar]
- 4. Drapeau M. D., Albert S., Kucharski R., Prusko C., Maleszka R.. 2006, Evolution of the Yellow/Major Royal Jelly Protein family and the emergence of social behavior in honey bees. Genome Res., 1385–94. [DOI] [PMC free article] [PubMed] [Google Scholar]
- 5. Honeybee Genome Sequencing Consortium. 2006, Insights into social insects from the genome of the honeybee Apis mellifera. Nature, 443, 931–49. [DOI] [PMC free article] [PubMed] [Google Scholar]
- 6. Schmitzová J., Klaudiny J., Albert Š., et al. 1998, A family of major royal jelly proteins of the honeybee Apis mellifera L. Cell. Mol. Life Sci. C., 54, 1020–30. [DOI] [PMC free article] [PubMed] [Google Scholar]
- 7. Albert Š., Klaudiny J.. 2004, The MRJP/YELLOW protein family of Apis mellifera: Identification of new members in the EST library. J. Insect Physiol., 50, 51–9. [DOI] [PubMed] [Google Scholar]
- 8. Buttstedt A., Moritz R. F. A., Erler S.. 2014, Origin and function of the major royal jelly proteins of the honeybee (Apis mellifera) as members of the yellow gene family. Biol. Rev., 89, 255–69. [DOI] [PubMed] [Google Scholar]
- 9. Hanes J., Šimúth J.. 1992, Identification and partial characterization of the major royal jelly protein of the honey bee (Apis mellifera L.). J. Apic. Res., 31, 22–6. [Google Scholar]
- 10. Zhang L., Han B., Li R., et al. 2014, Comprehensive identification of novel proteins and N-glycosylation sites in royal jelly. BMC Genomics, 15, 135. [DOI] [PMC free article] [PubMed] [Google Scholar]
- 11. Snodgrass R. E. 1925, Anatomy and physiology of the honey bee. McGraw-Hill Book Company: New York. [Google Scholar]
- 12. Buttstedt A., Ihling C. I., Pietzsch M., Moritz R. F. A.. 2016, Royalactin is not a royal making of a queen. Nature, 537, E10–E12. [DOI] [PubMed] [Google Scholar]
- 13. Buttstedt A., Moritz R. F.A, Erler S.. 2013, More than royal food – major royal jelly protein genes in sexuals and workers of the honeybee Apis mellifera. Front. Zool., 10, 72. [DOI] [PMC free article] [PubMed] [Google Scholar]
- 14. Albert S., Schmitz J.. 2002, Characterization of major royal jelly protein-like DNA sequences in Apis dorsata. J. Apic. Res., 41, 75–82. [Google Scholar]
- 15. Albertová V., Su S., Brockmann A., Gadau J., Albert S.. 2005, Organization and potential function of the mrjp3 locus in four honeybee species. J. Agric. Food Chem., 53, 8075–81. [DOI] [PubMed] [Google Scholar]
- 16. Imjongjirak C., Klinbunga S., Sittipraneed S.. 2005, Cloning, expression and genomic organization of genes encoding major royal jelly protein 1 and 2 of the honey bee (Apis cerana). J. Biochem. Mol. Biol., 38, 49–57. [DOI] [PubMed] [Google Scholar]
- 17. Su S., Albert S., Chen S., Zhong B.. 2005, Molecular cloning and analysis of four cDNAs from the heads of Apis cerana cerana nurse honeybees coding for major royal jelly proteins. Apidologie, 36, 389–401. [Google Scholar]
- 18. Huddleston J., Ranade S., Malig M., et al. 2014, Reconstructing complex regions of genomes using long-read sequencing technology. Genome Res., 24, 688–96. [DOI] [PMC free article] [PubMed] [Google Scholar]
- 19. Chaisson M. J. P., Huddleston J., Dennis M. Y., et al. 2015, Resolving the complexity of the human genome using single-molecule sequencing. Nature, 517, 608–11. [DOI] [PMC free article] [PubMed] [Google Scholar]
- 20. Karamitros T., Harrison I., Piorkowska R., Katzourakis A., Magiorkinis G., Mbisa J. L.. 2016, De Novo Assembly of Human Herpes Virus Type 1 (HHV-1) genome, Mining of Non-Canonical Structures and Detection of Novel Drug-Resistance Mutations Using Short- and Long-Read Next Generation Sequencing Technologies. PLoS One. 11(6):e0157600. [DOI] [PMC free article] [PubMed] [Google Scholar]
- 21. Untergasser A., Cutcutache I., Koressaar T., et al. 2012, Primer3—new capabilities and interfaces. Nucleic Acids Res., 40(15):e11. [DOI] [PMC free article] [PubMed] [Google Scholar]
- 22. Laver T., Harrison J., O’Neill P. A., et al. 2015, Assessing the performance of the Oxford Nanopore Technologies MinION. Biomol. Detect. Quantif., 3, 1–8. [DOI] [PMC free article] [PubMed] [Google Scholar]
- 23. Madoui M.-A., Engelen S., Cruaud C., et al. 2015, Genome assembly using nanopore-guided long and error-free DNA reads. BMC Genomics, 16, 327. [DOI] [PMC free article] [PubMed] [Google Scholar]
- 24. Watson M., Thomson M., Risse J., Talbot R., Santoyo-Lopez J., Gharbi K., Blaxter M.. 2015, poRe: an R package for the visualization and analysis of nanopore sequencing data. Bioinformatics, 31, 114–115. [DOI] [PMC free article] [PubMed] [Google Scholar]
- 25. Tamura K., Peterson D., Peterson N., Stecher G., Nei M., Kumar S.. 2011, MEGA5: Molecular evolutionary genetics analysis using maximum likelihood, evolutionary distance, and maximum parsimony methods. Mol. Biol. Evol., 28, 2731–9. [DOI] [PMC free article] [PubMed] [Google Scholar]
- 26. May A., Abeln S., Buijs M.J., Heringa J., Crielaard W., Brandt B.W. (2015). NGS-eval: NGS Error analysis and novel sequence VAriant detection tooL. Nucleic Acids Res., 43:W301–W305. [DOI] [PMC free article] [PubMed] [Google Scholar]
- 27. Elsik C. G., Worley K. C., Bennett A. K., et al. 2014, Finding the missing honey bee genes: lessons learned from a genome upgrade. BMC Genomics, 15, 1–29. [DOI] [PMC free article] [PubMed] [Google Scholar]
- 28. Wallberg A., Han F., Wellhagen G., et al. 2014, A worldwide survey of genome sequence variation provides insight into the evolutionary history of the honeybee Apis mellifera. Nat. Genet., 46, 1081–8. [DOI] [PubMed] [Google Scholar]
- 29. Kapheim K. M., Pan H., Li C., et al. 2015, Genomic signatures of evolutionary transitions from solitary to group living. Science (80-.)., 348, 1139–43. [DOI] [PMC free article] [PubMed] [Google Scholar]
- 30. Sadd B. M., Barribeau S. M., Bloch G., et al. 2015, The genomes of two key bumblebee species with primitive eusocial organization. Genome Biol., 16, 76. [DOI] [PMC free article] [PubMed] [Google Scholar]
- 31. Mao W., Schuler M. A., Berenbaum M. R.. 2015, A dietary phytochemical alters caste-associated gene expression in honey bees. Sci. Adv., 1, e1500795. [DOI] [PMC free article] [PubMed] [Google Scholar]
- 32. Vojvodic S., Johnson B. R., Harpur B. A., et al. 2015, The transcriptomic and evolutionary signature of social interactions regulating honey bee caste development. Ecol. Evol., 5, 4795–807. [DOI] [PMC free article] [PubMed] [Google Scholar]
- 33. Harpur B.A., Kent C.F., Molodtsova D., Lebon J.M.D., Alqarni A.S., Owayss A.A., Zayed A.. 2014, Population genomics of the honey bee reveals strong signatures of positive selection on worker traits. Proc. Natl. Acad. Sci. USA., 111(7), 2614–9. [DOI] [PMC free article] [PubMed] [Google Scholar]
- 34. Wallberg A., Han F., Wellhagen G., Dahle B., Kawata M., Haddad N., Paulino Simoes Z., Allsopp M., Kandemir I., De la Rua P., Pirk C.W., Webster M.T.. 2014, A worldwide survey of genome sequence variation provides insight into the evolutionary history of the honeybee Apis mellifera. Nature Genetics, 46, 1081–8. [DOI] [PubMed] [Google Scholar]
- 35. Lo N., Gloag R. S., Anderson D. L., Oldroyd B. P.. 2010, A molecular phylogeny of the genus Apis suggests that the Giant Honey Bee of the Philippines, A. breviligula Maa, and the Plains Honey Bee of southern India, A. indica Fabricius, are valid species. Syst. Entomol., 35, 226–33. [Google Scholar]
- 36. Ohno S. 1970, Evolution by gene duplication. Springer-Verlag, Heidelberg, Germany. [Google Scholar]
- 37. Lynch M. 2007, The origins of genome architecture. Sinauer Associates, Inc. Publishers; Sunderland, MA. [Google Scholar]
- 38. Innan H., Kondrashov F.. 2010, The evolution of gene duplications: classifying and distinguishing between models. Nat. Rev. Genet., 11, 97–108. [DOI] [PubMed] [Google Scholar]
- 39. Hojo M., Kagami T., Sasaki T., Nakamura J., Sasaki M.. 2010, Reduced expression of major royal jelly protein 1 gene in the mushroom bodies of worker honeybees with reduced learning ability. Apidologie, 41, 194–202. [Google Scholar]
- 40. Linksvayer T. A., Wade M. J.. 2009, Genes with social effects are expected to harbor more sequence variation within and between species. Evolution (N. Y)., 63, 1685–96. [DOI] [PMC free article] [PubMed] [Google Scholar]
- 41. Woodard S.H., Fischman B.J., Venkat A., Hudson M.E., Varala K., Cameron S.A., Clark A.G., Robinson G.E.. 2011, Genes involved in convergent evolution of eusociality in bees. Proc. Natl. Acad. Sci. USA., 108, 7472–7477. 10.1073/pnas.1103457108. [DOI] [PMC free article] [PubMed] [Google Scholar]
Associated Data
This section collects any data citations, data availability statements, or supplementary materials included in this article.