


Abstract
Cellular liquid–liquid phase separation (LLPS) results in the formation of dynamic granules that play an important role in many biological processes. On a molecular level, the clustering of proteins into a confined space results from an indefinite network of intermolecular interactions. Here, we introduce and exploit a novel high-throughput bottom-up approach to study how the interactions between RNA, the Dcp1:Dcp2 mRNA decapping complex and the scaffolding proteins Edc3 and Pdc1 result in the formation of processing bodies. We find that the LLPS boundaries are close to physiological concentrations upon inclusion of multiple proteins and RNA. Within in vitro processing bodies the RNA is protected against endonucleolytic cleavage and the mRNA decapping activity is reduced, which argues for a role of processing bodies in temporary mRNA storage. Interestingly, the intrinsically disordered region (IDR) in the Edc3 protein emerges as a central hub for interactions with both RNA and mRNA decapping factors. In addition, the Edc3 IDR plays a role in the formation of irreversible protein aggregates that are potentially detrimental for cellular homeostasis. In summary, our data reveal insights into the mechanisms that lead to cellular LLPS and into the way this influences enzymatic activity.
INTRODUCTION
To facilitate and regulate biological reactions the intracellular space is partitioned into distinct compartments (1). These compartments can be divided into those that are encapsulated in a lipid membrane and those that are devoid of a lipid membrane (2,3). Membrane-less compartments, also referred to as intracellular bodies or granules, are dynamic cellular sub-structures that arise from a spontaneous liquid–liquid phase separation (LLPS) process, which results in a very high local concentration of specific components (4). Both the nucleus and the cytoplasm of eukaryotic cells contain a number of functionally distinct granules, each of them typically harboring tens to hundreds of specific proteins and RNA. Examples of nuclear ribonucleoprotein (RNP) bodies include Cajal bodies, nucleoli and PML bodies, whereas cytoplasmic RNP bodies include stress granules, germ granules and processing bodies or P-bodies (2). The large number of RNA granules reflects the involvement of these assemblies in central cellular processes including mRNA translation, processing, localization and turnover.
Membrane-less compartments display a liquid-like behavior, where smaller granules can fuse together into larger assemblies (5–7). The viscosity inside these cellular droplets has been determined to be three to six orders of magnitude above that of pure water, which can impact on the enzymatic processes taking place inside these foci. Interestingly, it has been shown that functionally different RNP granules, like P-bodies and stress granules, share certain components and that these foci can fuse or dock together (8,9).
A number of in vivo and in vitro approaches have revealed insights into the molecular details that lead to cellular phase transition. Currently, three mechanisms have been shown to be important for the self-assembly process. First, intrinsically disordered regions (IDRs) are highly abundant in proteins that segregate into cellular foci (10). These IDRs are characterized by the lack of tertiary structure and are sparse in hydrophobic amino acids. Indeed, interactions between the IDRs in Ddx4 have been shown to be important for the self-assembly of the protein into germ granules (11). In addition, an IDR in hnRNPA1 is important for the phase separation of the protein into stress granules (12,13), IDRs in the protein LAF-1 has been shown to promote P-granule assembly (14) and a glutamine/asparagine-rich domain in yeast Lsm4 stimulates P-body formation (15). The IDRs in these proteins are able to associate into large networks due to a combination of charge–charge, cation–π, dipole–dipole and π–π stacking interactions (4). The distribution of charged residues has been shown to be important for self-assembly, where an unequal distribution of charges stimulates intermolecular contacts (11,16). Second, interactions between folded protein domains and short linear motifs in disordered regions are found in interaction networks that result in phase separations. Examples include the interactions between SH3 domains and proline-rich motifs (17) and those between the Edc3 LSm domain and helical leucine-rich motifs (HLMs) in Dcp2 and Pdc1 (18,19) (Figure 1A). Finally, interactions between folded RNA recognition motifs in granule proteins and RNA stimulate the formation of mRNP granules, which has been shown for hnRNPA1 (12), PTB (17) and Whi3 (20). In addition, non-translating mRNAs have been shown to increase the number of cellular P-bodies (21). On the other hand, RNA does not contribute to the phase separation of the P-granule protein LAF-1 (14), indicating that RNA is not a general component important for RNP formation. Importantly, it has been shown that different intermolecular interaction modes can simultaneously take place within phase-separated granules (16,18), illustrating the high level of redundancy within LLPS processes.
Figure 1.

High-throughput LLPS diagrams. (A) Schematic diagram of the proteins used in this study. Lines indicate the intra- and intermolecular interactions that are important for the LLPS process. (B) Comparison of LLPS diagrams for the Dcp1:Dcp2 (y-axis) and Edc3 (x-axis) protein that are constructed based on the visual inspection of microscopy images (left) or direct and quantitative turbidity measurements (right). Both methods provide highly similar phase diagrams, underlining that our high-throughput approach provides rapid and reliable data. The degree of phase separation is indicated in a white (no LLPS), yellow, orange, red (high degree of LLPS) color scale. See also Supplementary Figure S2. (C) The effect of salt on the LLPS process. Salt inhibits LLPS of Dcp1:Dcp2:Edc3. Note the few outliers in the phase diagrams at (e.g. 150 mM salt; 5 μM Edc3 and 30 μM Dcp1:Dcp2) are likely due to the presence of small air bubbles in these conditions. (D) Addition of Pdc1 significantly enhances the LLPS of Dcp1:Dcp2 and Edc3. The effect is due to specific interactions between Pdc1 and Dcp1:Dcp2:Edc3 and is not due to indirect effects of, e.g. molecular crowding (Supplementary Figure S3).
The integrity of cellular granules appears to be regulated and cellular foci can be disassembled by a number of processes, including phosphorylation by the DYRK3 kinase (22), the activity of the Hsp70 and Hsp40 chaperones (23), through autophagy and the protein Cdc48/VCP (24) and the activity of the helicase Dhh1 (25). As the cellular environment appears to be close to the phase separation boundary, small perturbations to the interaction network that underlies granule formation allow for a rapid formation and disassembly of cellular foci. Proteins in cellular foci can undergo further transitions to form fiber-like structures. Interestingly, the mechanisms that result in cellular phase transitions and those that are important for fibrillization are different (12). The formation of fibers appears to be enhanced in cellular foci due to the high local protein concentration, which can result in pathological inclusions (13,26–28).
Processing bodies are dynamic cytoplasmic RNP granules that contain proteins that are involved in translational repression and mRNA degradation (21). The main constituents are mRNA (29) and the mRNA decay machinery, including the Dcp1:Dcp2 mRNA decapping complex, the enhancer of decapping 3 (Edc3), the RNA helicase Dhh1, the Pat–Lsm1–7 complex and the exonuclease XrnI (15,30–32). The composition and the mechanism of assembly of processing bodies varies between different organisms, as an example, the protein Pdc1 (33) plays a central scaffolding role in Schizosaccharomyces pombe, but this factor appears to be absent in Saccharomyces cerevisiae. Despite the ubiquitous presence of processing bodies in eukaryotes their biological role remains a matter of debate. Based on the protein composition, they have been implicated in mRNA decapping and degradation. However, mRNA can leave processing bodies to re-engage in translation (34), which points toward a role of processing bodies in the temporary storage of non-translating mRNAs, e.g. during cellular stress conditions.
Here, we address the cooperative intermolecular interactions in the formation of processing bodies and maturation of these foci into a gel-like phase. To that end, we exploit an automated, fast and reliable in vitro bottom-up approach (17,18) using purified processing body components (Dcp1, Dcp2, Pdc1, Edc3, Dhh1 (Ste13) and RNA) and assess their ability to undergo LLPS and subsequent formation of gel-like structures. Using mRNA enzymatic assays, we reveal the first insights into the activity of the mRNA decapping complex within processing body-like foci that support a role for processing bodies in the storage of translationally inactive mRNA.
MATERIALS AND METHODS
Protein expression and purification
The genes for full-length Pdc1 and Edc3 proteins as well as for the individual Edc3 LSm and YjeF_N domains from S. pombe were cloned into modified pET vectors that carried an N-terminal Tobacco Etch Virus (TEV) protease-cleavable His6-tag. The genes for the IDR of Edc3 and the second RecA domain of Ste13 (Dhh1 in S. cerevisiae) were cloned into modified pET vectors that carried an N-terminal TEV-cleavable His6-Glutathione S-transferase (GST)- or His6-MBP (Maltose binding protein)-tag, respectively. Dcp1:Dcp2 complexes were cloned in a modified pET vector, where only the Dcp1 protein carried an N-terminal TEV-cleavable His6-tag. Point mutations, insertions and deletions were introduced into the genes using standard site-directed mutagenesis methods (Supplementary Table S1).
BL21 (DE3) Codon Plus RIL (Stratagene) cells were transformed with the appropriate plasmid and grown at 37°C to an OD595 (optical density at a wavelength of 595 nm) of 0.8 in Lysogeny broth (LB), after which protein overexpression was induced with 0.5 mM isopropyl β-D-1-thiogalactopyranoside (IPTG) at 20°C. After 15 h, cells were pelleted by centrifugation and lysed in buffer A (25 mM sodium phosphate, pH 7.4, 250 mM NaCl, 1 mM Dithiothreitol (DTT)) complemented with 10 mM imidazole, lysozyme, 0.1% Triton X-100, 5 mM MgCl2 and 0.2 U/ml DNase. The cell lysate was cleared from insoluble debris by centrifugation and the supernatant was loaded on Ni-nitrilotriacetic acid resin. The resin was washed with buffer A that was complemented with 10 mM imidazole. The protein bound to the resin was eluted with buffer A complemented with 300 mM imidazole. One milligram TEV protease was added to the eluted proteins to cleave the purification tag from the target protein.
Subsequently, proteins carrying an N-terminal TEV cleavable GST- or MBP-tag were dialyzed overnight at 4°C into buffer B (25 mM 4-(2-hydroxyethyl)-1-piperazineethanesulfonic acid (HEPES), 50 mM NaCl, 1 mM DTT) supplemented with 0.5 mM ethylenediaminetetraacetic acid (EDTA). The dialysed proteins were applied to a HiTrap 5 ml SP FF column (GE Healthcare) to separate the protein of interest from the cleaved solubility tags using appropriate gradients from buffer B to buffer C (25 mM HEPES, 1 M NaCl, 1 mM DTT) over 100 ml. The pH of the ion exchange buffers varied depending on the used solubility tag (pH 7.3 for MBP and pH 8.0 for GST). The buffer of the pooled fractions was exchanged to size exclusion chromatography (SEC) buffer (25 mM HEPES, pH 7.3, 125 mM NaCl, 1 mM DTT) using centrifugal filters. Proteins carrying an N-terminal His6-tag were dialyzed overnight at 4°C into SEC buffer supplemented with 0.5 mM EDTA. Purification to homogeneity was achieved by size exclusion chromatography on a Superdex 75 or Superdex 200 column (GE Healthcare) in SEC buffer.
Labeling of proteins with nuclear magnetic resonance (NMR) active nuclei was achieved by overexpression of the gene in M9 minimal medium. The growth medium was supplemented with 0.5 g/l 15NH4Cl as the sole nitrogen source and either 2 g/l 1H13C-glucose for resonance assignment purposes or 4 g/l 1H12C-glucose for NMR binding experiments.
Protein fluorescence labeling
For fluorescence microscopy studies that assess droplet maturation, the Edc3 protein was labeled with Oregon Green 488 (OG). Therefore, the protein was prepared in SEC buffer free of any reducing agent. A few micrograms of OG-maleimide were dissolved in DMSO and added in a 2- to 3-fold excess to the protein solution. The labeling reaction was allowed to proceed for up to 2 h at room temperature in the dark. The reaction was stopped by addition of DTT to a final concentration of 4 mM. Unreacted dye was removed using a PD10 desalting column in SEC buffer. The concentration of the labeled protein was determined photometrically at 280 and 492 nm, whereby the lower concentration was used for further calculations. The fluorescently labeled protein was mixed with non-labeled protein to obtain an appropriate signal-to-noise ratio in the fluorescence microscopy experiments.
RNA in vitro transcription, purification and capping
RNA was prepared using in vitro transcription with in-house purified T7 polymerase (35). The DNA template was obtained from one of two different sources. In the first case, two DNA primers were mixed, where the forward primer encodes for the T7 promoter and the reverse primer encodes for the desired RNA sequence plus the T7 promoter. In the second case, the DNA template was cloned into a vector that coded for the target RNA sequence followed by a 3΄ HDV ribozyme that cleaves at the end of the target RNA sequence and results in a 3΄ cyclic phosphate.
In vitro transcribed RNA was purified under denaturing conditions at 80°C using anion exchange chromatography with a DNAPac PA100 column (22 × 250 mm, Dionex) (Buffer D: 20 mM Tris, pH 8, 5 M urea; Buffer E: as D, plus 2 M NaCl) (35–37). The target RNA was precipitated from the pooled fractions by addition of 0.7 volumes isopropanol and incubation at −20°C for several hours. The precipitate was collected by centrifugation, washed with 70% ethanol and resuspended in water. Complete desalting was achieved using a PD10 column, followed by SpeedVac concentration to obtain pure dry RNA product. RNA was resuspended at concentrations required for subsequent experiments. The quality of the RNA was assessed using urea-polyacrylamide gel electrophoresis (PAGE) with 1× TBE (Tris/Borate/EDTA; 89 mM Tris, pH 8.0, 89 mM boric acid, 2 mM EDTA) as a running buffer. RNA was visualized by methylene blue staining.
5mer RNA was produced from a purified GA-containing 30mer RNA with a single uridine nucleotide at position 5 that was subjected to preparative RNaseA cleavage (35). After phenol–chloroform extraction, the different RNA species were separated by anion exchange chromatography as described above. Fractions containing the 5mer RNA were pooled and supplemented with 3.5 volumes ethanol and 0.2 M NaCl. After incubation at −20°C for at least 12 h, the precipitate was treated further as described above.
Capped RNA was prepared as previously published (35). For a 21mer RNA the capping efficiency was directly analyzed by Urea-PAGE, while a 100mer (U15) RNA was treated with RNaseA before gel analysis as described (35).
For labeling of RNA with a fluorescent dye, a GA-containing 30mer RNA with a single uracil nucleotide at position 15 was transcribed in the presence of 4-thiouridine triphosphate instead of Uridine triphosphate (UTP). The transcript was purified and capped as described above. Fluorescence labeling was achieved using 5-(iodoacetamido)-fluorescein following published protocols (36,38).
Liquid–liquid phase separation experiments
For in vitro phase separation experiments, samples were prepared in glass-bottom 1536-well plates (Greiner). Stock solutions of RNA, DNA, proteins and different buffer conditions were prepared in 96-well V-bottom plates (Greiner). A Mosquito pipetting robot (TTP Labtech) was used for transferring liquids from the 96-well source plates to the 1536-well assay plates. The general pipetting order was (i) buffer, (ii) RNA or DNA and (iii) proteins (Dcp1:Dcp2, Pdc1, Edc3). Automated pipetting routines were applied for a thorough mixing of the samples prior to analysis. The total sample volume in the 1536-well plates was 5 μl. Unless indicated otherwise, the salt concentration used was 125 mM.
1536-well plates were analyzed immediately after preparation in a Synergy Mx plate reader (BioTek) at 30°C. To avoid droplet maturation during prolonged pipetting routines, only four out of 48 columns of the 1536-well plates were prepared in parallel. The absorption at 630 nm (as a good estimate of the OD595) was used as a quantitative measure for phase separation.
For LLPS maturation experiments, Edc3 samples were prepared at 150 μM in 25 mM HEPES, pH 7.3 and 20, 30, 40, 50, 60, 70, 80, 90, 100 or 125 mM NaCl. At each time-point, the solution was mixed by pipetting and the absorption at 595 nm (OD595) was measured. Subsequently, 8 μl of the sample were collected and mixed with 2 μl 2.5 M NaCl to dissolve liquid-like droplets. The protein concentration of this clear solution was measured and the concentration of the sample was calculated, thereby considering the dilution factor. The fraction of insoluble protein (gel) was determined as the loss in the protein concentration.
Microscopy
Fluorescent droplets were observed at room temperature with a Zeiss Axio Observer Z1 equipped with an AxioCam MRM imaging system. Micrographs were processed with Fiji (39).
NMR
All NMR samples were in SEC buffer and contained 5% D2O. NMR spectra were recorded at 283 K on Bruker AVIII-600 and AVIII-800 spectrometers with room temperature probe-heads. Backbone and side-chain resonances were assigned using HSQC-based HNCACB, HN(CO)CACB, HNCACO, HNCO and CC(CO)NH experiments (40). NMR titration experiments were carried out with 0.01–0.1 mM 15N-labeled protein (Edc3 IDR) and a 4-fold excess of unlabeled protein (Edc3 YjeF_N or Ste13 RecA2 domain) or an equimolar amount of RNA or DNA. NMR spectra were processed using the NMRPipe/NMRDraw software suite (41). Figures displaying NMR spectra were produced using NMRview (onemoonscientific.com).
ITC
Isothermal Titration Calorimetry (ITC) data were recorded at 20°C with a TA Instruments NanoITC Low Volume calorimeter, where the cell contained Edc3 IDR into which a 30mer RNA was titrated. To account for heats arising from dilution, a control experiment was performed in which the 30mer RNA was titrated into buffer. ITC data were fitted using in house written Matlab scripts using an independent binding model.
Decapping assays
RNA decapping assays were performed as triplicates at 30°C in 20 μl SEC buffer (supplemented with 0.1 mM EDTA) containing 1 μM Dcp1:Dcp2, 20 μM capped RNA and 15 μM bovine serum albumin (BSA). The reaction mixture was complemented with 15 μM of either full-length Edc3, Edc3 LSm, Edc3 IDR or Edc3 YjeF_N or 15 μM of each Edc3 LSm, IDR and YjeF_N. The decapping reaction was started by addition of MgCl2 to a final concentration of 5 mM. At different time-points 4 μl samples were collected and the reaction was quenched by addition of 26 μl stop solution (10 mM EDTA, pH 8.0, 500 mM NaCl) and 15 μl phenol–chloroform–isoamylalcohol. Depending on the length of the used RNA, the upper aqueous RNA-containing phase was either directly subjected to high-pressure liquid chromatography (HPLC) analysis or was treated with RNaseA first, followed by another phenol–chloroform extraction step to remove the enzyme before HPLC analysis.
HPLC analysis
Ten microliters of the quenched reaction were automatically injected onto an analytical DNAPac PA200 RS column (4.6 × 250 mM, Dionex). Capped and decapped RNA were separated by anion exchange HPLC at 50°C using appropriate gradients (buffer F: 25 mM Tris, pH 8; buffer G: as buffer F, plus 1.5 M NaCl) at a flow rate of 0.45 ml/min. Eluting RNA was detected using the absorption at 260 nm (Supplementary Figure S1A).
Analysis of degradation data
Substrate and product peaks were integrated and corrected for different absorption coefficients of capped and decapped RNA to calculate the ratio of the two RNA species in the sample. The fractions of decapped RNA at different time-points were fitted to fit to a first order curve using in house written Matlab scripts. Based on the known concentrations of Dcp2 and RNA in the reaction mixture the decapping rates (kcat in min−1) were derived.
RNaseA protection assays
RNaseA protection assays were performed at 37°C in 50 μl SEC buffer containing 25 μM of a 30mer GA-containing RNA with a single uracil nucleotide at position 10. The reaction was complemented with 15 μM Dcp1:Dcp2 and/or 30 μM full-length Edc3 or 30 μM of each Edc3 LSm, IDR and YjeF_N. A sample that only contained RNA but no additional proteins served as a control. The reaction was started by addition of 10 nmol RNaseA per nmol RNA. After 10 min, 4 μl 5M NaCl were added to dissolve any liquid-like droplets and the reaction was quenched by addition of 54 μl phenol–chloroform–isoamylalcohol. Ten microliters of the upper aqueous RNA-containing phase were mixed with an equal volume of 2× RNA loading dye. RNA species were separated on a 15% urea–polyacrylamide gel and band intensities were analyzed with Fiji (39) to determine the fraction of cleaved RNA. A protection factor was calculated by dividing the fraction of cleaved RNA for each sample by the fraction of cleaved RNA for the control sample.
RESULTS
High-throughput approach for LLPS determination
In previous work (18), we studied the LLPS process of the Dcp1:Dcp2 decapping complex and the Edc3 adaptor protein (Figure 1A). In those experiments purified proteins were manually mixed in 96-well plates and the presence of phase separations was assessed using a wide field microscope. For each condition in the 96-well plates we used an 80 μl protein solution and for a small phase diagram with 30 unique conditions we required tens of mg protein. Due to the long time it takes to manually prepare these grids and due to the high amount of required protein this approach is not feasible for larger LLPS screens. To be able to probe LLPS in a fast, reliable and high-throughput manner, we reduced the volume per condition by a factor of 16. To pipette small volumes we used a pipetting robot and 1536-well plates. Importantly, this process also increased the speed and accuracy of the pipetting procedure.
After mixing the individual protein components, the LLPS process results in the formation of droplets that fuse over time and then settle on the bottom of the well as a homogeneous layer. In our previous setup it took on the order of hours to record stacked images of 30 conditions, during which the appearance of the droplets gradually changed. On a macroscopic level, LLPS is visible as a turbidity of the solution (17). In our new setup, we measure this turbidity directly in a plate reader. Importantly, this turbidity correlates directly with the amount of LLPS as judged from manually interpreted microscopy images (Figure 1B, Supplementary Figure S2). From that we conclude that the turbidity provides an unbiased and quantitative measure of the LLPS process. The determination of the turbidity of hundreds of conditions takes under a minute in a plate reader, which ensures that all conditions are assessed at the same stage. In summary, we here established a fast method by which large phase separation diagrams can be reliably and quantitatively measured with minimal amounts of material.
To test our novel strategy we assessed how salt influences the LLPS potential of Dcp1:Dcp2 and Edc3. Previous studies have shown that salt can either inhibit (11,13,14) or enhance (42,43) the LLPS process, indicating the formation of cellular foci does not always follow the same molecular principles. Here, we used phase separation diagrams with 15 × 8 conditions and prepared six grids with salt concentrations between 50 and 200 mM (720 unique conditions; Figure 1C). These data clearly show that an increase in the salt concentration results in a gradual shift of the phase separation boundary toward higher protein concentrations. From these data we conclude that electrostatic interactions play a role in the clustering of Dcp1:Dcp2 and Edc3. In addition, these data reveal that the increase in the number of in vivo cytosolic processing bodies upon increased extracellular salt concentrations (29) is not a direct effect.
Pdc1 stimulates LLPS
In vitro, LLPS has only been addressed for systems with a limited number (two to three) of components. In a cellular setting, LLPS foci, including processing bodies, contain tens of proteins and nucleic acids. Based on our novel high-throughput approach, we set out to assess the effect the addition of proteins has on the phase diagram boundaries. First, we complemented the Dcp1:Dcp2:Edc3 in vitro system (18) with the processing body protein Pdc1 (33) (Figure 1A) and observe that the presence of Pdc1 reduces the amounts of Dcp1:Dcp2 and Edc3 that are required to induce phase separations (Figure 1D). In the extreme case, the absence of Dcp1:Dcp2 can be compensated for by the presence of Pdc1, clearly illustrating the redundancy of the interactions that lead to phase separation and processing body formation. Importantly, the addition of the unrelated protein BSA does not influence the phase separation boundary, indicating that the Pdc1 effect is not due to molecular crowding (Supplementary Figure S3A). In agreement with that, also the addition of a crowding agent has no significant effect on the LLPS boundaries (Supplementary Figure S3A), although crowding agents are reported to increase LLPS in other systems (12,13). Like mentioned above, in the salt-dependent LLPS experiments, there thus appears to be no general rules that can describe the mechanisms that underlie the spontaneous clustering of proteins.
RNA strongly stimulates LLPS
In a second set of experiments, we investigated the effect of RNA on the phase separation diagram. To that end, we complemented Dcp1:Dcp2:Edc3 grids with 5 μM RNA of increasing length (Figure 2A). Interestingly, we observe that a small RNA with 15 nt has no effect on the phase diagrams. This is most likely due to the inability of this RNA to cross-link between different proteins. Longer RNAs, especially RNA with 30 or more nucleotides, have a strong impact on the phase diagrams and significantly shift those toward lower Edc3 and Dcp1:Dcp2 concentrations. Remarkably, we observe that Edc3 alone as well as Dcp1:Dcp2 alone is able to undergo efficient phase separation in the presence of RNA (e.g. Figure 2A, bottom middle panel at zero Edc3 or Dcp1:Dcp2 concentrations). As for Pdc1, this underlines the redundancy in the phase separation systems. Noteworthy, the addition of DNA does not have a influence on the LLPS process, indicating that the Dcp1:Dcp2:Edc3 system is selective for RNA.
Figure 2.

RNA strongly enhances LLPS. (A) Phase diagrams of Dcp1:Dcp2:Edc3 supplemented with 5 μM RNA of different length. RNA of 30 bases or more significantly moves the phase separation boundaries to lower concentrations, whereas DNA has no effect on the phase diagram. (B) Phase diagrams of Dcp1:Dcp2:Edc3 supplemented with RNA, however, as opposed to panel A, the total amount of nucleotides is kept constant. The phase diagrams show that one 100mer RNA has the same effect as three 30mer RNAs and indicate that the RNA-binding events with Dcp1:Dcp2:Edc3 are fully independent. Shorter RNAs have no influence on the phase separation diagrams, indicating that the minimal length of an RNA that can efficiently be incorporated into the interaction network is around 30 bases. (C) Fluorescence microscopy images of Dcp1:Dcp2:Edc3 that is complemented with fluorescently labeled RNA. The RNA is highly enriched in the droplet phase. Addition of Dcp1:Dcp2 and Edc3 (no preformed Dcp1:Dcp2:Edc3 foci) to RNA (left) results in larger foci as when the RNA is added to Dcp1:Dcp2:Edc3 foci, indicating that RNA is a highly efficient nucleation factor. No fluorescent signal is detected in the droplet phase in the absence of RNA (Supplementary Figure S3B).
In the experiments above, we kept the molar RNA concentration constant and increased the length of the oligonucleotide. To directly address how the length of the RNA influences the effect on the phase separations, we performed complementary experiments where we kept the number of nucleotides constant. In those experiments, we added a higher molar amount of a short RNA and a lower molar amount of the long RNAs. These experiments show that RNA substrates of 15 nt or less have no or only a weak effect on the phase diagrams, whereas substrates of 30 or more nucleotides have a similarly strong effect (Figure 2B). This shows that three 30mer RNAs have the same effect as one 100mer RNA, which provides strong evidence that the individual protein:RNA interactions are independent. In addition, our data indicate that the RNA length that is required to efficiently link into the interaction network is around 30 nt.
To experimentally validate that the RNA directly engages into the protein:protein interaction network we coupled the transcript to a fluorescence dye. Based on fluorescence microscopy images, we can unambiguously observe a strong enrichment of the labeled RNA in the droplet phase (Figure 2C). Importantly, we observe that the size and the number of the liquid-like droplets depend on the order in which the components are mixed. Addition of Edc3 and Dcp1:Dcp2 to the RNA resulted in larger and fewer droplets (Figure 2C, left), whereas addition of RNA to preformed Edc3:Dcp1:Dcp2 droplets resulted in more and smaller droplets (Figure 2C, right). This indicates that RNA plays an important role in the nucleation dynamics of the LLPS process and that it can act as a strong nucleation factor (44) around which fast growing processing bodies are formed.
RNA is protected against degradation by LLPS
Inside the droplet phase the RNA is engaged in a tight network of protein:RNA interactions. This can provide advantages as it can potentially protect the transcript from exo- and endonucleolytic degradation. To test this hypothesis experimentally, we prepared an RNA substrate with 30 nt that contains a single uridine at position 10. This site is a target for the RNaseA enzyme that can cleave the substrate into 10mer and 20mer products (Figure 3). We then complemented the system with combinations of Dcp1:Dcp2 and Edc3. At the concentrations that we used, addition of Dcp1:Dcp2 resulted in weak phase separations (Figure 2A and B) and a small degree of protection of the RNA (less cleavage). Addition of Edc3 resulted in intermediate phase separations and intermediate protection of the substrate. This protection is not due to direct interactions between the RNA and Edc3 as addition of the individual domains of Edc3 does not result in LLPS and does not protect the RNA from RNaseA cleavage. Addition of both Dcp1:Dcp2 and Edc3 results in significant phase separations and also in a significant protection of the RNA substrate. From these data we conclude that the LLPS process is able to protect the RNA substrate from enzymatic cleavages and degradation.
Figure 3.

RNA is protected within LLPS foci. (A) RNase cleavage of a 30mer RNA (that contains a single RNaseA cleavage site at position 10) is reduced upon phase separation. This shows that the RNA within in vitro processing bodies is protected against RNase activity. This protection is not due to direct interactions between Edc3, Dcp1 or Dcp2 with RNA as addition of the same amount of the individual Edc3 domains (LSm, IDR and YjeF_N) does not result in RNase protection (and LLPS). The amount of LLPS is indicated on top, where the color scheme of Figure 1B is used. (B) The Dcp2 activity on a short RNA of 20 nt is independent of LLPS. (C) The Dcp2 activity on a longer RNA of 100 nt is significantly reduced upon LLPS. This is not due to direct interactions, as the addition of the individual Edc3 domains has no influence on the decapping activity (see also A). The long RNA is efficiently embedded in the intermolecular interaction network that lead to LLPS (Figure 2), whereas the short RNA is not able to enhance phase separations of Dcp1:Dcp2:Edc3. It should be noted that the measured decapping activity is a weighted average of the activity of Dcp2 inside and outside the in vitro processing bodies, due to the exchange of components between the two phases. The activity of the decapping complex that is purely within the in vitro processing bodies is thus likely even lower than what we observe here.
LLPS reduces the catalytic activity of Dcp2
One of the central components of processing bodies is the decapping complex Dcp1:Dcp2. To address how the activity of this enzyme complex is influenced by the inclusion into processing bodies we performed mRNA decapping experiments under multiple turnover conditions in the presence and absence of in vitro processing bodies. In these experiments we kept the concentration of the Dcp1:Dcp2 decapping complex constant and supplemented this with full length Edc3 (to induce phase separation) or with exactly the same concentration the individual Edc3 domains (LSm, IDR and YjeF_N; Figure 1A) that cannot induce LLPS. This ensures that the protein content in the different experiments is identical and thereby prevents indirect effects. Interestingly, we find that a small, capped RNA with 20 nt is decapped in the presence and absence of in vitro processing bodies with the same efficiency. This correlates with the limited effect that this short RNA has on LLPS (Figure 2B). In agreement with previous findings, we do, however, observe a modest stimulating effect of the Edc3 LSm domain on the decapping activity (19,45). Interestingly, for longer substrates with an RNA body of 100 nt, which efficiently induce LLPS, we observe that the decapping activity is significantly slower under phase separation conditions. These in vitro results suggest that mRNA that is tightly embedded in in vivo processing bodies could be protected against decapping.
The IDR in Edc3 specifically interacts with RNA
Edc3 contains an IDR region that links the N-terminal LSm domain and the C-terminal YjeF_N dimerization domain (Figure 1A, Supplementary Figure S4A). To elucidate the importance of this IDR for LLPS we deleted it from the Edc3 protein and prepared phase separation grids in the presence of Dcp1:Dcp2 (Figure 4A). In the absence of RNA, we observe that deletion of the IDR moves the phase separation boundary slightly toward higher concentrations. More importantly, the addition of RNA to Edc3 lacking the IDR does not result in the strong shift of the phase separation boundary toward lower protein concentrations as observed for full-length Edc3 (Figure 4A). This effect is even more prominent in RNA:Edc3 phase diagrams, where the removal of the IDR results in the almost complete loss of LLPS (Figure 4B). These data indicate that the IDR in Edc3 is an important RNA interaction site.
Figure 4.

The Edc3 IDR specifically interacts with RNA. (A) Phase separation diagrams of Dcp1:Dcp2 and Edc3 in the absence (top) and presence (bottom) of a 30mer RNA. RNA is able to significantly shift the phase separation boundary for the WT Edc3 protein (left). Upon deletion of the IDR the effect of RNA on the phase diagrams is reduced (right). (B) Phase separation diagrams of Edc3 and a 30mer RNA. Edc3 and RNA are sufficient to induce LLPS (left). A version of Edc3 that lacks the IDR is no longer able to undergo phase separations in the presence of RNA only. (C) 1H-15N NMR spectra of the Edc3 IDR in the absence (black) and presence (red) of an equimolar amount of RNA of 15 nt. A large number of resonances are significantly weaker or undergo chemical shift perturbations (CSPs), indicating a direct interaction between the RNA and the IDR. A number of assignments are indicated. (D) The extent of the CSPs that are induced by the RNA correlate with the length of the RNA. This indicates that one RNA can interact with multiple IDRs. (E) Plot of the loss of intensity of the NMR signals in the Edc3 IDR upon addition of a 30mer RNA. Three regions in the Edc3 IDR interact with RNA: a region around residue 80, a region around residue 130 and a region around residue 180. (F) ITC binding experiments reveal a μM affinity between a 30mer RNA and the Edc3 IDR. The exact affinity cannot be extracted due to the unknown stoichiometry of the interaction.
To assess which residues in the Edc3 IDR interact with RNA, we used NMR spectroscopy. NMR spectra of the Edc3 IDR in the absence and presence of RNA show clear chemical shift perturbations (CSPs) that are restricted to a subset of the resonances (Figure 4C). This indicates that a specific part of the IDR directly contacts the RNA. Interestingly, the extent of the observed CSPs correlates with the length of the added RNA (Figure 4D), which shows that multiple IDRs can interact with a single RNA, in agreement with the phase separation diagrams of Edc3:Dcp1:Dcp2 and RNA (Figure 2C). Based on the assignments of the Edc3 IDR resonances, there are three RNA interaction sites that are centred around residues 80, 130 and 180 (Figure 4E). Notably, the region between residues 155 and 175, which is devoid of any positively charged residues, does not interact with RNA. ITC measurements reveal that the affinity between the RNA and the Edc3 IDR is in the μM range (Figure 4F), although exact affinities cannot be extracted due to the unknown and dynamic stoichiometry of the Edc3 IDR:RNA interaction. The μM affinity is, however, in full agreement with other interactions that play a role in LLPS and allows for rapid readjustments within the interaction network (17,18). Noteworthy, NMR titration experiments do not reveal an interaction of DNA with the Edc3 IDR (Supplementary Figure S4B and C). This is in agreement with our finding that DNA has no significant effect on the Edc3:Dcp1:Dcp2 phase diagram (Figure 2A). Thus, the unstructured Edc3 IDR appears to be able to discriminate between RNA and DNA.
Maturation of processing bodies
Previous work has shown that cellular LLPS can undergo maturation and form more solid-like structures that, in specific cases, correlated with human disease (12). Interestingly, we observe that fused Edc3:Dcp1:Dcp2 droplets also form a gel-like film over time that can be scratched off the well of a 96-well plate with a tip of a pipette (Figure 5A). In addition, as opposed to freshly formed LLPS droplets, this film does not rapidly dissolve upon dilution and is resistant to high salt concentrations (Supplementary Figure S5). We therefore conclude that droplets that are formed from processing body components also undergo maturation.
Figure 5.
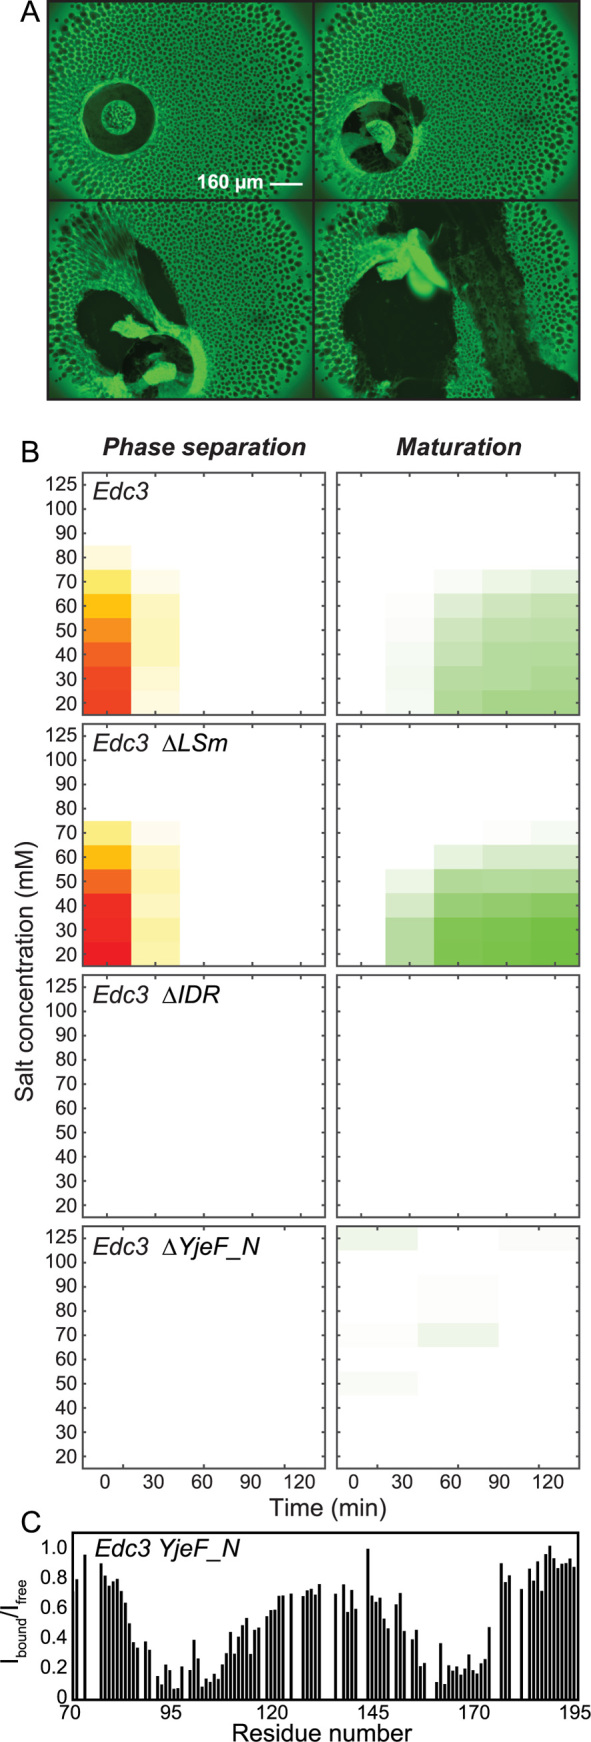
Maturation of in vitro processing bodies. (A) Successive fluorescence microscopy images that were taken of Dcp1:Dcp2:Edc3 phase separated proteins after incubation for 12 h. The proteins formed a gel-like film on the bottom of the well that could be scratched off using a pipette tip. (B) The LLPS (left panels) and maturation (right panels) of the Edc3 protein at different salt concentrations (y-axis) were monitored over time (x-axis). The full-length Edc3 protein (top panel) undergoes phase separation at lower salt concentrations. The formed foci (left) merge and subsequently form a gel-like film (right). Removal of the IDR or the YjeF_N domain in Edc3 inhibited the LLPS and maturation processes, indicating that the interaction between these domains plays an important role in the maturation of Edc3 containing foci. (C) The Edc3 YjeF_N domain interacts directly with two regions in the Edc3 IDR, around residue 100 and around residue 165. Plotted is the loss of intensity of the IDR NMR resonances upon addition of the YjeF_N domain. See also Supplementary Figure S7.
To unravel which interactions contribute to the maturation effect we focused on the Edc3 protein. Edc3 in isolation undergoes phase separations at high concentrations in a salt- and temperature-dependent manner even in the absence of RNA and Dcp1:Dcp2 (Figure 1C at zero Dcp1:Dcp2 concentration). Maturation occurs over time and to assess the underlying mechanisms of this process we measured both turbidity (as a measure of the phase separation) and the soluble protein concentration (as a measure of the amount of protein that engages in the insoluble mature phase) at different time points. To modulate the amount of LLPS we performed these measurements at ten salt concentrations between 20 and 125 mM. At salt concentrations between 20 and 80 mM, the Edc3 WT protein undergoes LLPS and liquid-like droplets form (Figure 5B, top left panel). Over time, these droplets disappear and in parallel a gel-like mature phase forms (Figure 5B, top right panel). At salt concentrations above 80 mM, Edc3 does not undergo LLPS and no mature phase is formed. This indicates that the formation of the gel-like structure is a direct result of the formation of liquid-like droplets and that the LLPS is required for the aggregation process. Next, we repeated these experiments with Edc3 proteins that lack the LSm domain (Figure 5, second row), the IDR (third row) or the YjeF_N domain (bottom row) and observe that removal of either the IDR or the YjeF_N domain prevents the formation of matured phase. Our data thus suggest that an interaction between the Edc3 IDR and YjeF_N domain underlies the maturation of in vitro processing bodies. To confirm an interaction between the Edc3 IDR and YjeF_N domains we performed NMR titration experiments and identified two regions in the Edc3 IDR that directly and independently interact with the YjeF_N domain (Figure 5C; Supplementary Figure S6A and B). Only upon deletion of both these regions, the interaction between the Edc3 IDR and the Edc3 YjeF_N domain is abolished, while the ability of RNA binding persists (Supplementary Figure S6C), indicating both interactions are not competing with each other.
DISCUSSION
Processing bodies are ubiquitous in eukaryotic cells; nevertheless their function remains a matter of debate. Therefore, we here address the formation and subsequent maturation of processing bodies. In addition, we examine how the activity of the decapping enzyme is modulated by the incorporation into highly densely packed cellular foci.
The formation of cellular foci is governed by a redundant set of intermolecular interactions that initially result in the appearance of liquid-like droplets that spontaneously separate from the surrounding. In vivo, this LLPS process is counteracted by processes that can disintegrate these cellular foci into individual soluble proteins (22–25). In an in vitro setting, however, liquid droplets continuously flow and fuse into larger assemblies that eventually settle as a homogeneous layer on the bottom of a test tube (18). In order to study the mechanisms behind LLPS processes in an in vitro setting it is thus important to assess the formation of liquid droplets rapidly, before the proteins that are involved are irreversibly aggregating into gel-like structures. To that end, we here introduce an approach where hundreds of conditions can be screened rapidly, such that the irreversible aggregation of proteins can be neglected. Our approach is based on the use of small volume pipetting robotics and the assessment of the LLPS through turbidity measurements. These quantitative turbidity measurements on 5 μl volumes correlate very well with the LLPS experiments on 80 μl volume samples using microscopic techniques (Figure 1B). The small volume turbidity measurements, however, require significantly less time (factor of 100) and sample (factor of 16) and thus allow for the reliable assessment of LLPS screens that report only on the initial clustering process without interference from the maturation/aggregation process.
Based on the above methodology we assessed how incorporation of processing body proteins and RNA in in vitro assays influences the phase separation boundary. Pdc1 significantly reduces the required concentrations of Dcp1:Dcp2 and Edc3 to induce LLPS (Figure 1D). Mechanistically this can be explained by the interactions between the Pdc1 HLMs and the Edc3 LSm domain that reduce the requirement of the Dcp2 HLMs to form indefinite interaction networks (18). Importantly, RNA is also able to significantly reduce the concentrations that are required for the LLPS process of Dcp1:Dcp2 and Edc3 (Figure 2A and B). To that end, the RNA needs to be longer than 20–30 bases. Shorter RNAs are most likely not able to bridge between different RNA binding sites in Dcp2 and Edc3 and can therefore not enhance the clustering process. RNA that is longer than 30 bases is efficient in influencing the LLPS process, where three 30mer RNAs have the same effect as one 100mer RNA has. This indicates that the multiple protein:RNA interactions in long RNAs are independent.
Cellular phase separation processes are modulated by interactions between folded protein domains (e.g. the interaction between Dcp1 and Dcp2, or the interaction between Dcp1:Dcp2 and the Ge1 domain in Pdc1 (18); Figure 1A), interactions between disordered regions and folded protein domains (e.g. Edc3 LSm domain and the Dcp2 and Pdc1 HLMs (18,36); Figure 1A), interactions between folded protein domains and RNA (e.g. Dcp2 and RNA; Figure 1A). Here, we add a fourth type of interaction and show that the disordered region in Edc3 efficiently interacts with RNA (Figure 1A, Figure 4C–F). These IDR:RNA interactions are functionally important as removal of the IDR results in a reduction of the LLPS processes (Figure 4A and B). We show that the collaborative sum of all these interaction types is able to move the LLPS boundary to significantly lower concentrations. Within a cellular setting the concentrations of the Dcp1, Dcp2, Pdc1 and Edc3 proteins are approximately between 20 and 200 nM (46). Our phase diagrams now show clear LLPS close to these concentrations, despite the fact our used RNAs are significantly shorter than the average of cellular mRNAs and that a large number of processing body components are still absent from our in vitro setup. Based on the additive effect that we describe here we confidently predict that addition of more processing body proteins will result in the formation of foci at cellular concentrations. In that light, it is important to note that the proteins Pat, Lsm1-7, Dhh1 (Ste13), Xrn1 (Exo2), Scd6 and Edc1 are all reported to interact with Dcp1, Dcp2, Edc3, Pdc1 and/or RNA (19,36), and that they can thus be efficiently embedded into the intermolecular interaction network that drives the LLPS process.
Maturation of cellular foci is implicated with medical disorders. Due to the high local protein concentration in cellular foci the phase-separated proteins are likely prone to aggregation that can lead to the formation of amyloid-like structures. Here, we observe that in vitro processing bodies also evolve into highly insoluble aggregates. This maturation is driven by interactions between the Edc3 IDR and the Edc3 YjeF_N domain (Figure 5). To what degree the maturation of processing bodies in an in vivo setting is correlated with medical disorders will be an exciting question for future studies.
Based on our data, the 120 amino acid long IDR region of Edc3 plays multiple roles (Figure 1A; Supplementary Figure S4A), in agreement with the previously reported importance of Edc3 in processing body formation (15). First, it directly interacts with RNA and thereby enhances LLPS. Second, an FDF amino acid motif in this region is able to recruit the helicase Dhh1 (Ste13) through interactions with the second RecA domain. This interaction was previously shown for the human homologs (47) and is conserved in S. pombe (Supplementary Figure S7). Finally, the Edc3 IDR directly interacts with the Edc3 YjeF_N dimerization domain, which is involved in the irreversible maturation process. Interestingly, the Dhh1 (Ste13), RNA and YjeF_N binding sites in the Edc3 IDR partially overlap (Figures 4E and 5C; and Supplementary Figure S7). Whether the interaction of RNA with Edc3 influences the maturation process in processing bodies, as was recently shown for Whi3 droplets (20), remains to be determined. In summary, we define the IDR in Edc3 as a multivalent interaction platform for proteins and RNA, which underscores the importance of disordered regions in proteins for function (48).
To address the functional implication of processing bodies we assessed the mRNA decapping activity within these foci (Figure 3B and C). Interestingly, the mRNA decapping activity is reduced within processing body-like structures for RNA substrates longer than 20 nt. These longer RNAs are tightly incorporated within the network of interactions that drives processing body formation, which will restrict their local diffusion rates. The reduction in decapping activity within our in vitro processing bodies correlates well with the proposed role of processing bodies in temporary mRNA storage (21,29,34,49), where mRNA is temporarily taken out of the translational pool such that the cell can react efficiently to stress situations. In agreement with that, the RNA inside droplets is also protected against RNase activity (Figure 3A).
In summary, our data reveal a highly intertwined network of intermolecular interactions that is responsible for the formation and maturation of processing bodies. Interestingly, this network of interactions is able to significantly reduce the mRNA decapping activity. Our studies thereby provide unique insights into the mechanisms of formation and the functional implication of processing bodies.
Supplementary Material
ACKNOWLEDGEMENTS
We acknowledge all members of the laboratory for discussions. We thank Iris Holdermann and Janina Petters for excellent technical assistance, Vincent Truffault for maintenance of the NMR infrastructure, Christian Liebig for Light Microscopy support and Tobias Butelmann for assistance with the protein production.
Footnotes
Present addresses:
Remco Sprangers, University of Regensburg, Universitätsstraße 31, 93040, Regensburg, Germany.
Erik R. Nöldeke, Interfaculty Institute of Biochemistry, University of Tübingen, Germany.
SUPPLEMENTARY DATA
Supplementary Data are available at NAR Online.
FUNDING
IMPRS ‘From Molecules to Organisms’ (to S.S., E.N); Max Planck Society; European Research Council under the European Union's Seventh Framework Programme (FP7/2007–2013) [616052 to R.S]. Source of open access funding: Max Planck Society .
Conflict of interest statement. None declared.
REFERENCES
- 1. Keating C.D. Aqueous phase separation as a possible route to compartmentalization of biological molecules. Acc. Chem. Res. 2012; 45:2114–2124. [DOI] [PMC free article] [PubMed] [Google Scholar]
- 2. Mitrea D.M., Kriwacki R.W.. Phase separation in biology; functional organization of a higher order. Cell Commun. Signal. 2016; 14:1. [DOI] [PMC free article] [PubMed] [Google Scholar]
- 3. Toretsky J.A., Wright P.E.. Assemblages: functional units formed by cellular phase separation. J. Cell Biol. 2014; 206:579–588. [DOI] [PMC free article] [PubMed] [Google Scholar]
- 4. Brangwynne C.P., Tompa P., Pappu R.V.. Polymer physics of intracellular phase transitions. Nat. Phys. 2015; 11:899–904. [Google Scholar]
- 5. Brangwynne C.P., Eckmann C.R., Courson D.S., Rybarska A., Hoege C., Gharakhani J., Julicher F., Hyman A.A.. Germline P granules are liquid droplets that localize by controlled dissolution/condensation. Science. 2009; 324:1729–1732. [DOI] [PubMed] [Google Scholar]
- 6. Brangwynne C.P., Mitchison T.J., Hyman A.A.. Active liquid-like behavior of nucleoli determines their size and shape in Xenopus laevis oocytes. Proc. Natl. Acad. Sci. U.S.A. 2011; 108:4334–4339. [DOI] [PMC free article] [PubMed] [Google Scholar]
- 7. Kroschwald S., Maharana S., Mateju D., Malinovska L., Nuske E., Poser I., Richter D., Alberti S.. Promiscuous interactions and protein disaggregases determine the material state of stress-inducible RNP granules. eLife. 2015; 4:e06807. [DOI] [PMC free article] [PubMed] [Google Scholar]
- 8. Kedersha N., Stoecklin G., Ayodele M., Yacono P., Lykke-Andersen J., Fritzler M.J., Scheuner D., Kaufman R.J., Golan D.E., Anderson P.. Stress granules and processing bodies are dynamically linked sites of mRNP remodeling. J. Cell Biol. 2005; 169:871–884. [DOI] [PMC free article] [PubMed] [Google Scholar]
- 9. Decker C.J., Parker R.. P-bodies and stress granules: possible roles in the control of translation and mRNA degradation. Cold Spring Harb. Perspect. Biol. 2012; 4:a012286. [DOI] [PMC free article] [PubMed] [Google Scholar]
- 10. Uversky V.N., Kuznetsova I.M., Turoverov K.K., Zaslavsky B.. Intrinsically disordered proteins as crucial constituents of cellular aqueous two phase systems and coacervates. FEBS Lett. 2015; 589:15–22. [DOI] [PubMed] [Google Scholar]
- 11. Nott T.J., Petsalaki E., Farber P., Jervis D., Fussner E., Plochowietz A., Craggs T.D., Bazett-Jones D.P., Pawson T., Forman-Kay J.D. et al. Phase transition of a disordered nuage protein generates environmentally responsive membraneless organelles. Mol. Cell. 2015; 57:936–947. [DOI] [PMC free article] [PubMed] [Google Scholar]
- 12. Molliex A., Temirov J., Lee J., Coughlin M., Kanagaraj A.P., Kim H.J., Mittag T., Taylor J.P.. Phase separation by low complexity domains promotes stress granule assembly and drives pathological fibrillization. Cell. 2015; 163:123–133. [DOI] [PMC free article] [PubMed] [Google Scholar]
- 13. Lin Y., Protter D.S., Rosen M.K., Parker R.. Formation and maturation of phase-separated liquid droplets by RNA-binding proteins. Mol. Cell. 2015; 60:208–219. [DOI] [PMC free article] [PubMed] [Google Scholar]
- 14. Elbaum-Garfinkle S., Kim Y., Szczepaniak K., Chen C.C., Eckmann C.R., Myong S., Brangwynne C.P.. The disordered P granule protein LAF-1 drives phase separation into droplets with tunable viscosity and dynamics. Proc. Natl. Acad. Sci. U.S.A. 2015; 112:7189–7194. [DOI] [PMC free article] [PubMed] [Google Scholar]
- 15. Decker C.J., Teixeira D., Parker R.. Edc3p and a glutamine/asparagine-rich domain of Lsm4p function in processing body assembly in Saccharomyces cerevisiae. J. Cell Biol. 2007; 179:437–449. [DOI] [PMC free article] [PubMed] [Google Scholar]
- 16. Banjade S., Wu Q., Mittal A., Peeples W.B., Pappu R.V., Rosen M.K.. Conserved interdomain linker promotes phase separation of the multivalent adaptor protein Nck. Proc. Natl. Acad. Sci. U.S.A. 2015; 112:E6426–E6435. [DOI] [PMC free article] [PubMed] [Google Scholar]
- 17. Li P., Banjade S., Cheng H.C., Kim S., Chen B., Guo L., Llaguno M., Hollingsworth J.V., King D.S., Banani S.F. et al. Phase transitions in the assembly of multivalent signalling proteins. Nature. 2012; 483:336–340. [DOI] [PMC free article] [PubMed] [Google Scholar]
- 18. Fromm S.A., Kamenz J., Noldeke E.R., Neu A., Zocher G., Sprangers R.. In vitro reconstitution of a cellular phase-transition process that involves the mRNA decapping machinery. Angew. Chem. 2014; 53:7354–7359. [DOI] [PMC free article] [PubMed] [Google Scholar]
- 19. Fromm S.A., Truffault V., Kamenz J., Braun J.E., Hoffmann N.A., Izaurralde E., Sprangers R.. The structural basis of Edc3- and Scd6-mediated activation of the Dcp1:Dcp2 mRNA decapping complex. EMBO J. 2012; 31:279–290. [DOI] [PMC free article] [PubMed] [Google Scholar]
- 20. Zhang H., Elbaum-Garfinkle S., Langdon E.M., Taylor N., Occhipinti P., Bridges A.A., Brangwynne C.P., Gladfelter A.S.. RNA controls polyQ protein phase transitions. Mol. Cell. 2015; 60:220–230. [DOI] [PMC free article] [PubMed] [Google Scholar]
- 21. Parker R., Sheth U.. P bodies and the control of mRNA translation and degradation. Mol. Cell. 2007; 25:635–646. [DOI] [PubMed] [Google Scholar]
- 22. Wippich F., Bodenmiller B., Trajkovska M.G., Wanka S., Aebersold R., Pelkmans L.. Dual specificity kinase DYRK3 couples stress granule condensation/dissolution to mTORC1 signaling. Cell. 2013; 152:791–805. [DOI] [PubMed] [Google Scholar]
- 23. Walters R.W., Muhlrad D., Garcia J., Parker R.. Differential effects of Ydj1 and Sis1 on Hsp70-mediated clearance of stress granules in Saccharomyces cerevisiae. RNA. 2015; 21:1660–1671. [DOI] [PMC free article] [PubMed] [Google Scholar]
- 24. Buchan J.R., Kolaitis R.M., Taylor J.P., Parker R.. Eukaryotic stress granules are cleared by autophagy and Cdc48/VCP function. Cell. 2013; 153:1461–1474. [DOI] [PMC free article] [PubMed] [Google Scholar]
- 25. Mugler C.F., Hondele M., Heinrich S., Sachdev R., Vallotton P., Koek A.Y., Chan L.Y., Weis K.. ATPase activity of the DEAD-box protein Dhh1 controls processing body formation. eLife. 2016; 5:e18746. [DOI] [PMC free article] [PubMed] [Google Scholar]
- 26. Hyman A.A., Weber C.A., Julicher F.. Liquid-liquid phase separation in biology. Annu. Rev. Cell Dev. Biol. 2014; 30:39–58. [DOI] [PubMed] [Google Scholar]
- 27. Ramaswami M., Taylor J.P., Parker R.. Altered ribostasis: RNA-protein granules in degenerative disorders. Cell. 2013; 154:727–736. [DOI] [PMC free article] [PubMed] [Google Scholar]
- 28. Patel A., Lee H.O., Jawerth L., Maharana S., Jahnel M., Hein M.Y., Stoynov S., Mahamid J., Saha S., Franzmann T.M. et al. A liquid-to-solid phase transition of the ALS protein FUS accelerated by disease mutation. Cell. 2015; 162:1066–1077. [DOI] [PubMed] [Google Scholar]
- 29. Teixeira D., Sheth U., Valencia-Sanchez M.A., Brengues M., Parker R.. Processing bodies require RNA for assembly and contain nontranslating mRNAs. RNA. 2005; 11:371–382. [DOI] [PMC free article] [PubMed] [Google Scholar]
- 30. Ingelfinger D., Arndt-Jovin D.J., Luhrmann R., Achsel T.. The human LSm1-7 proteins colocalize with the mRNA-degrading enzymes Dcp1/2 and Xrnl in distinct cytoplasmic foci. RNA. 2002; 8:1489–1501. [PMC free article] [PubMed] [Google Scholar]
- 31. Sheth U., Parker R.. Decapping and decay of messenger RNA occur in cytoplasmic processing bodies. Science. 2003; 300:805–808. [DOI] [PMC free article] [PubMed] [Google Scholar]
- 32. van Dijk E., Cougot N., Meyer S., Babajko S., Wahle E., Seraphin B.. Human Dcp2: a catalytically active mRNA decapping enzyme located in specific cytoplasmic structures. EMBO J. 2002; 21:6915–6924. [DOI] [PMC free article] [PubMed] [Google Scholar]
- 33. Wang C.Y., Chen W.L., Wang S.W.. Pdc1 functions in the assembly of P bodies in Schizosaccharomyces pombe. Mol. Cell. Biol. 2013; 33:1244–1253. [DOI] [PMC free article] [PubMed] [Google Scholar]
- 34. Brengues M., Teixeira D., Parker R.. Movement of eukaryotic mRNAs between polysomes and cytoplasmic processing bodies. Science. 2005; 310:486–489. [DOI] [PMC free article] [PubMed] [Google Scholar]
- 35. Fuchs A.L., Neu A., Sprangers R.. A general method for rapid and cost-efficient large-scale production of 5΄ capped RNA. RNA. 2016; 22:1454–1466. [DOI] [PMC free article] [PubMed] [Google Scholar]
- 36. Wurm J.P., Overbeck J., Sprangers R.. The S. pombe mRNA decapping complex recruits cofactors and an Edc1-like activator through a single dynamic surface. RNA. 2016; 22:1360–1372. [DOI] [PMC free article] [PubMed] [Google Scholar]
- 37. Audin M.J., Wurm J.P., Cvetkovic M.A., Sprangers R.. The oligomeric architecture of the archaeal exosome is important for processive and efficient RNA degradation. Nucleic Acids Res. 2016; 44:2962–2973. [DOI] [PMC free article] [PubMed] [Google Scholar]
- 38. Ramos A., Varani G.. A new method to detect long-range protein-RNA contacts: NMR detection of electron-proton relaxation induced by nitroxide spin-labeled RNA. J. Am. Chem. Soc. 1998; 120:10992–10993. [Google Scholar]
- 39. Schindelin J., Arganda-Carreras I., Frise E., Kaynig V., Longair M., Pietzsch T., Preibisch S., Rueden C., Saalfeld S., Schmid B. et al. Fiji: an open-source platform for biological-image analysis. Nat. Methods. 2012; 9:676–682. [DOI] [PMC free article] [PubMed] [Google Scholar]
- 40. Sattler M., Schleucher J., Griesinger C.. Heteronuclear multidimensional NMR experiments for the structure determination of proteins in solution employing pulsed field gradients. Prog. Nucl. Magn. Reson. Spectrosc. 1999; 34:93–158. [Google Scholar]
- 41. Delaglio F., Grzesiek S., Vuister G.W., Zhu G., Pfeifer J., Bax A.. NMRPipe: a multidimensional spectral processing system based on UNIX pipes. J. Biomol. NMR. 1995; 6:277–293. [DOI] [PubMed] [Google Scholar]
- 42. Conicella A.E., Zerze G.H., Mittal J., Fawzi N.L.. ALS mutations disrupt phase separation mediated by alpha-helical structure in the TDP-43 low-complexity C-terminal domain. Structure. 2016; 24:1537–1549. [DOI] [PMC free article] [PubMed] [Google Scholar]
- 43. Burke K.A., Janke A.M., Rhine C.L., Fawzi N.L.. Residue-by-residue view of in vitro FUS granules that bind the C-terminal domain of RNA polymerase II. Mol. Cell. 2015; 60:231–241. [DOI] [PMC free article] [PubMed] [Google Scholar]
- 44. Shevtsov S.P., Dundr M.. Nucleation of nuclear bodies by RNA. Nat. Cell Biol. 2011; 13:167–173. [DOI] [PubMed] [Google Scholar]
- 45. Harigaya Y., Jones B.N., Muhlrad D., Gross J.D., Parker R.. Identification and analysis of the interaction between Edc3 and Dcp2 in Saccharomyces cerevisiae. Mol. Cell. Biol. 2010; 30:1446–1456. [DOI] [PMC free article] [PubMed] [Google Scholar]
- 46. Marguerat S., Schmidt A., Codlin S., Chen W., Aebersold R., Bahler J.. Quantitative analysis of fission yeast transcriptomes and proteomes in proliferating and quiescent cells. Cell. 2012; 151:671–683. [DOI] [PMC free article] [PubMed] [Google Scholar]
- 47. Tritschler F., Braun J.E., Eulalio A., Truffault V., Izaurralde E., Weichenrieder O.. Structural basis for the mutually exclusive anchoring of P body components EDC3 and Tral to the DEAD box protein DDX6/Me31B. Mol. Cell. 2009; 33:661–668. [DOI] [PubMed] [Google Scholar]
- 48. Tompa P., Schad E., Tantos A., Kalmar L.. Intrinsically disordered proteins: emerging interaction specialists. Curr. Opin. Struct. Biol. 2015; 35:49–59. [DOI] [PubMed] [Google Scholar]
- 49. Bhattacharyya S.N., Habermacher R., Martine U., Closs E.I., Filipowicz W.. Relief of microRNA-mediated translational repression in human cells subjected to stress. Cell. 2006; 125:1111–1124. [DOI] [PubMed] [Google Scholar]
Associated Data
This section collects any data citations, data availability statements, or supplementary materials included in this article.