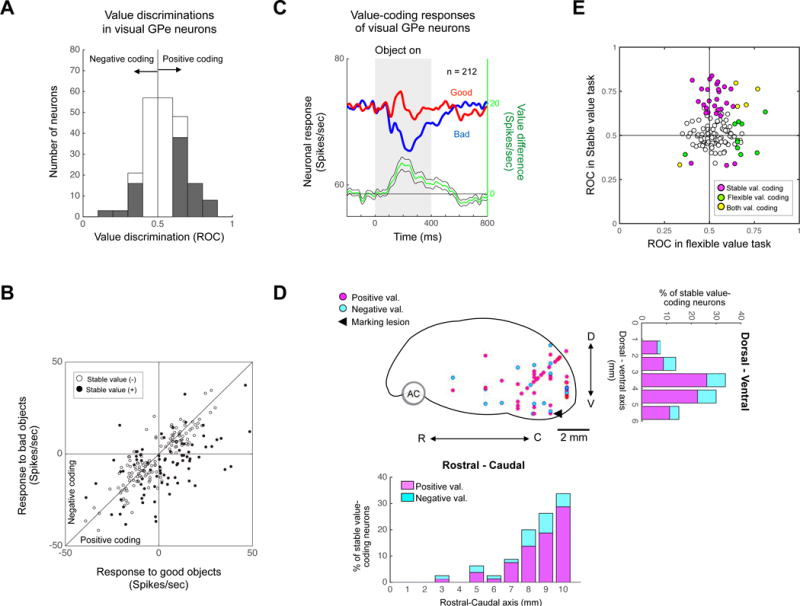
Figure 4. Population activity of stable value coding in GPe.

(A) Stable value discrimination of visual GPe neurons. For each neuron, the difference in response to good and bad objects was calculated as ROC area. ROC > 0.5: Good > Bad, ROC < 0.5: Bad > Good. Gray area indicates neurons that showed statistically significant stable value coding. (B) Comparison between responses to good objects (abscissa) and bad objects (ordinate) in passive viewing task for visual GPe neurons. The response was determined by the change in activity from the baseline to test period (as in Figure 2C). (C) Population response of visual GPe neurons to learned objects in passive viewing task. Green line indicates the value coding (i.e., good – bad) (mean ± SE). (D) Locations of stable value-coding neurons in sagittal view. D, dorsal; V, ventral; R, rostral; C, caudal. Neuronal distributions are projected to rostral-caudal axis (down) and dorsal-ventral axis (right). Number 0 indicates the rostral or dorsal border of GP. (E) Comparison between response to flexible (abscissa) and stable (ordinate) value coding for individual neurons. ROCs indicate the value discrimination calculated with neuronal responses in passive viewing task (Fig. 3C) and flexible value task (Fig. S2A).
