Abstract
Histone H3K4me1/2 methyltransferases MLL3/MLL4 and H3K27 acetyltransferases CBP/p300 are major enhancer epigenomic writers. To understand how these epigenomic writers orchestrate enhancer landscapes in cell differentiation, we have profiled genomic binding of MLL4, CBP, lineage-determining transcription factors (EBF2, C/EBPβ, C/EBPα, PPARγ), coactivator MED1, RNA polymerase II, as well as epigenome (H3K4me1/2/3, H3K9me2, H3K27me3, H3K36me3, H3K27ac), transcriptome and chromatin opening during adipogenesis of immortalized preadipocytes derived from mouse brown adipose tissue (BAT). We show that MLL4 and CBP drive the dynamic enhancer epigenome, which correlates with the dynamic transcriptome. MLL3/MLL4 are required for CBP/p300 binding on enhancers activated during adipogenesis. Further, MLL4 and CBP identify super-enhancers (SEs) of adipogenesis and that MLL3/MLL4 are required for SE formation. Finally, in brown adipocytes differentiated in culture, MLL4 identifies primed SEs of genes fully activated in BAT such as Ucp1. Comparison of MLL4-defined SEs in brown and white adipogenesis identifies brown-specific SE-associated genes that could be involved in BAT functions. These results establish MLL3/MLL4 and CBP/p300 as master enhancer epigenomic writers and suggest that enhancer-priming by MLL3/MLL4 followed by enhancer-activation by CBP/p300 sequentially shape dynamic enhancer landscapes during cell differentiation. Our data also provide a rich resource for understanding epigenomic regulation of brown adipogenesis.
INTRODUCTION
Enhancers are transcription factor (TF) binding platforms that integrate and interpret genetic and environmental signaling cues during development. Enhancers play a critical role in cell-type-specific gene expression during development (1). There are two major types of enhancers in mammalian cells, primed and active, which are marked by distinct histone modification patterns. Primed enhancers are marked by H3K4 mono- and di-methylations (H3K4me1/2) while active enhancers are marked by H3K27 acetylation (H3K27ac) in addition to H3K4me1/2 (2–4). The enhancer landscapes at different stages of differentiation and development are often described in epigenomic profiling studies. However, to go beyond the level of description and to understand how the enhancer landscape is created and reorganized, it is critical to determine the genome-wide binding profiles of enhancer epigenomic writers.
Our previous study identified MLL4 (KMT2D) and the functionally redundant MLL3 (KMT2C) as major H3K4me1/2 methyltransferases enriched on both primed (previously described as silent) and active enhancers (5). MLL3/MLL4 are essential for enhancer activation and cell-type-specific gene expression during cell differentiation (5,6). We also identified the functionally redundant CBP and p300 as site-specific histone acetyltransferases responsible for H3K27ac in mammalian cells (7). CBP and p300 are transcriptional coactivators enriched on active enhancers (8). Thus, H3K4 methyltransferases MLL3/MLL4 and H3K27 acetyltransferases CBP/p300 are major enhancer epigenomic writers. However, the functional relationship between MLL3/MLL4 and CBP/p300 in enhancer activation has remained unclear.
Adipogenesis is under the control of a cascade of sequentially expressed TFs. PPARγ and C/EBPα are principal adipogenic TFs while C/EBPβ is an early TF facilitating genomic binding of PPARγ, C/EBPα and other adipogenic TFs (9–12). Epigenomic mechanisms involving chromatin modifying enzymes also play critical roles in adipogenesis (13–15). Enhancer epigenomic writers MLL3/MLL4 and CBP/p300 are all essential for adipogenesis (5,16), although the genome-wide binding profiles of CBP/p300 during adipogenesis have not been shown.
Brown adipose tissue (BAT) burns fat to generate heat through mitochondrial uncoupling protein 1 (Ucp1) (17). Understanding molecular mechanisms that promote the development of the thermogenic BAT and the expression of Ucp1 and other BAT-enriched proteins may provide new ways to treat obesity (18). Previous studies have identified the transcription cofactor Prdm16 as a potent promoter of brown adipogenesis (19). A recent study showed that the adipogenic TF EBF2 determines and maintains brown adipocyte identity. EBF2 promotes expression of brown adipocyte genes by facilitating the genomic binding of PPARγ to its BAT-selective gene targets (20). However, epigenomic regulation of brown adipogenesis remains poorly understood.
In this study, we investigate dynamics of transcriptome, epigenome and epigenomic writers during adipogenesis of immortalized preadipocytes derived from BAT. We focus on dynamic profiles of enhancer epigenomic writers MLL4 and CBP, during adipogenesis, in addition to RNA-Seq of transcriptome, FAIRE-Seq of chromatin opening and ChIP-Seq of histone modifications (H3K4me1/2/3, H3K9me2, H3K27me3, H3K36me3 and H3K27ac), TFs (EBF2, C/EBPα, C/EBPβ, PPARγ and CTCF), transcription coactivator MED1 and RNA Polymerase II (Pol II). This compendium not only enables systematic characterization of the dynamic coordination between transcriptome and epigenome, but also provides a rich resource for understanding epigenomic regulation of brown adipogenesis. We show that MLL3/MLL4 are required for enhancer-binding of CBP/p300, that MLL3/MLL4 are required for the formation of super-enhancers (SEs) and that enhancer-priming by MLL3/MLL4 followed by enhancer-activation by CBP/p300 sequentially shape the dynamic enhancer landscapes during adipogenesis.
MATERIALS AND METHODS
Antibodies
The following antibodies were used in this study. Anti-C/EBPα (sc-61X, lot: G1112), anti-C/EBPβ (sc-150X, lot: L2910), anti-PPARγ (sc-7196X, lot: H1512), anti-p300 (sc-585X, lot: E2209) were from Santa Cruz Biotechnology (Dallas, TX, USA). Anti-CBP (7389S, lot: 1) was from Cell Signaling Technology (Danvers, MA, USA). Anti-MED1/TRAP220 (A300-793A, lot: 2), anti-RbBP5 (AA300-109A), anti-Menin (A300-105A) were from Bethyl Laboratories (Montgomery, TX, USA). Anti-EBF2 (AF7006, lot: CEUA0113081) was from R&D Systems (Minneapolis, MN, USA). Anti-CTCF (07-729, lot: 2054523), Anti-Pol II (17-672, lot: 2015592), anti-H3K4me3 (07-473, lot: 1974075) and Anti-H3K27me3 (07-449, lot: DAM1387952) were from Millipore (Billerica, MA, USA). Anti-H3K4me1 (ab8895, lot: GR61280-1), anti-H3K4me2 (ab7766, lot: GR102810-1), anti-H3K9me2 (ab1220, lot: 957002), anti-H3K27ac (ab4729, lot: GR81163-1), anti-H3K36me3 (ab9050, lot: 947436) were from Abcam (Cambridge, MA, USA). Anti-UTX was described previously (21). Anti-MLL4 and anti-SET1A were described previously (22).
Immortalization of primary brown preadipocytes and adipogenesis assay
All mouse experiments were approved by the Animal Care and Use Committee of NIDDK, NIH. Primary brown preadipocytes were isolated from interscapular BAT of newborn Pparγf/f mice (Jackson no. 004584) and immortalized with SV40T-expressing retroviruses generated from the pBabepuro-large T plasmid as described (23). For adipogenesis assay, cells were plated in growth medium (Dulbecco's modified Eagle's medium plus 10% fetal bovine serum (FBS)) at a density of 1.8 × 10⁶ cells per 15-cm dish 4 days before the induction of adipogenesis. At D0, confluent cells were induced with 0.02 μM insulin, 1 nM T3, 0.5 mM 3-isobutyl-1-methyl-xanthine (IBMX), 2 μg/ml dexamethasone and 0.125 mM indomethacin. At D2, D4 and D6, the cells were replenished with medium containing 10% FBS, 0.02 μM insulin and 1 nM T3. Cells were collected for ChIP-Seq, RNA-Seq and FAIRE-Seq at D-3, D0 (2 days after confluence), D2 and D7.
ChIP-Seq, RNA-Seq and FAIRE-Seq sample preparation
ChIP-Seq and RNA-Seq were performed as described (5). FAIRE-Seq samples were prepared by following a published protocol but with a few modifications (24). The procedures for crosslinking, sonication and cell lysis were the same as in the ChIP-Seq protocol. The resulting sonicated chromatin lysates were phase-separated by three rounds of phenol/chloroform extraction. Nucleosome-free DNA in the upper aqueous phase was precipitated with 0.3 M sodium acetate (pH 5.2), 20 μg glycogen and 2× volume of ice-cold ethanol. DNA was further treated with 10 μg of RNase A and purified using the QIAquick PCR Purification Kit (QIAGEN).
Western blot and immunoprecipitation experiments
Western blot of nuclear proteins using 50 μg nuclear extracts, and immunoprecipitation from 0.5 mg nuclear extracts were done as described previously (22).
Illumina pipeline analysis for ChIP-Seq, RNA-Seq and FAIRE-Seq data
Illumina pipeline analysis for ChIP-Seq, RNA-Seq and FAIRE-Seq data and the visualization of the data on the UCSC genome browser were performed as previously described (5).
Identification of ChIP-enriched regions for ChIP-Seq data and open chromatin region for FAIRE-Seq data
We determined ChIP-enriched regions using SICER (version 1.1) (25) as previously described (5). For ChIP-Seq of histone modifications (H3K4me1/2/3, H3K27ac, H3K36me3, H3K9me2 and H3K27me3), the window size of 200 bp and the false discovery rate (FDR) of 10−3 were used. For TFs (EBF2, C/EBPβ, C/EBPα, PPARγ and CTCF) and cofactors (CBP, MED1 and Pol II), the window size of 50 bp and the FDR threshold of 10−10 were used. The gap size for H3K36me3, H3K9me2 and H3K27me3 was chosen to be 2, 3 and 3 windows respectively, and the gap size for other ChIP-Seq data was chosen to be 1 window. MLL4 binding sites were identified using ChIP-Seq of MLL4 in MLL3/MLL4-deficient samples as the negative control (5). For other ChIP-Seq data, input libraries were used as control in SICER. For FAIRE-Seq samples, we ran SICER using a random background with window size of 25 bp and gap size of 25 bp and an E-value of 1000. Island-filtered reads were used for downstream analysis unless noted otherwise.
Gene annotation
We used the gene annotation from NCBI Reference Sequence Database (RefSeq) for mouse genome assembly mm9.
Identification of promoters and enhancers
Promoters were defined as ±1 kb from the transcription start sites (TSS). Promoters with H3K4me3 were regarded as active promoters. Non-promoter regions with H3K4me1 but not H3K4me3 were identified as enhancers. Enhancers with H3K27ac were defined as active enhancers. Enhancers without H3K27ac were defined as primed enhancers.
Clustering of genes by gene expression
TopHat (version 2.0.10) (26) and Cufflinks packages (version 2.2.1) (27) were employed to calculate the fragments per kilobase per million (FPKM) to measure the gene expression level. FPKMs were normalized with the median of the geometric means of fragment counts across all the libraries using Cuffnorm in Cufflinks package. Genes with FPKM > 1 were regarded as expressed.
To investigate the dynamics of gene expressions, we collected genes expressed at any of the four time points during adipogenesis. For each such gene, the relative expression level at each time point was calculated by normalizing its FPKM value by the highest value of FPKM among the four time points. Genes whose expression changes were >2-fold between any two time points during adipogenesis were clustered using the K-Mean clustering into four groups (I-IV) according to their dynamic relative expression levels. Genes whose expression changes were <2-fold were regarded as constitutively expressed genes and form the fifth group (V). For Group I-IV, top 1000 genes with the largest expression level changes were selected for gene ontology (GO) analysis using DAVID (28) and for Group V, top 1000 genes with the least expression variations were selected for GO analysis.
Temporal patterns of histone modifications
The temporal patterns of relative intensities of histone modifications were visualized using heat maps. The approach is described as follows. For each histone modification, we define a set of regions as the common ground for comparison of signal levels across time points. The signal level on each region is defined as the reads per million (RPM) on that region normalized by the highest RPM value among the four time points on that region. As such, the highest signal level across the 4 time points for each region is always one. Each region was assigned to the gene whose TSS is closest. The heat map intensity for each group of genes at each time point is calculated by averaging the signal levels of all the regions associated with genes in that group at that time point. For H3K4me1/2 and H3K27ac, the set of regions is defined by union of enhancers identified at the four time points; For H3K4me3, the regions are the promoters ([TSS−1K, TSS+1K]); For H3K36me3, The regions are the gene bodies ([TSS, TES]); For H3K27me3, the set of regions is defined by union of H3K27me3-enriched islands identified at the four time points.
MLL4 and CBP binding and association with enhancer epigenome and transcriptome in adipogenesis
MLL4/CBP binding sites on enhancers between two successive time points (D-3 to D0, D0 to D2 and D2 to D7) were classified into three types: decreased, unchanged and increased. The classification is done as follows. The union of MLL4/CBP binding sites on enhancers from two successive time points provides a set of common regions for comparison across time points. SICER were used to determine whether the changes in intensities were significant (with FDR < 1e-3) on these common regions. Regions whose changes were not significant were designated as unchanged. The distributions of decreased, unchanged and increased MLL4/CBP binding were shown in the pie charts. The fold changes of H3K4me1/H3K27ac intensities on the MLL4/CBP sites as classified above were shown in the box plots.
To characterize the temporal patterns of MLL4/CBP binding on enhancers during adipogenesis, we obtained the unions of all the MLL4/CBP binding sites on enhancers from four time points and calculated the intensity of MLL4/CBP on the resulting regions at each time point. We classified the temporal dynamics of MLL4/CBP binding on these regions into four patterns depending on which time point the highest intensities of MLL4/CBP were at: D-3, D0, D2 or D7. Next, the unions of MLL4/CBP binding sites were assigned to the nearest genes (TSSs). For each gene group, we determined the enrichment (or depletion) of each of the four MLL4/CBP binding patterns, with the significance determined using hypergeometric test. For Group I-IV, the unions of MLL4/CBP binding sites associated with the most enriched temporal pattern were used for the profiles of MLL4/CBP binding and their corresponding histone modifications from D-3 to D7 in the heat maps. For Group V, for each gene the MLL4/CBP sites with the same temporal pattern as the expression pattern were used for the heat maps.
MLL3/MLL4 facilitate CBP/p300 binding
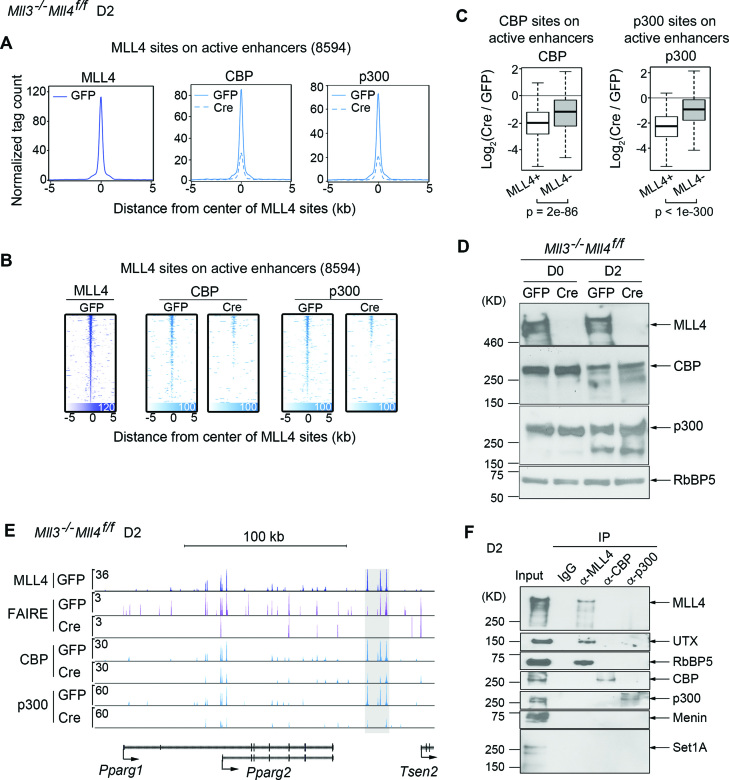
To compare CBP/p300 signal on MLL4 binding sites on active enhancers between Mll3/Mll4 double knockout (KO) cells and control cells, average profiles and heat maps were used to profile the CBP/p300 binding intensities within the 10 kb windows centered by MLL4 sites on active enhancers. We also compared CBP/p300 signal changes at MLL4+ and MLL4− CBP/p300 sites on active enhancers. Significance was determined using Mann–Whitney test.
Analysis of super-enhancers
We used rank ordering of super-enhancers (ROSE) with default parameters (29) to identify SEs. To identify SEs using MLL4/CBP, we stitched together H3K4me1+ MLL4 or CBP binding sites in non-promoter regions and used MLL4/CBP signal intensity for ranking. To identify SEs using TFs + MED1, we stitched together binding sites of master TFs (EBF2, C/EBPβ, C/EBPα and PPARγ) and used MED1 intensity for ranking. We associated SEs to the proximal expressed genes within ±200 kb.
We compared MLL4/CBP signal levels between SE constituents (SECs) and typical enhancers (TEs). RPKM of MLL4/CBP tags on SECs and TEs was used to measure the signal levels. Significance was determined using Mann–hitney test. To compare the MLL4-defined SEs at D0, D2 and D7, we used ROSE to determine MLL4-defined SEs for each time point separately. Then we compared MLL4 signal intensities on each set of SEs. Significance was determined using Mann–Whitney test. For comparison of CBP, MED1 and H3K27ac signals on SEs between Mll3/Mll4 double KO and control cells, RPM was calculated to measure the signal levels. Significance was determined using Wilcoxon test. For comparisons between MLL4-specific and common SE-associated genes, genes associated with both MLL4-specific and common SEs were excluded.
Genes associated with brown-specific SEs
SEs were determined by MLL4 ChIP-Seq for brown adipocytes (D7) and 3T3L1 adipocytes (D7), respectively. Brown-specific SEs were defined as brown SEs that did not overlap 3T3L1 SEs. Genes selectively expressed in brown adipocytes were defined as those (i) induced in brown adipogenesis, EdgeR was used to identify differentially expressed genes between D7 and D0 with FDR ≤ 0.05 and fold change ≥ 2; and (ii) with expression higher in brown adipocytes (D7) than in white adipocytes (D7) by at least 2-fold. Brown-specific SE-associated genes were defined as genes selectively expressed in brown adipocytes with brown-specific SEs within 200 kbs.
Datasets
In the Pparγf/f preadipocytes established in this study, we generated FAIRE-Seq, RNA-Seq and ChIP-Seq of TFs (EBF2, C/EBPβ, C/EBPα, PPARγ and CTCF), cofactors (CBP, MED1 and Pol II) and histone modifications (H3K4me1/2/3, H3K27ac, H3K36me3, H3K9me2 and H3K27me3) at four time points (D-3, D0, D2, D7) of adipogenesis. In the Mll3−/−Mll4f/f preadipocytes described previously (5), we generated ChIP-Seq for CBP and p300 for both Mll3/Mll4 double KO (Cre) and control (GFP) conditions at D2 of brown adipogenesis, as well as ChIP-Seq of MLL4 at D-3. In addition, we generated ChIP-Seq of MLL4 at D7 of adipogenesis in 3T3L1 cells. ChIP-Seq of MLL4 at D0, D2 and D7 were from published data (GEO: GSE50466) (5). We generated RNA-Seq data for BAT-derived from adult mouse. The ChIP-Seq of H3K4me1 and H3K27ac for BAT, and the RNA-Seq for WAT were downloaded from the mouse ENCODE project (30). RNA-Seq for 3T3L1 preadipocytes (D0 and D7) were downloaded from (12). The data used in this study are summarized in Supplementary Table S1.
Data reproducibility
For RNA-Seq data reproducibility, we generated biological replicates at all four time points (D-3, D0, D2 and D7) of adipogenesis using two different brown preadipocyte cell lines. We used Pearson correlations of expression values between each pair of biological replicates to assess reproducibility. For reproducibility of ChIP-Seq of CBP, we generated biological replicates at D0, D2 and D7 using different preadipocyte cell lines. To assess reproducibility, for each pair of replicates, we identified ChIP-enriched regions using SICER for each replicate. Then ChIP-enriched regions from the two replicates were merged and RPKM values for each replicate were calculated on the merged regions. We then calculated Pearson correlations of the RPKM values of the pair of replicates. For reproducibility of ChIP-Seq of TFs (C/EBPβ, C/EBPα and PPARγ), CTCF, MED1, Pol II and histone modifications (H3K4me1/2/3, H3K9me2, H3K27me3, H3K27ac), we calculated Pearson correlations between data generated in this study with those from different preadipocyte cell lines generated in our previously publications (5,31). As summarized in Supplementary Tables S2 and 3, the reproducibility of the RNA-Seq and ChIP-Seq data generated in this study is demonstrated by high Pearson correlations values.
RESULTS
Dynamic enhancer epigenome correlates with dynamic transcriptome in adipogenesis
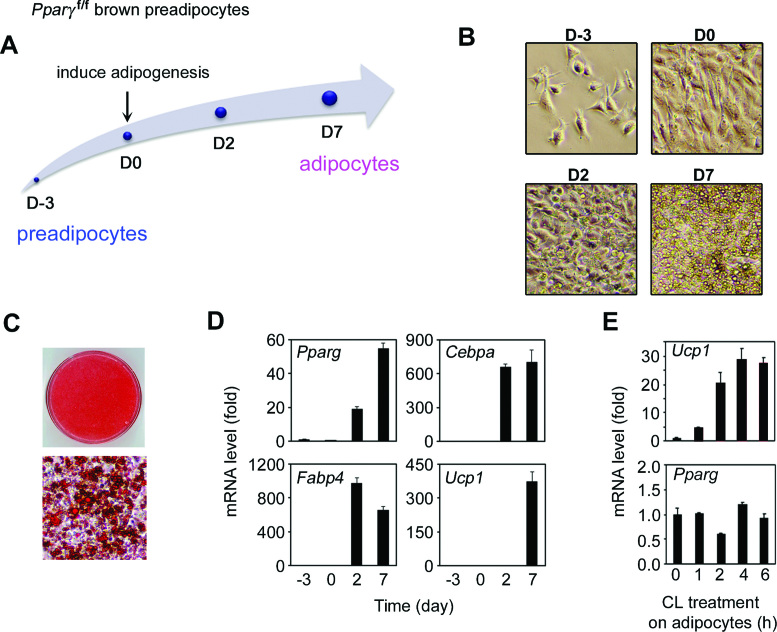
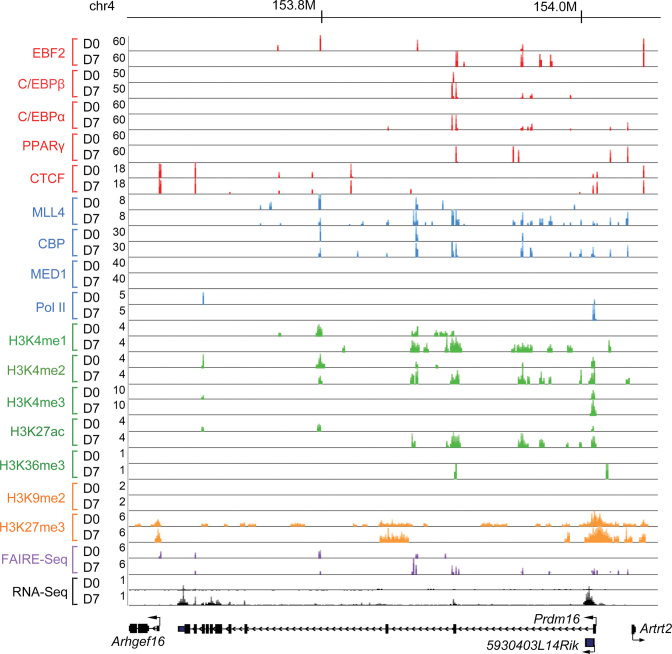
We investigated epigenomic regulation of adipogenesis using immortalized preadipocytes derived from BAT (Figure 1). We chose four time points that represent distinct stages of adipogenesis: proliferating preadipocytes (day −3, D-3), confluent preadipocytes before the induction of adipogenesis (day 0, D0), immature adipocytes undergoing adipogenesis (day 2, D2) and mature adipocytes after adipogenesis (day 7, D7) (Figure 1A and B). Oil Red O staining confirmed robust adipogenesis of the immortalized preadipocytes (Figure 1C). Expression of adipogenesis markers Pparg, Cebpa, Fabp4 and the BAT marker Ucp1 was markedly induced during adipogenesis (Figure 1D). Treating the differentiated adipocytes with β3-adrenergic receptor agonist CL-316,243 further induced Ucp1 expression by ∼30-fold (Figure 1E). Using ChIP-Seq, we identified genomic binding events of four adipogenic TFs (EBF2, C/EBPβ, C/EBPα, PPARγ), CTCF, cofactors (MLL4, CBP, MED1), Pol II and seven histone modifications (H3K4me1/2/3, H3K27ac, H3K36me3, H3K9me2, H3K27me3). Using RNA-Seq, we measured genome-wide gene expression levels. Using FAIRE-Seq, we identified open chromatin regions. These data are exemplified on gene loci encoding Prdm16 and Ucp1 (Figure 2 and Supplementary Figure S1).
Figure 1.
Characterization of immortalized brown preadipocytes derived from BAT. (A) Schematic of the adipogenesis assay. (B) Cell morphology under microscope. (C) Oil Red O staining of differentiated cells 7 days after inducing adipogenesis. (D) qRT-PCR analysis of gene expression at indicated time points of adipogenesis. (E) qRT-PCR analysis of Ucp1 and Pparg gene expression in fully differentiated adipocytes (D7, day 7) that were treated with 100 nM CL-316 243 for up to 6 h.
Figure 2.
Genome browser view of the Prdm16 locus before and after brown adipogenesis. ChIP-Seq, FAIRE-Seq and RNA-Seq data at the Prdm16 locus before (D0) and after (D7) adipogenesis of brown preadipocytes are shown. D0, day 0; D7, day 7.
Adipogenic TFs (EBF2, C/EBPβ, C/EBPα, PPARγ), cofactors (MLL4, CBP, MED1) and Pol II all show increased genomic binding on Prdm16 and Ucp1 loci after adipogenesis (D7), which are consistent with increased levels of active histone modifications (H3K4me1/2/3, H3K27ac, H3K36me3) from D0 to D7 (Figure 2 and Supplementary Figure S1). On the other hand, repressive histone modifications exhibit more divergent behaviors. G9a-mediated H3K9me2 decreases markedly during adipogenesis on the Ucp1 locus but is absent both before and after adipogenesis on the Prdm16 locus. Ezh2-mediated H3K27me3 decreases on the Ucp1 locus. The dynamic changes of the epigenome are also accompanied by increased chromatin opening and gene expression levels during adipogenesis (Figure 2 and Supplementary Figure S1).
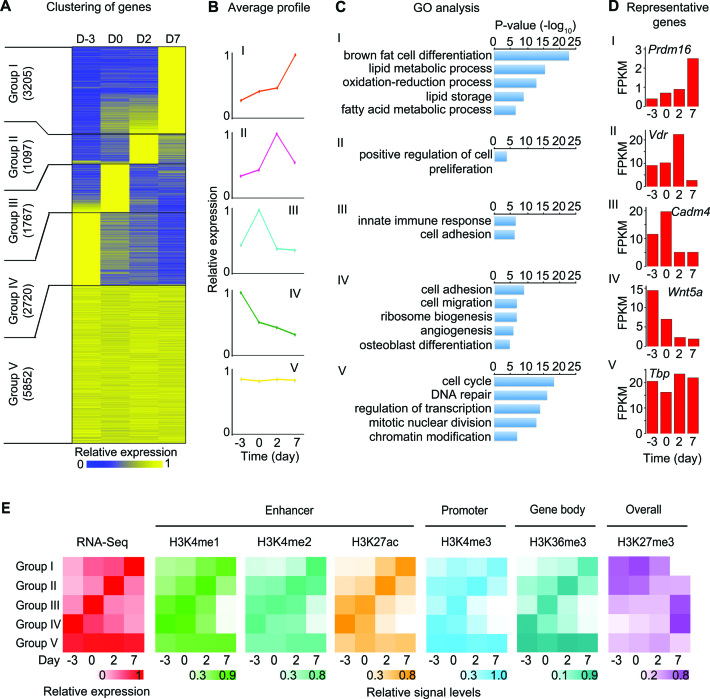
To investigate the relationship between epigenome and transcriptome during adipogenesis, we began by characterizing the dynamic transcriptome. By K-means clustering, we classified all active genes into five groups according to their relative expression levels. Each group represents a specific temporal profile of expression: increased throughout adipogenesis (group I), transiently increased at D2 (II), transiently increased at D0 (III), decreased throughout adipogenesis (IV) and constitutively expressed (V) (Figure 3A and B). These five groups are associated with functionally distinct GO terms (Figure 3C). Group I genes, such as Prdm16, are induced throughout adipogenesis and are strongly associated with brown fat cell differentiation. Suppressors of adipogenesis, such as Wnt5a, are often found in Group IV genes, whose expression levels decrease throughout adipogenesis. Representative genes for each group are shown in Figure 3D. Using ChIP-Seq data for histone modifications, we scored each gene for H3K4me1/2 and H3K27ac levels on enhancers, H3K4me3 levels on promoters, H3K36me3 levels on gene bodies and overall H3K27me3 levels at each time point. By comparing temporal patterns of histone modifications and transcriptome for each gene group (Figure 3E), we observed that the dynamic enhancer epigenome marked by H3K4me1/2 and H3K27ac correlates well with the dynamic transcriptome during adipogenesis.
Figure 3.
Dynamic enhancer epigenome correlates with the dynamic transcriptome during adipogenesis. (A–D) Characterization of the dynamic transcriptome. Genes are clustered according to their dynamic expression pattern during adipogenesis. (A) Heat map of clustered gene expression during adipogenesis. The number of genes in each group is indicated. (B) Temporal profile of average relative expression levels for each group of genes. (C) Gene ontology (GO) analysis of each group of genes. (D) Expression levels of a representative gene for each gene group during adipogenesis. (E) Dynamic epigenome correlates well with the dynamic transcriptome during adipogenesis. Shown are heat maps of average gene expression levels determined by RNA-Seq, H3K4me1/2 and H3K27ac levels on enhancers, H3K4me3 levels on promoters, H3K36me3 levels over gene bodies and overall (gene body, promoter and distal region) H3K27me3 levels for the five groups of genes during adipogenesis.
MLL4 and CBP drive the dynamic enhancer epigenome in adipogenesis
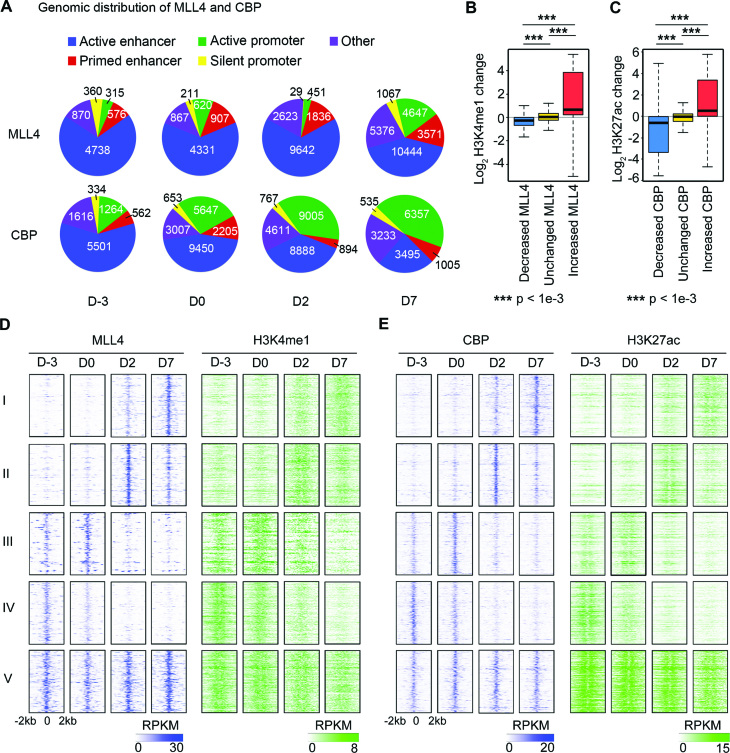
To understand the mechanisms that regulate the dynamic enhancer epigenome in adipogenesis, we characterized the dynamics of genome-wide binding of the H3K4me1/2 methyltransferase MLL4 and the H3K27 acetyltransferase CBP. Majority of MLL4 binding regions are located on primed or active enhancers at all four time points, whereas CBP binds to both active enhancers and active promoters (Figure 4A). MLL4 and CBP binding on enhancers are highly dynamic, with over 67% of MLL4 and over 50% of CBP sites showing significantly altered binding intensities between any two adjacent time points during adipogenesis. The most dramatic changes occur from D0 to D2, with only 7.4% of MLL4 and 20.4% of CBP binding on enhancers remaining unchanged or showing mild changes (Supplementary Figure S2A). As expected, in general, increases in MLL4 and CBP binding on enhancers correlate with increased H3K4me1 and H3K27ac levels, respectively. Interestingly, whereas the enhancers with decreased CBP binding show a marked decrease in H3K27ac levels, the enhancers with decreased MLL4 binding only show a mild decrease in H3K4me1 levels (Figure 4B and C).
Figure 4.
MLL4 and CBP drive the dynamic enhancer epigenome in adipogenesis. Only MLL4 and CBP binding sites within enhancers are included. (A) Genomic distribution of MLL4 and CBP binding in adipogenesis. (B and C) Relationship between changes in MLL4 (B) or CBP (C) binding intensity and their respective histone modification levels. MLL4 and CBP sites were classified into three groups according to their changes in binding intensity between neighboring time points: decreased, unchanged and increased (see Supplementary Figure S2A for details). (D and E) MLL4 and CBP drive the dynamics of their respective histone modifications on enhancers. Only MLL4/CBP binding sites corresponding to the most enriched temporal pattern for each group were included when generating the heat maps. The enrichment of temporal MLL4/CBP binding patterns is shown in Supplementary Figure S2B. (D) Heat maps of MLL4 and H3K4me1 on enhancer MLL4 binding sites. (E) Heat maps of CBP and H3K27ac on enhancer CBP binding sites.
Next, we compared the temporal patterns of MLL4/CBP binding with those of H3K4me1/H3K27ac on enhancers. For each of the five gene groups, we classified enhancer binding patterns of MLL4/CBP into four types according to the time point of the highest binding intensities: D-3, D0, D2 or D7 (Supplementary Figure S2B). We found that the most enriched MLL4/CBP binding patterns are congruent with their corresponding gene expression patterns shown in Figure 3B while the most depleted patterns anti-correlate. As shown in heat maps, the most enriched MLL4/CBP binding patterns correlate well with H3K4me1/H3K27ac levels on enhancers (Figure 4D and E). The correlation between MLL4/CBP binding and H3K4me1/H3K27ac levels is also shown on two representative gene loci, Cebpa of group I and Wnt10b of group IV (Supplementary Figure S3). Together with our previous observations that MLL3/MLL4 are required for H3K4me1/2 and H3K27ac on active enhancers during adipogenesis (5), these results suggest that MLL3/MLL4 and CBP/p300 drive the dynamic enhancer epigenome during adipogenesis.
MLL3/MLL4 are required for CBP/p300 binding on enhancers activated in adipogenesis
Next, we investigated the relationship between MLL3/MLL4 and CBP/p300 binding on enhancers. H3K4me1/2 precedes H3K27ac on active enhancers during cell differentiation and animal development (3,5,32,33). During cell differentiation, MLL3/MLL4 are required for not only H3K4me1/2 but also H3K27ac on active enhancers (5). These observations suggest that MLL3/MLL4 could be required for binding and/or enzymatic activities of CBP/p300 on enhancers activated during adipogenesis. Indeed, deletion of Mll4 from Mll3 KO (Mll3−/−Mll4f/f) preadipocytes largely prevented CBP/p300 binding on MLL4+ active enhancers at D2 of adipogenesis (Figure 5A and B). Further, more severe impairments of CBP/p300 binding were observed at MLL4+ than at MLL4− CBP/p300 binding sites on active enhancers (Figure 5C). Notably, Double KO of Mll3/Mll4 did not change CBP/p300 protein levels in cells (Figure 5D). On the Pparg locus, we also observed markedly decreased CBP/p300 binding on MLL4+ active enhancers at D2 of adipogenesis in the absence of MLL3/MLL4 (Figure 5E). Immunoprecipitation using anti-MLL4, anti-CBP or anti-p300 antibody followed by western blot analysis failed to detect a physical interaction between MLL4 and CBP/p300 at D2 of adipogenesis (Figure 5F). Together, these data indicate that enhancer-priming by MLL3/MLL4 facilitates CBP/p300 binding on, and activation of, enhancers during adipogenesis.
Figure 5.
MLL3/MLL4 are required for CBP/p300 binding on enhancers activated in adipogenesis. Mll3−/−Mll4f/f brown preadipocytes were infected with adenoviral GFP or Cre as described (5). Cells were collected at D2 of adipogenesis for ChIP-Seq of CBP and p300. Cells were collected at D0 and D2 of adipogenesis for western blot analysis of MLL4, CBP and p300. (A–C) MLL3/MLL4 facilitate CBP/p300 binding on active enhancers at D2. (A) Aggregated profiles. (B) Heat maps. (C) Deletion of Mll4 causes more severe impairment of CBP/p300 binding at MLL4+ than at MLL4− CBP/p300 sites on active enhancers. (D) Western blot analysis of MLL4, CBP and p300 at D0 and D2. RbBP5 serves as the loading control. (E) Genome browser view of enhancers (highlighted in gray) around the Pparg locus, where the deletion of Mll3/Mll4 resulted in decreases of CBP and p300 binding at D2. (F) MLL4 physically interacts with UTX and RbBP5 but not CBP/p300 during adipogenesis. Nuclear extracts of cells collected at D2 of adipogenesis were incubated with MLL4, CBP or p300 antibody. Immunoprecipitates were analyzed by western blot using antibodies indicated on the right.
MLL4 identifies and is required for super-enhancer formation in adipogenesis
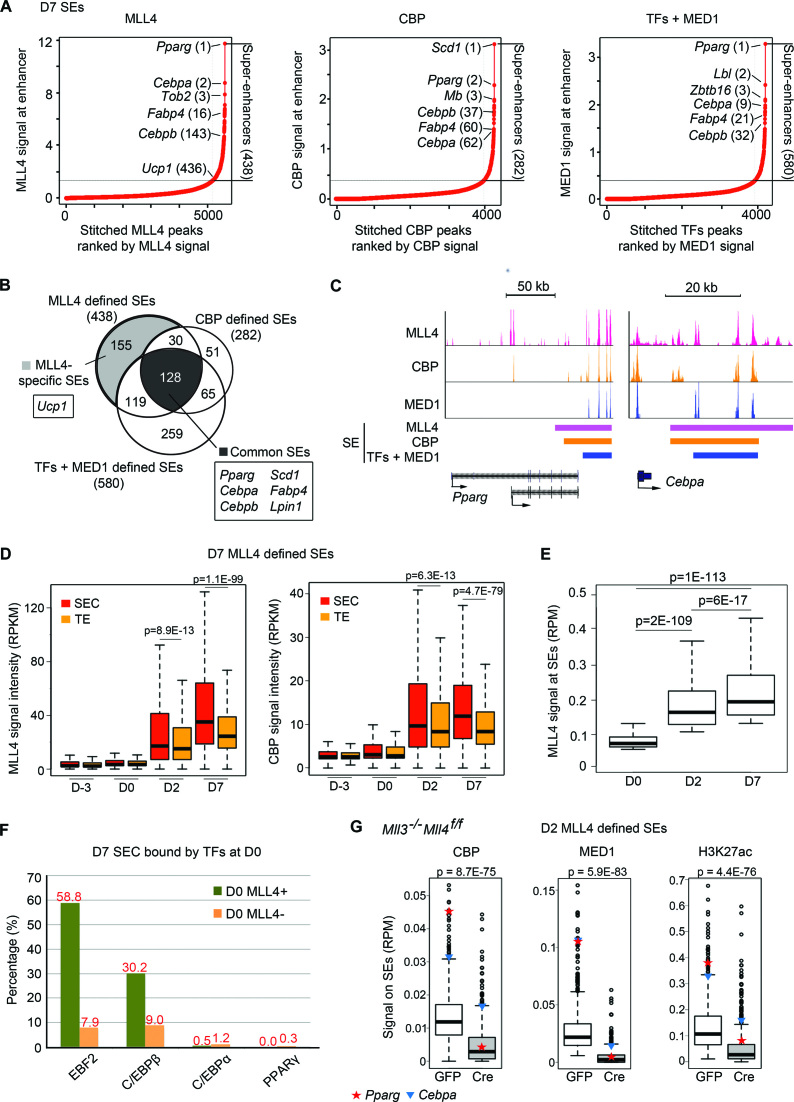
Next, we asked whether MLL4 and CBP could identify SEs, which are clusters of active enhancers and are associated with cell identity genes (29). Canonically, SEs are identified by large-scale clustering of master TF binding sites and ranked by MED1 signal strength (29). We used MLL4/CBP binding sites and their corresponding binding intensities to identify and rank SEs. As a comparison, we also identified SEs using TFs + MED1 (i.e. using EBF2, C/EBPβ, C/EBPα and PPARγ binding sites to cluster and MED1 levels to rank). We identified 438, 282 and 580 SEs in D7 adipocytes using MLL4, CBP and TFs + MED1, respectively (Figure 6A and B). All three methods identified Pparg, Cebpa and Fabp4 as SE-associated genes but only MLL4 was able to identify the brown marker gene Ucp1 in D7 adipocytes. SEs identified by three methods on Pparg and Cebpa loci are shown in Figure 6C. GO analysis of genes associated with SEs revealed similar results from three methods and identified brown fat cell differentiation and fat cell differentiation as significant GO terms (Supplementary Figure S4). Thus, MLL4 and CBP can identify SEs in adipocytes.
Figure 6.
MLL4 identifies and is required for super-enhancer (SE) formation in adipogenesis. (A–C) MLL4 and CBP identify SEs in D7 brown adipocytes. (A) D7 SEs identified using MLL4, CBP or TFs + MED1 (29). (B) Venn diagram showing the overlaps between three groups of SEs identified in (A). Representative genes associated with MLL4-specific and common SEs are indicated. (C) SEs on Pparg and Cebpa loci. SE regions identified by each approach are indicated by color bars. (D) MLL4 and CBP are preferentially enriched on SE constituents (SECs). MLL4 and CBP signal levels are shown for SECs and typical enhancers (TEs) from D-3 to D7. SEs were identified using MLL4 in D7 brown adipocytes. See Supplementary Figure S5 for results on SEs identified using CBP or TFs + MED1. (E) MLL4 signal intensities on SEs increase from D0 to D7. SEs are defined by MLL4 at each time point. (F) D7 SECs pre-marked by MLL4 at D0 are enriched with the binding of EBF2 and C/EBPβ but not C/EBPα and PPARγ. (G) Deletion of Mll4 from Mll3 KO preadipocytes severely decreases CBP, MED1 and H3K27ac levels at SEs identified by MLL4 in D2 cells. D2 SEs were identified by MLL4 as shown in Supplementary Figure S7. The signal levels on SEs of Pparg (red star) and Cebpa (blue triangle) are indicated.
Further analysis revealed higher levels of MLL4 and CBP at individual SECs than at TEs (Figure 6D and Supplementary Figure S5). D7 SECs and TEs both have very low levels of MLL4 and CBP before adipogenesis (D-3 and D0), indicating that SECs gain more MLL4 and CBP than TEs do during differentiation. Comparison of MLL4 signal intensities at MLL4-defined D0, D2 and D7 SEs revealed that MLL4 signal intensities increase from D0 to D7 (Figure 6E). Interestingly, 374 D7 SECs, which belong to 49% of SEs (215/438), are marked by MLL4 at D0 (Supplementary Figure S6A). These SECs show open chromatin features at D0, with high levels of H3K4me1, H3K27ac and FAIRE signals (Supplementary Figure S6B). For example, SEs on Pparg, Cebpa and Ucp1 loci are bound by MLL4 at their constituents at D0 (Supplementary Figure S6C). Furthermore, ∼60 and 30% of MLL4-bound SECs at D0 are bound by EBF2 and C/EBPβ, respectively (Figure 6F). These results indicate that MLL4, EBF2 and C/EBPβ pre-mark a subset of SECs prior to adipogenesis.
We then asked whether MLL3/MLL4 are required for the formation of SEs. Deletion of Mll4 from Mll3 KO preadipocytes severely decreased CBP, MED1 and H3K27ac levels at D2 SEs identified by MLL4, including the ones on Pparg and Cebpa loci (Figure 6G and Supplementary Figure S7). Together, these results demonstrate that MLL4 and CBP are able to identify SEs and that MLL3/MLL4 are required for the formation of SEs in adipogenesis.
MLL4 identifies primed super-enhancers of BAT-selective genes Ucp1, Cidea and Gpd2 in brown adipocytes differentiated in culture
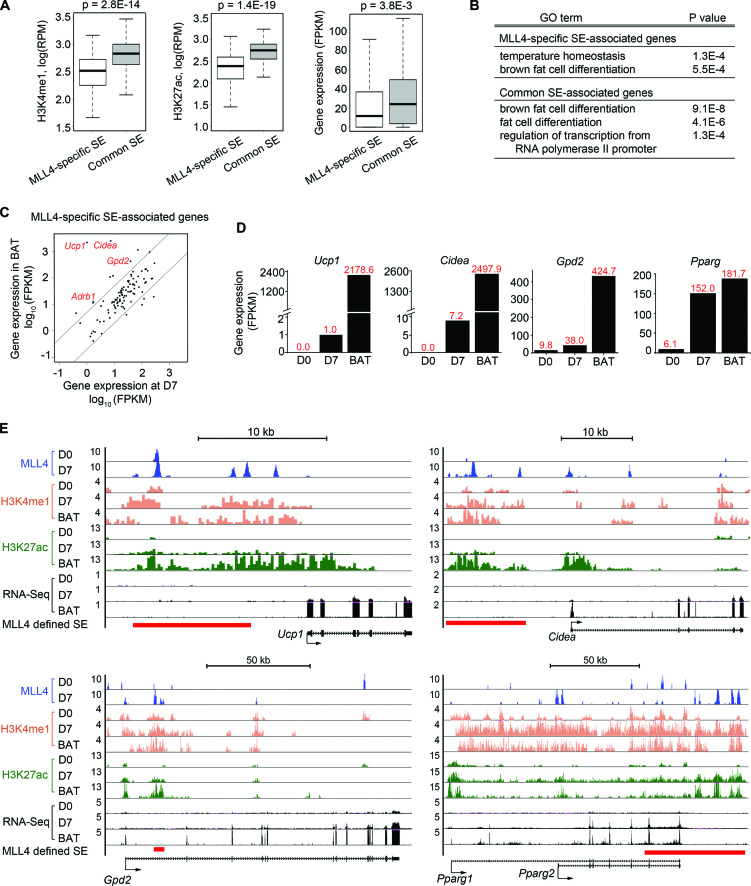
In addition to common SEs identified by all three methods, 155 SEs were identified by MLL4 only (Figure 6B). These MLL4-specific SEs show lower levels of H3K4me1, H3K27ac and associated gene expression than common SEs do (Figure 7A). GO analysis indicated that while both MLL4-specific and common SE-associated genes are linked to brown fat cell differentiation, only MLL4-specific SE-associated genes are linked to temperature homeostasis, a major function of BAT (Figure 7B). RNA-Seq analyses revealed 10 genes that are expressed at much higher levels (>5-fold) in BAT than in D7 brown adipocytes (Figure 7C and Supplementary Figure S8A). They include BAT-selective genes Ucp1, Cidea and Gpd2 as well as Adrb1 (beta 1 adrenergic receptor) (19), all of which are critical for the thermogenesis function of BAT. While Ucp1, Cidea and Gpd2 are markedly induced from preadipocytes (D0) to adipocytes (D7), their absolute levels in D7 brown adipocytes are much lower than in BAT. In contrast, the general adipogenesis gene Pparg is expressed at similar levels (Figure 7D). These results suggest that SEs of these BAT-selective genes are primed but not fully activated in D7 brown adipocytes differentiated in culture. Indeed, by comparing ChIP-Seq data from D7 brown adipocytes with those from BAT (34), we found that H3K27ac levels at MLL4-identified SEs on Ucp1, Cidea and Gpd2 loci were much lower in D7 brown adipocytes than in BAT, whereas H3K4me1 levels were comparable. In contrast, both H3K4me1 and H3K27ac levels at MLL4-identified SEs on the Pparg locus were comparable in D7 brown adipocytes and in BAT (Supplementary Figure S8B and C; Figure 7E). Thus, MLL4 identifies primed SEs of several BAT-selective genes in brown adipocytes differentiated in culture.
Figure 7.
MLL4 identifies primed SEs of BAT-selective genes Ucp1, Cidea and Gpd2 in brown adipocytes differentiated in culture. (A) MLL4-specific SEs show lower levels of H3K4me1, H3K27ac and expression levels of SE-associated genes than common SEs do. Significance was determined using Mann–Whitney test. (B) GO analysis of MLL4-specific and common SE-associated genes. (C) Comparison of MLL4-specific SE-associated gene expression in D7 brown adipocytes and in BAT. Data were obtained by RNA-Seq. (D) Expression levels of BAT-selective genes (Ucp1, Cidea and Gpd2) and Pparg in preadipocytes (D0) and adipocytes (D7) during brown adipogenesis and in BAT. (E) Genome browser views of MLL4 binding, H3K4me1 and H3K27ac levels, and RNA-Seq at Ucp1, Cidea, Gpd2 and Pparg loci. Red bars underneath the genome browser tracks indicate MLL4-defined SE regions.
Comparative epigenomic analysis of brown and white adipogenesis
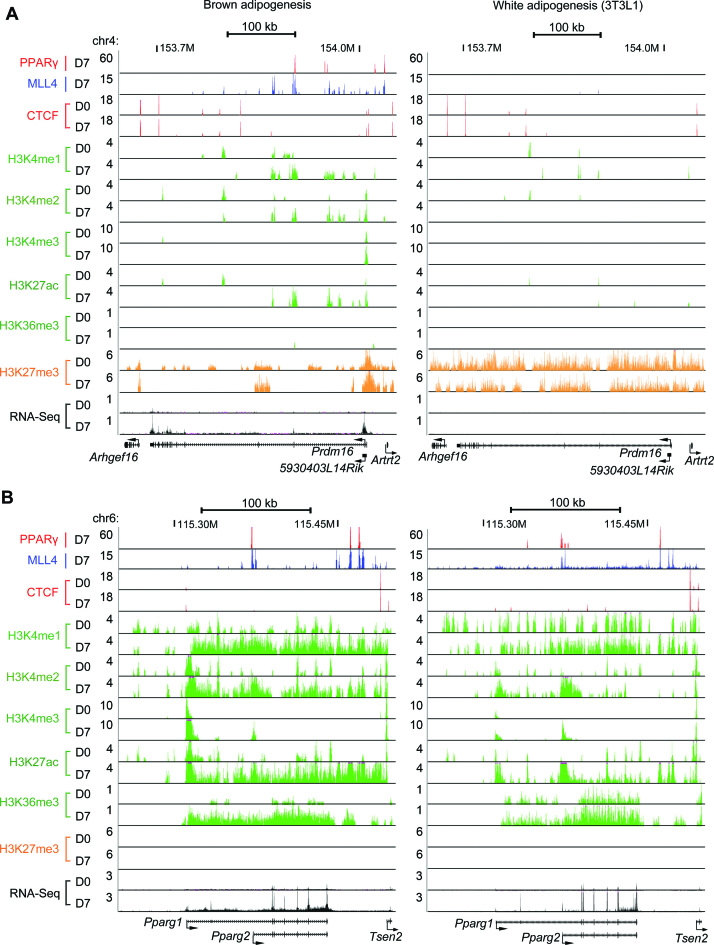
Next we compared our datasets with published ChIP-Seq (35) and RNA-Seq (12) datasets on 3T3-L1 white adipogenesis. For this purpose, we also generated MLL4 ChIP-Seq dataset at D7 of 3T3L1 adipogenesis. As shown in Figure 8 and Supplementary Figure S9, PPARγ and MLL4 bind Ucp1 and Prdm16 loci at D7 of brown but not white adipogenesis. In contrast, they bind the Pparg locus in both brown and white adipocytes. Signal levels of active histone marks H3K4me1/2/3, H3K27ac and H3K36me3 on the Prdm16 locus increase in brown but not white adipogenesis. In contrast, their levels on the Pparg locus increase in both brown and white adipogenesis (Figure 8). Levels of the repressive histone modification H3K27me3 on Ucp1 and Prdm16 loci are generally lower at both D0 and D7 in brown than in white adipogenesis. Consistent with the ChIP-Seq results, RNA-Seq data showed that Ucp1 and Prdm16 are only induced in brown adipogenesis while Pparg is induced in both brown and white adipogenesis.
Figure 8.
Comparative epigenomic profiling of brown and white adipogenesis on Prdm16 and Pparg loci. ChIP-Seq and RNA-Seq data on Prdm16(A) and Pparg(B) loci before (D0) and after (D7) adipogenesis of brown preadipocytes (left) and 3T3L1 white preadipocytes (right) are shown.
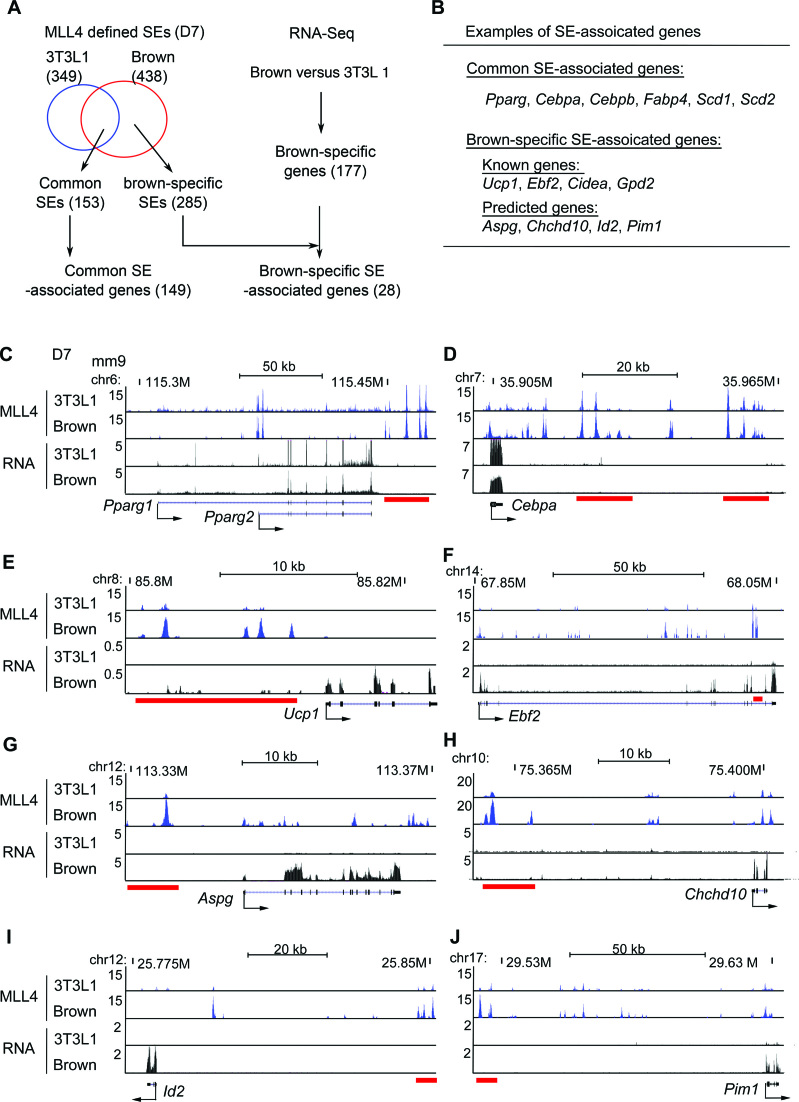
Further, we compared MLL4-defined SEs at D7 of brown and white adipogenesis. Combined with RNA-Seq data from both brown and white adipogenesis, we identified 153 common and 285 brown-specific SEs (Figure 9A). The 153 common SEs associated with 149 genes including general adipogenic genes such as Pparg, Cebpa, Cebpb and Fabp4 (Figure 9B and D). Meanwhile, we identified 177 genes with higher expression in brown than in white adipocytes at D7. Among them, 28 were brown-specific SE-associated genes (Figure 9A and B; Supplementary Table S4). In addition to known brown-enriched genes such as Ucp1, Ebf2, Cidea and Gpd2 (19,20) (Figure 9B–F), these brown-specific SE-associated genes also included genes such as Aspg, Chchd10, Id2 and Pim1 (Figure 9B, G–J), whose functions in BAT development and/or function need to be validated in the future.
Figure 9.
Identification of brown-specific SE-associated genes. (A) Flowchart of identifying common and brown-specific SE-associated genes. (B) Examples of common and brown-specific SE-associated genes. See Supplementary Table S4 for the full list. (C–J) Genome browser views of MLL4 ChIP-Seq and RNA-Seq data at D7 of adipogenesis of 3T3L1 and brown preadipocytes on selected SE-associated genes. Red bars underneath the genome browser tracks indicate MLL4-defined SE regions in brown adipocytes. (C–D) Common SE-associated genes Pparg and Cebpa are shown. (E–J) Brown-specific SE-associated genes Ucp1, Ebf2, Aspg, Chchd10, Id2 and Pim1 are shown.
DISCUSSION
Following established protocols, we immortalized primary preadipocytes isolated from mouse BAT. By epigenomic profiling of preadipocyte differentiation at four time points, we show that enhancer epigenomic writers MLL3/MLL4 and CBP/p300 drive the enhancer epigenome. Importantly, MLL3/MLL4 are required for CBP/p300 binding on enhancers activated during adipogenesis, thus revealing novel insights into the mechanism by which MLL3/MLL4 regulate enhancer activation during cell differentiation. We also report that MLL4 and CBP can identify SEs of adipogenesis and that MLL3/MLL4 are required for the formation of SEs. Further, in brown adipocytes differentiated in culture, MLL4 identifies primed SEs of Ucp1 and other BAT-selective genes. Our data also serve as a rich resource for understanding epigenomic regulation of brown adipogenesis.
Enhancer regulation by MLL3/MLL4 and CBP/p300
MLL3/MLL4 and CBP/p300 are major epigenomic writers for enhancer marks H3K4me1/2 and H3K27ac, respectively. As expected, changes of CBP binding on enhancers positively correlates with changes of H3K27ac levels. Interestingly, while increases in MLL4 binding on enhancers lead to increased H3K4me1, decreased MLL4 binding only leads to a mild decrease in H3K4me1 levels (Figure 4B). This unexpected result could be due to the compensation for the loss of MLL4 on enhancers by other H3K4 methyltransferases and/or the failure of H3K4 demethylases to remove H3K4me1 on enhancers. MLL3/MLL4-mediated H3K4me1 on enhancers may serve the memory function to keep the primed enhancers open and accessible and facilitate rapid activation/re-activation by subsequent stimuli (1). Another interesting finding is that the fractions of MLL4/CBP on promoter regions increase during adipogenesis (Figure 4A), which could be due to the increased enhancer-promoter interactions that bring enhancer-bound MLL4/CBP to promoter regions.
We showed previously that MLL3/MLL4 are required for H3K27ac on enhancers activated during adipogenesis (5), but the mechanism was unclear. Here we show that MLL3/MLL4 regulate enhancer activation by facilitating enhancer-binding of H3K27 acetyltransferases CBP/p300. It remains to be determined how MLL3/MLL4 facilitate CBP/p300 binding on enhancers. MLL4 complex does not physically interact with CBP/p300 during adipogenesis (Figure 5F). One possibility is that MLL3/MLL4 facilitate the chromatin opening on enhancers, which in turn facilitates CBP/p300 binding.
MLL4 and CBP identify SEs
SEs are enriched with exceptionally high levels of transcription coactivators including Mediator (represented by the MED1 subunit), and are linked to key cell identity genes (29). SEs can be identified by using TFs + MED1, H3K27ac or BRD4, all of which are enriched at enhancers (29,36,37). As expected, the H3K27 acetyltransferase p300 can also identify SEs (38). In this study, we show that both CBP, which is the ortholog of p300 and MLL4, which is enriched on active and primed enhancers during adipogenesis, can identify SEs. Interestingly, MLL4 identifies primed SEs of genes critical for the thermogenesis function of BAT, such as Ucp1 and Adrb1, in brown adipocytes differentiated in culture. These primed SEs show similar levels of H3K4me1 but much lower levels of H3K27ac and expression of SE-associated genes in brown adipocytes than in the BAT. The primed state of these SEs in brown adipocytes differentiated in culture suggests that additional signaling pathways and their down-stream TFs are critical for the full activation of these SEs in BAT in vivo. Future work on epigenomic profiling of brown adipocytes in vivo would help identify signaling pathways and down-stream TFs critical for BAT functions.
Epigenomic profiling of brown adipogenesis
A previous study reported the epigenomic profiling of white adipogenesis using immortalized murine 3T3-L1 cells and primary human adipose stromal cells (35). We report the epigenomic profiling of adipogenesis using immortalized murine brown preadipocytes. In addition to ChIP-Seq of H3K4me1/2/3, H3K27me3, H3K36me3, H3K27ac, PPARγ and CTCF, which were reported in (35), we performed ChIP-Seq of H3K9me2, adipogenic TFs EBF2, C/EBPβ and C/EBPα, enhancer epigenomic writers MLL4 and CBP, MED1, Pol II, FAIRE-Seq of chromatin opening and RNA-Seq of transcriptome. Our study provides a more comprehensive resource for understanding epigenomic regulation of adipogenesis. We show that enhancer epigenomic writers, H3K4me1/2 methyltransferases MLL3/MLL4 and H3K27 acetyltransferases CBP/p300, drive the dynamic enhancer epigenome during adipogenesis. Further, we confirm the finding by Mikkelsen et al. that dynamic changes in enhancer H3K27ac correlate with changes in gene expression levels. We show that dynamic enhancer H3K4me1/2 also correlate with dynamic transcriptome, thus establishing the strong correlation between dynamic enhancer epigenome and dynamic transcriptome during adipogenesis.
By comparing MLL4-defined SEs and transcriptome in brown and white adipogenesis, we obtained a list of brown-specific SE-associated genes. These genes include known and predicted genes that regulate BAT development or function. Interestingly, two very recent papers independently validated the potential roles of Id2 and Pim1 in BAT development/function. One showed that Pim1 promotes brown adipogenesis of C3H10T1/2 cells (39). The other showed that deletion of Id2 leads to impaired thermogenesis and a reduction in core body temperature in mice (40), suggesting that Id2 is involved in BAT function.
ACCESSION NUMBER
All datasets described in the paper have been deposited in NCBI Gene Expression Omnibus under access # GSE74189.
Supplementary Material
ACKNOWLEDGEMENTS
We thank NIDDK Genomics Core for sequencing, Ye Rin Koh for proof-reading the manuscript.
Footnotes
Present address: Lifeng Wang, CardioMetabolic Disease Research, Boehringer Ingelheim Pharmaceuticals, Inc., Ridgefield, CT 06877, USA.
SUPPLEMENTARY DATA
Supplementary Data are available at NAR Online.
FUNDING
Intramural Research Program of the National Institute of Diabetes and Digestive and Kidney Disease, National Institute of Health (to K.G.); National Institute of Allergy and Infectious Diseases, National Institute of Health [R21AI113806 and R01AI121080 to W.P.]. Funding for open access charge: Intramural Research Program of the National Institute of Diabetes and Digestive and Kidney Disease, National Institute of Health (to K.G.); National Institute of Allergy and Infectious Diseases, National Institute of Health [R21AI113806 and R01AI121080 to W.P.].
Conflict of interest statement. None declared.
REFERENCES
- 1. Heinz S., Romanoski C.E., Benner C., Glass C.K.. The selection and function of cell type-specific enhancers. Na.t Rev. Mol. Cell Biol. 2015; 16:144–154. [DOI] [PMC free article] [PubMed] [Google Scholar]
- 2. Heintzman N.D., Stuart R.K., Hon G., Fu Y., Ching C.W., Hawkins R.D., Barrera L.O., Van Calcar S., Qu C., Ching K.A. et al. Distinct and predictive chromatin signatures of transcriptional promoters and enhancers in the human genome. Nat. Genet. 2007; 39:311–318. [DOI] [PubMed] [Google Scholar]
- 3. Calo E., Wysocka J.. Modification of enhancer chromatin: what, how, and why?. Mol. Cell. 2013; 49:825–837. [DOI] [PMC free article] [PubMed] [Google Scholar]
- 4. Creyghton M.P., Cheng A.W., Welstead G.G., Kooistra T., Carey B.W., Steine E.J., Hanna J., Lodato M.A., Frampton G.M., Sharp P.A. et al. Histone H3K27ac separates active from poised enhancers and predicts developmental state. Proc. Natl. Acad. Sci. U.S.A. 2010; 107:21931–21936. [DOI] [PMC free article] [PubMed] [Google Scholar]
- 5. Lee J.E., Wang C., Xu S., Cho Y.W., Wang L., Feng X., Baldridge A., Sartorelli V., Zhuang L., Peng W. et al. H3K4 mono- and di-methyltransferase MLL4 is required for enhancer activation during cell differentiation. Elife. 2013; 2:e01503. [DOI] [PMC free article] [PubMed] [Google Scholar]
- 6. Wang C., Lee J.E., Lai B., Macfarlan T.S., Xu S., Zhuang L., Liu C., Peng W., Ge K.. Enhancer priming by H3K4 methyltransferase MLL4 controls cell fate transition. Proc. Natl. Acad. Sci. U.S.A. 2016; 113:11871–11876. [DOI] [PMC free article] [PubMed] [Google Scholar]
- 7. Jin Q., Yu L.-R., Wang L., Zhang Z., Kasper L.H., Lee J.-E., Wang C., Brindle P.K., Dent S.Y., Ge K.. Distinct roles of GCN5/PCAF-mediated H3K9ac and CBP/p300-mediated H3K18/27ac in nuclear receptor transactivation. EMBO J. 2011; 30:249–262. [DOI] [PMC free article] [PubMed] [Google Scholar]
- 8. Visel A., Blow M.J., Li Z., Zhang T., Akiyama J.A., Holt A., Plajzer-Frick I., Shoukry M., Wright C., Chen F. et al. ChIP-seq accurately predicts tissue-specific activity of enhancers. Nature. 2009; 457:854–858. [DOI] [PMC free article] [PubMed] [Google Scholar]
- 9. Farmer S.R. Transcriptional control of adipocyte formation. Cell Metab. 2006; 4:263–273. [DOI] [PMC free article] [PubMed] [Google Scholar]
- 10. Rosen E.D., MacDougald O.A.. Adipocyte differentiation from the inside out. Nat. Rev. Mol. Cell Biol. 2006; 7:885–896. [DOI] [PubMed] [Google Scholar]
- 11. Siersbaek R., Nielsen R., John S., Sung M.H., Baek S., Loft A., Hager G.L., Mandrup S.. Extensive chromatin remodelling and establishment of transcription factor ‘hotspots’ during early adipogenesis. EMBO J. 2011; 30:1459–1472. [DOI] [PMC free article] [PubMed] [Google Scholar]
- 12. Park Y.K., Wang L., Giampietro A., Lai B., Lee J.E., Ge K.. Distinct roles of transcription factors KLF4, Krox20, and peroxisome proliferator-activated receptor γ in adipogenesis. Mol. Cell. Biol. 2017; 37, doi:10.1128/MCB.00554-16. [DOI] [PMC free article] [PubMed] [Google Scholar]
- 13. Lefterova M.I., Haakonsson A.K., Lazar M.A., Mandrup S.. PPARgamma and the global map of adipogenesis and beyond. Trends Endocrinol. Metab. 2014; 25:293–302. [DOI] [PMC free article] [PubMed] [Google Scholar]
- 14. Ge K. Epigenetic regulation of adipogenesis by histone methylation. Biochim. Biophys. Acta. 2012; 1819:727–732. [DOI] [PMC free article] [PubMed] [Google Scholar]
- 15. Lee J.E., Ge K.. Transcriptional and epigenetic regulation of PPARgamma expression during adipogenesis. Cell Biosci. 2014; 4, doi:10.1186/2045-3701-4-29. [DOI] [PMC free article] [PubMed] [Google Scholar]
- 16. Takahashi N., Kawada T., Yamamoto T., Goto T., Taimatsu A., Aoki N., Kawasaki H., Taira K., Yokoyama K.K., Kamei Y. et al. Overexpression and ribozyme-mediated targeting of transcriptional coactivators CREB-binding protein and p300 revealed their indispensable roles in adipocyte differentiation through the regulation of peroxisome proliferator-activated receptor gamma. J. Biol. Chem. 2002; 277:16906–16912. [DOI] [PubMed] [Google Scholar]
- 17. Cannon B., Nedergaard J.. Brown adipose tissue: function and physiological significance. Physiol. Rev. 2004; 84:277–359. [DOI] [PubMed] [Google Scholar]
- 18. Rosen E.D., Spiegelman B.M.. What we talk about when we talk about fat. Cell. 2014; 156:20–44. [DOI] [PMC free article] [PubMed] [Google Scholar]
- 19. Seale P., Kajimura S., Yang W., Chin S., Rohas L.M., Uldry M., Tavernier G., Langin D., Spiegelman B.M.. Transcriptional control of brown fat determination by PRDM16. Cell Metab. 2007; 6:38–51. [DOI] [PMC free article] [PubMed] [Google Scholar]
- 20. Rajakumari S., Wu J., Ishibashi J., Lim H.W., Giang A.H., Won K.J., Reed R.R., Seale P.. EBF2 determines and maintains brown adipocyte identity. Cell Metab. 2013; 17:562–574. [DOI] [PMC free article] [PubMed] [Google Scholar]
- 21. Hong S., Cho Y.W., Yu L.-R., Yu H., Veenstra T.D., Ge K.. Identification of JmjC domain-containing UTX and JMJD2 as histone H3 lysine 27 demethylases. Proc. Natl. Acad. Sci. U.S.A. 2007; 104:18439–18444. [DOI] [PMC free article] [PubMed] [Google Scholar]
- 22. Jang Y., Wang C., Zhuang L., Liu C., Ge K.. H3K4 methyltransferase activity is required for MLL4 protein stability. J. Mol. Biol. 2016; doi:10.1016/j.jmb.2016.12.016. [DOI] [PMC free article] [PubMed] [Google Scholar]
- 23. Wang L., Jin Q., Lee J.E., Su I.H., Ge K.. Histone H3K27 methyltransferase Ezh2 represses Wnt genes to facilitate adipogenesis. Proc. Natl. Acad. Sci. U.S.A. 2010; 107:7317–7322. [DOI] [PMC free article] [PubMed] [Google Scholar]
- 24. Giresi P.G., Lieb J.D.. Isolation of active regulatory elements from eukaryotic chromatin using FAIRE (Formaldehyde Assisted Isolation of Regulatory Elements). Methods. 2009; 48:233–239. [DOI] [PMC free article] [PubMed] [Google Scholar]
- 25. Zang C., Schones D.E., Zeng C., Cui K., Zhao K., Peng W.. A clustering approach for identification of enriched domains from histone modification ChIP-seq data. Bioinformatics. 2009; 25:1952–1958. [DOI] [PMC free article] [PubMed] [Google Scholar]
- 26. Trapnell C., Pachter L., Salzberg S.L.. TopHat: discovering splice junctions with RNA-seq. Bioinformatics. 2009; 25:1105–1111. [DOI] [PMC free article] [PubMed] [Google Scholar]
- 27. Trapnell C., Williams B.A., Pertea G., Mortazavi A., Kwan G., van Baran M.J., Salzberg S.L., Wold B.J., Pachter L.. Transcript assembly and quantification by RNA-Seq reveals unannotated transcripts and isoform switching during cell differentiation. Nat. Biotechnol. 2010; 28:511–515. [DOI] [PMC free article] [PubMed] [Google Scholar]
- 28. Huang D.W., Sherman B.T., Lempicki R.A.. Systematic and integrative analysis of large gene lists using DAVID bioinformatics resources. Nat. Protoc. 2009; 4:44–57. [DOI] [PubMed] [Google Scholar]
- 29. Whyte W.A., Orlando D.A., Hnisz D., Abraham B.J., Lin C.Y., Kagey M.H., Rahl P.B., Lee T.I., Young R.A.. Master transcription factors and mediator establish super-enhancers at key cell identity genes. Cell. 2013; 153:307–319. [DOI] [PMC free article] [PubMed] [Google Scholar]
- 30. Yue F., Cheng Y., Breschi A., Vierstra J., Wu W., Ryba T., Sandstrom R., Ma Z., Daves C., Pope B.D. et al. A comparative encyclopedia of DNA elements in the mouse genome. Nature. 2014; 515:355–364. [DOI] [PMC free article] [PubMed] [Google Scholar]
- 31. Wang L., Xu S., Lee J.-E., Baldridge A., Grullon S., Peng W., Ge K.. Histone H3K9 methyltransferase G9a represses PPARγ expression and adipogenesis. EMBO J. 2013; 32:45–59. [DOI] [PMC free article] [PubMed] [Google Scholar]
- 32. Wamstad J.A., Alexander J.M., Truty R.M., Shrikumar A., Li F., Eilertson K.E., Ding H., Wylie J.N., Pico A.R., Capra J.A. et al. Dynamic and coordinated epigenetic regulation of developmental transitions in the cardiac lineage. Cell. 2012; 151:206–220. [DOI] [PMC free article] [PubMed] [Google Scholar]
- 33. Bonn S., Zinzen R.P., Girardot C., Gustafson E.H., Perez-Gonzalez A., Delhomme N., Ghavi-Helm Y., Wilczynski B., Riddell A., Furlong E.E.. Tissue-specific analysis of chromatin state identifies temporal signatures of enhancer activity during embryonic development. Nat. Genet. 2012; 44:148–156. [DOI] [PubMed] [Google Scholar]
- 34. ENCODE Project Consortium An integrated encyclopedia of DNA elements in the human genome. Nature. 2012; 489:57–74. [DOI] [PMC free article] [PubMed] [Google Scholar]
- 35. Mikkelsen T.S., Xu Z., Zhang X., Wang L., Gimble J.M., Lander E.S., Rosen E.D.. Comparative epigenomic analysis of murine and human adipogenesis. Cell. 2010; 143:156–169. [DOI] [PMC free article] [PubMed] [Google Scholar]
- 36. Hnisz D., Abraham B.J., Lee T.I., Lau A., Saint-Andre V., Sigova A.A., Hoke H.A., Young R.A.. Super-enhancers in the control of cell identity and disease. Cell. 2013; 155:934–947. [DOI] [PMC free article] [PubMed] [Google Scholar]
- 37. Loven J., Hoke H.A., Lin C.Y., Lau A., Orlando D.A., Vakoc C.R., Bradner J.E., Lee T.I., Young R.A.. Selective inhibition of tumor oncogenes by disruption of super-enhancers. Cell. 2013; 153:320–334. [DOI] [PMC free article] [PubMed] [Google Scholar]
- 38. Witte S., Bradley A., Enright A.J., Muljo S.A.. High-density P300 enhancers control cell state transitions. BMC Genomics. 2015; 16, doi:10.1186/s12864-015-1905-6. [DOI] [PMC free article] [PubMed] [Google Scholar]
- 39. Brunmeir R., Wu J., Peng X., Kim S.Y., Julien S.G., Zhang Q., Xie W., Xu F.. Comparative transcriptomic and epigenomic analyses reveal new regulators of murine brown adipogenesis. PLoS Genet. 2016; 12:e1006474. [DOI] [PMC free article] [PubMed] [Google Scholar]
- 40. Zhou P., Robles-Murguia M., Mathew D., Duffield G.E.. Impaired thermogenesis and a molecular signature for brown adipose tissue in Id2 null mice. J. Diabetes Res. 2016; 2016, doi:10.1155/2016/6785948. [DOI] [PMC free article] [PubMed] [Google Scholar]
Associated Data
This section collects any data citations, data availability statements, or supplementary materials included in this article.


