Abstract
In our previous study, a methodology was established to predict transcriptional regulatory elements in promoter sequences using transcriptome data based on a frequency comparison of octamers. Some transcription factors, including the NAC family, cannot be covered by this method because their binding sequences have non-specific spacers in the middle of the two binding sites. In order to remove this blind spot in promoter prediction, we have extended our analysis by including bipartite octamers that are composed of ‘4 bases—a spacer with a flexible length—4 bases’. 8,044 pre-selected bipartite octamers, which had an overrepresentation of specific spacer lengths in promoter sequences and sequences related to core elements removed, were subjected to frequency comparison analysis. Prediction of ER stress-responsive elements in the BiP/BiPL promoter and an ANAC017 target sequence resulted in precise detection of true positives, judged by functional analyses of a reported article and our own in vitro protein–DNA binding assays. These results demonstrate that incorporation of bipartite octamers with continuous ones improves promoter prediction significantly.
Keywords: promoter prediction, transcriptome, plant genome
1. Introduction
The availability of large-scale gene expression data by microarray and RNASeq analyses provided the possibility of predicting transcriptional regulatory elements in promoters using these data. For such predictions, methods for extraction of consensus sequences from a set of promoter sequences have been used (e.g. Gibbs Sampler1 and MEME2). As the accuracy of these established methods is not sufficient for experimental validation, we have developed a novel, more accurate method based on a simple frequency comparison.3 The new method shows considerably higher accuracy and sensitivity than conventional methods, judged by re-prediction of experimentally identified regulatory elements.3 In addition, our recent studies demonstrated that it is also useful for predicting novel regulatory elements, and it has paved the way for prediction-oriented promoter analysis.4–6
Our prediction method compares the frequency of every octamer between focused and global promoter sets. This octamer-based methodology has worked well for recognition sites of many types of transcription factors including bZIP, AP2/DREB, zinc finger, CAMTA, and also PCF families. However, it is theoretically not good for the detection of spacer-containing bipartite motifs that are recognized by protein complexes including dimers. As a consequence, these promoter elements are considered a blind spot of our octamer-based prediction method.
There are several databases for detection of transcription factor-binding sites in the promoter region. Among them, JASPAR7 is the most popular public database that covers higher plants. Detection of promoter elements is based on DNA motifs for each transcription factor proteins, and in the case of Arabidopsis which is the most intensely collected for data in higher plants, motifs for 48 factors are available out of ∼1,900 transcription factors in the genome.8 The 48 factors include bipartite motifs for several MADS family proteins and an AP2 family protein, ANT. Obviously, the coverage is low for continuous and also bipartite motifs.
In this report, we have developed a supplemental method for promoter prediction that compensates for this blind spot by incorporating bipartite octamers (4 + 4 bases) to predictions that contain a spacer sequence in the middle. Our results using the pre-selected bipartite octamers showed improved prediction of the ER-stress responsive element (ERSE) as an element for tunicamycin-activated ER stress, and of ANAC017 target sites in promoters of the down-stream genes of ANAC017.
2. Materials and methods
2.1. Bioinformatics analysis
24,956 Arabidopsis promoter sequences of 1 kb long, starting from the most major transcription start site (TSS), were prepared previously.9 Counting of each bipartite octamer, statistical analyses, and LDSS (local distribution of short sequences) analysis10 were achieved with home-made Perl and C+ programs, and Excel (Microsoft Japan, Tokyo). Distribution profiles of bipartite octamers were subjected to smoothing with a 21 bin, which is a good width for regulatory sequences (REG),10 clustered with Cluster11 by the hierarchical method with correlation measurement, and visualized with TreeView11 as described previously.10 Prediction of transcriptional regulatory elements based on microarray data with the aid of a list of bipartite octamers was achieved essentially according to our previous report3 using modified software. Motifs of clustered sequences were expressed using WebLogo.12 For prediction of ERSEs, 162 genes with a fold-change of over 2.5 were selected from up-regulated genes (E-MEXP-3186 from ArrayExpress, https://www.ebi.ac.uk/arrayexpress/ (11 January 2017, date last accessed)).13 as a positive promoter group. Microarray data of ANAC017 mutants were also retrieved from ArrayExpress (E-GEOD-41136).14
2.2. DNA–protein binding analysis
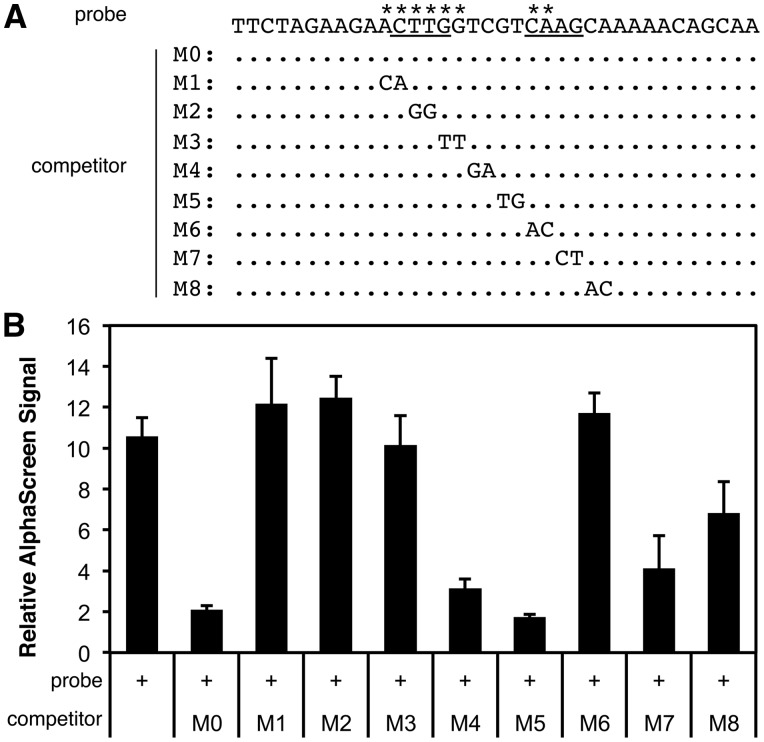
Complementary DNA for ANAC017 was prepared by reverse transcriptase-polymerase chain reaction (RT-PCR) from total RNA of Arabidopsis seedlings using a conventional method as described elsewhere.15 The coding sequence of the Flag tag and a T7 promoter were added to the ANAC017 CDS excluding the transmembrane domain (1–523 aa14) by PCR. The prepared PCR product was subjected to in vitro transcription by T7 RNA polymerase and subsequent in vitro translation by a wheat germ system as described previously.6 Binding assays of the Flag-tagged ANAC017 protein and biotinylated oligo-DNA probes were achieved using AlphaScreen (Perkin Elmer Japan, Tokyo) as described.6 Sequences of a biotinylated DNA probe and non-biotinylated competitors are shown in Fig. 6.
Figure 6.
Direct binding of ANAC017 to a bipartite octamer predicted for H2O2 response. (A) The predicted target site of ANAC017 in an ATERF71 (AT2G47520) promoter was used as a biotinylated DNA probe in a DNA–protein binding assay by AlphaScreen. Underlining shows the predicted target site identified by the bipartite analysis. The sequences of unbiotinylated competitor DNAs with base substitutions from the biotinylated probe are shown (M0–M8, unsubstituted bases are shown as dots). Asterisks on the top of the probe sequence indicate critical bases for binding by ANAC017 protein, revealed by Panel B. (B) Results of the AlphaScreen assay are shown as the relative AlphaScreen signal (the signal obtained with non-biotinylated probe/signal with biotinylated probe). The average and standard error of four assays are shown.
3. Results and discussion
3.1. Pre-selection of potential regulatory sequences
In our previous study, promoter prediction using microarray data based on enumerative octamer analysis was developed.3 The degree of overrepresentation for each octamer among a set of promoter sequences showing some transcriptional response over total promoters in a genome is calculated as the ‘Relative Appearance Ratio (RAR)’ . When predicting a specific promoter, an octamer is taken from the 5ʹ end of the promoter, the corresponding RAR value for the octamer is put back to the corresponding promoter position. Repeating these steps sliding 1 bp each time towards the 3ʹ direction provides a promoter scan with the RAR.3–6 Peak positions in the scanned results are predicted regulatory sites. We extended this procedure using a new type of bipartite octamers composed of ‘4 bases + a spacer + 4 bases’. In this article, we will refer to these octamers as ‘bipartite octamers (4 + 4)’.
As a pilot analysis, we surveyed 12 lengths of the spacer from 1 to 12 bases long. Analysis of all the possible bipartite octamers with a 12-spacer length gives 12 RAR values for each promoter point. While trials of this prediction method for cold- and high light-stress responsive elements detected novel promoter sequences that could not be detected by the previous octamer analysis without spacers, they also gave us highly complex results making their analysis difficult (data not shown). Therefore, we decided to pre-select potential regulatory sequences before carrying out frequency analysis. For this purpose, we set the priorities to high coverage over accuracy in the sequence selection, because an accurate, and thus small, selection at this point results in low sensitivity of prediction. Accuracy can be increased at the subsequent prediction steps.
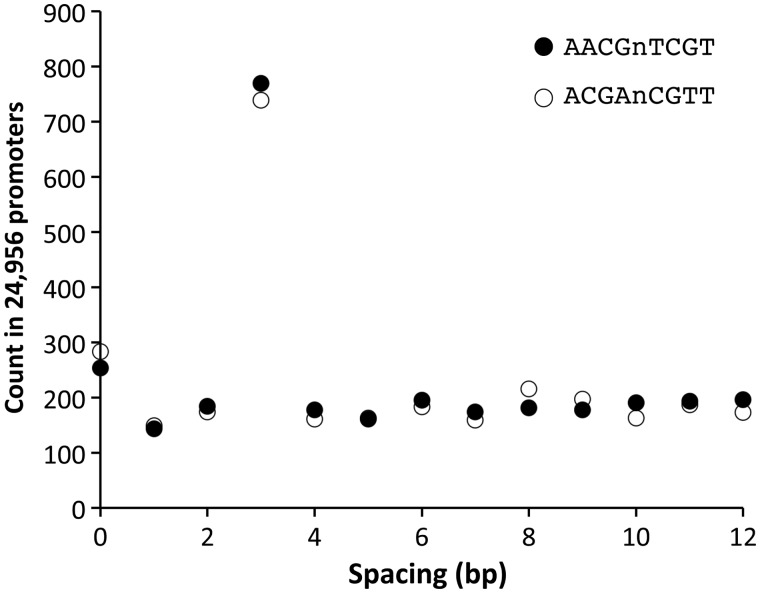
During the analysis mentioned above, we noticed an overrepresentation of a specific spacer length over the others when the octamer (4 + 4) sequence is fixed. Fig. 1 shows examples of the relationship between the spacer length and the counts in the total 24,956 promoters of the Arabidopsis genome. In the case of AACGnTCGT (n = 0–12), a spacer of three appears ∼4 times more frequently than the other spacer lengths. The probability of this count profile, represented by the peak and total counts, under the assumption of random occurrence is very low (P = 2.2E-195), suggesting a strong selection pressure towards this biased profile. Interestingly, a count profile of its complementary sequence (ACGAnCGTT) also shows the same characteristics where a spacer of three gives a single high peak.
Figure 1.
Overrepresentation of a specific length of spacer in promoter sequences. Counts of a bipartite-type octamer with a spacer in all the promoters of the Arabidopsis genome are shown. The horizontal axis indicates the number of ‘n’s, i.e. the length of the spacer between the two tetramers. The two octamers shown (AACGnTCGT and ACGAnCGTT) are mutually complementary.
Preferential appearance in the promoter sequence and conservation of characteristics between forward and reverse sequences may suggest that they are transcriptional regulatory sequences. Therefore, we decided to select bipartite octamers that have a preference for the spacer length among the promoter sequences.
With spacer lengths from 0 to 12, the number of possible bipartite octamers (4 + 4) is 48 × 13 = 65,536 × 13 (Table 1). First, one spacer length from 0 to 12 bp for each octamer with the highest count among the promoter sequences was selected, extracting 65,536 sequences from 65,536 × 13. Second, sequences with spacers of 0 and 1 were removed from 65,536 sequences because they were thought to be detected by established analysis using octamers without a spacer. Then, the P value of the count profile with 12 spacer lengths for each bipartite octamer, as shown in Fig. 1, was considered, focusing on a peak height and the total count for 13 spacers, and 9,022 octamers with P < 1E-5 were selected.
Table 1.
Selection of bipartite octamers
| Selection | Number of octamers |
|---|---|
| Total (0 ≤ n ≤ 12) | 65,536 × 13 |
| Peak space | 65,536 |
| Peak spacing: n ≠ 0, 1 & single peak | 41,158 |
| Dominance of peak space (P < E-5) | 9,022 |
| LDSS selection | |
| TATA or core | 903 |
| Solid type | 75 |
| Rest (REG & non-REG) | 8,044 |
Of the 13 spacing lengths, one with the highest appearance in the promoters was selected (Peak space), and octamers with spacing lengths of 0 or 1, and octamers with the two spacings of highest appearance (twin peaks) were removed. Distribution profiles were subjected to statistical analysis and octamers with a profile of P < E-5, as determined by the Chi-square test, were further selected. Selected octamers were subjected to LDSS analysis and TATA-, Core-, and Solid-type octamers were removed, providing a final 8,044 bipartite octamers.
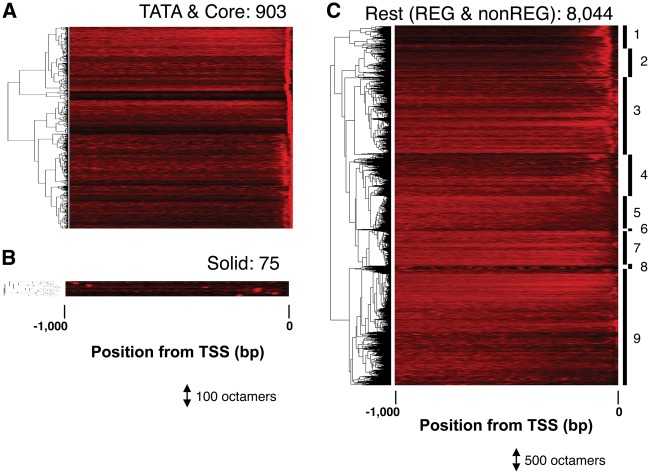
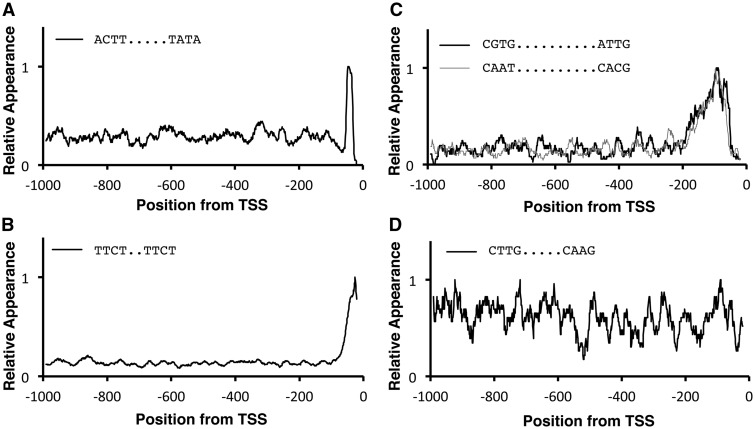
These sequences were further subjected to LDSS analysis, where preference of appearance according to promoter position was evaluated.10 According to this analysis, 903 of them are revealed to be related to core promoter elements (Fig. 2A), including TATA box (Fig. 3A) and Y Patch (Fig. 3B), and 75 sequences with ‘Solid’ distribution profiles (Fig. 2B), which potentially include transposon-related sequences, will not be transcriptional regulatory elements. These 978 identified sequences (903 + 75) were removed for further analysis. A summary of the sequence extraction is shown in Table 1.
Figure 2.
LDSS analysis of bipartite octamers. The distribution profiles of each octamer are shown. Each profile is shown as a colored horizontal line (rare = black, frequent = red), and the profiles of 903 (A), 75 (B), and 8,044 (C) octamers were subjected to hierarchical clustering. The cluster number of the ‘Rest’ group is indicated at the right end of the heat map (C). REG (1, 2), REG-like (3, 4), and non-REG (5–9).
Figure 3.
Typical LDSS profiles of bipartite octamers. Typical distribution profiles are shown: TATA type (A), Y Patch-related Core type (B), REG type (C), and non-REG type (D). Profiles were subjected to smoothing with a bin of 21 bp, and the maximum value was adjusted to 1.0. The peak position of Panel A is -47, which means the first T of the TATA within the sequence, ‘ACTT….TATA’, comes at -38. The two sequences in Panel C are complementary each other.
The remaining 8,044 sequences (Fig. 2C) were classified into three groups according to the LDSS profiles: the REG type (Clusters 1 and 2 in Figs 2C and 3C) that shows local distribution around -40 to -400 relative to the TSS and is a characteristic of a certain type of transcriptional regulatory element,10 the non-REG type whose distributions are scattered evenly with regard to promoter position (Clusters 5–9 in Figs 2C and 3D) and the intermediate REG-like type (Clusters 3 and 4 in Fig. 2C).
Figure 3C shows two distribution profiles of complementary sequences to each other, and both of them have very similar distribution profiles with peak positions around -100. These results demonstrate their distribution profile is direction-insensitive, and this feature is the same as the REG type of continuous octamers.10 Considering the distribution profiles, sequences in clusters 1 and 2 of Fig. 2C are classified as the REG type.
Sequence lists of the removed core and solid groups, and also the 8,044 selected sequences containing REG and non-REG types can be found in Supplementary Tables S1–S3, respectively.
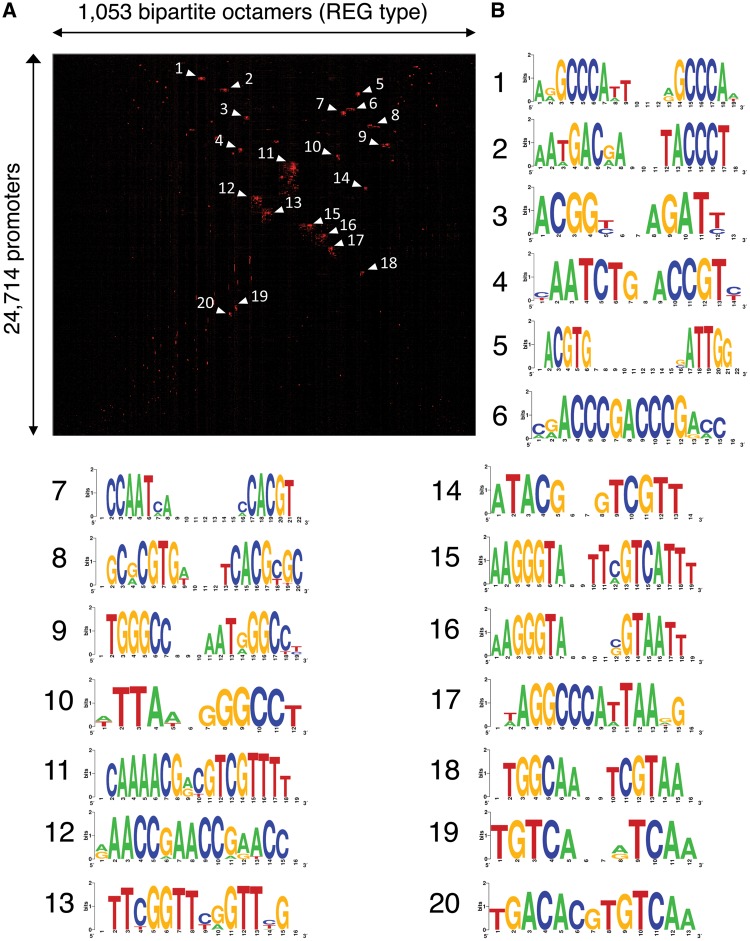
In order to pick up sequence groups from the extracted sequences, 1,053 selected REG-type sequences which are predicted to be regulatory sequences10 were mapped to 24,714 Arabidopsis promoter sequences with 1 kb length, and a matrix of presence/absence (1,053 × 24,714) was subjected to 2D clustering analysis (Fig. 4). This analysis provided us the clearest classification of cis elements.10 As shown in Panel A, several clusters have been identified each of which shares bipartite octamers and promoters.
Figure 4.
Several groups in the REG-type bipartite octamers. 1,053 bipartite octamers with distribution profiles of the REG type (Fig. 2C) were mapped to 24,714 Arabidopsis promoters, and a resultant presence/absence matrix (1,053 × 24,714) was subjected to 2D clustering analysis (A). Presence and absence of an octamer in a promoter is shown as red and black, respectively. Labels of the matrix in vertical and horizontal dimensions are omitted. Octamers of 20 largest clusters were subjected to WebLogo (B). Some pairs of cluster (1–9, 2–15, 3–4, 5–7, 10–17, 12–13) are complementary, respectively. Clusters 5 and 7 are ERSE (CCAAT-N9-CCACG).
We subsequently selected 20 largest clusters for summarization of the bipartite octamers for each cluster as sequence motifs. The motifs prepared with WebLogo12 are shown in Panel B. Several tandem repeats (clusters 1, 6, 9, 12, and 13) and also palindromic sequence (clusters 8 and 11) are included. We suggest that they are recognized by a dimer or a trimer of the same protein family.
3.2. Inclusion of known transcriptional regulatory elements in selected bipartite octamers
The 8,044 selected sequences include REG-type groups. According to their LDSS profiles, they are strongly suggested to be transcriptional regulatory sequences.10 Their inclusion in the selected sequences is an indication of the ability of the procedure utilized to identify potential regulatory sequences.
In order to find other features that may be regulatory elements in the sequences selected, we surveyed known transcriptional regulatory elements within the sequences. One of the reported bipartite regulatory motifs is the endoplasmic reticulum stress-responsive element (ERSE, consensus sequence CCAAT-N9-CCACG) that is conserved between mammals and higher plants.16 The ERSE in mammals is known to be recognized by a general transcription factor NF-Y for CCAAT and the stress responsive transcription factor ATF6 for CCACG, and spacing between the two elements is fixed to nine nucleotides.17 An ERSE is also found in Arabidopsis promoters and is known to have a conserved function.18
When we searched the selected sequences for ERSEs, 28 related sequences were found (Table 2), indicating the inclusion of these elements in the extracted sequences. Then, microarray data of the transcriptional response to ER stress activated by tunicamycin treatment19 were used to calculate the RAR values of the selected sequences. Typically, RAR values of over 3.0 are considered ‘positive’ as transcriptional regulatory sequences.3 As shown in Table 2, the RAR values of most of the ERSE-related sequences are much >3.0 (shown in bold in the table). These results mean that the bipartite ERSEs can be detected as ER stress (tunicamycin treatment)-responsive elements in our promoter prediction using the selected bipartite octamers (4 + 4). The application of such promoter prediction will be demonstrated later in this article.
Table 2.
ERSE sequences in the selected bipartite octamers
| LDSS cluster | Sequence | Motif | RAR (Tunicamycin_up) |
|---|---|---|---|
| 1_REG | ACCA…………CACG | ERSE: CCAAT-N9-CCACG | 4.42 |
| 1_REG | TCCA…………CACG | ERSE: CCAAT-N9-CCACG | 6.4 |
| 1_REG | CCAA………GCCA | ERSE: CCAAT-N9-CCACG | 3.52 |
| 1_REG | CCAA……….CCAC | ERSE: CCAAT-N9-CCACG | 4.65 |
| 1_REG | CCAA……….CACG | ERSE: CCAAT-N9-CCACG | 6.42 |
| 1_REG | CCAA…………ACGT | ERSE: CCAAT-N9-CCACG | 5.64 |
| 2_REG | CAAT………CCAC | ERSE: CCAAT-N9-CCACG | 5.84 |
| 1_REG | CAAT……….CACG | ERSE: CCAAT-N9-CCACG | 7.76 |
| 1_REG | CAAT……….ACGT | ERSE: CCAAT-N9-CCACG | 6.83 |
| 1_REG | CAAT…………CGTG | ERSE: CCAAT-N9-CCACG | 4.95 |
| 2_REG | AATA………CACG | ERSE: CCAAT-N9-CCACG | 2.3 |
| 2_REG | AATC………CACG | ERSE: CCAAT-N9-CCACG | 6.8 |
| 4_REG-like | CACG…………ATTG | ERSE: CCAAT-N9-CCACG | 8.53 |
| 2_REG | GACG…………ATTG | ERSE: CCAAT-N9-CCACG | 4.39 |
| 1_REG | ACGT……….GATT | ERSE: CCAAT-N9-CCACG | 3.93 |
| 2_REG | ACGT……….CATT | ERSE: CCAAT-N9-CCACG | 4.07 |
| 1_REG | ACGT……….ATTG | ERSE: CCAAT-N9-CCACG | 8.69 |
| 1_REG | ACGT…………TTGG | ERSE: CCAAT-N9-CCACG | 10.25 |
| 2_REG | CGTG………TATT | ERSE: CCAAT-N9-CCACG | 4.37 |
| 1_REG | CGTG………GATT | ERSE: CCAAT-N9-CCACG | 4.28 |
| 2_REG | CGTG………CATT | ERSE: CCAAT-N9-CCACG | 6.64 |
| 1_REG | CGTG……….ATTG | ERSE: CCAAT-N9-CCACG | 11.96 |
| 1_REG | CGTG……….TTGG | ERSE: CCAAT-N9-CCACG | 12.8 |
| 1_REG | CGTG…………TGGT | ERSE: CCAAT-N9-CCACG | 10.88 |
| 2_REG | GTGG………ATTG | ERSE: CCAAT-N9-CCACG | 5.69 |
| 3_REG-like | GTGT………ATTG | ERSE: CCAAT-N9-CCACG | 4.87 |
| 2_REG | TGGC………TTGG | ERSE: CCAAT-N9-CCACG | 5.74 |
| 4_REG-like | TGTC………TTGG | ERSE: CCAAT-N9-CCACG | 5.09 |
LDSS cluster indicates the group number of LDSS clustering shown in Fig. 2C. Sequence matching with ERSE is indicated with underlining. A dot in a sequence means any nucleotide. The RAR values of each octamer for tunicamycin up-regulation are also shown. RAR values >3.0 are shown in bold.
Another reported bipartite motif of higher plants is the NAC-binding motif (CTTG-N5-CAAG) that is recognized by Arabidopsis ANAC013.20 This is also called the mitochondrial dysfunction motif (MDM) which includes the NAC-binding site and has several sequence variations.20 Our extracted bipartite sequences included 13 sequences related to the NAC-binding motif (Table 3). The presence of these sequences in the extracted sequences also supports the idea that our method does extract bipartite transcriptional regulatory sequences. One feature of this group is non-REG-type distribution (Table 3).
Table 3.
NAC target sequences in the selected bipartite octamers
| LDSS cluster | Sequence | Motif |
|---|---|---|
| 7_non-REG | ACTT……CAAG | NAC: CTTG-N5-CAAG |
| 3_REG-like | CCTT……CAAG | NAC: CTTG-N5-CAAG |
| 9_non-REG | GCTT……CAAG | NAC: CTTG-N5-CAAG |
| 9_non-REG | CTTG….TGAA | NAC: CTTG-N5-CAAG |
| 3_REG-like | CTTG….CACG | NAC: CTTG-N5-CAAG |
| 9_non-REG | CTTC….CAAG | NAC: CTTG-N5-CAAG |
| 9_non-REG | CTTG….GAAG | NAC: CTTG-N5-CAAG |
| 7_non-REG | CTTG….CAAG | NAC: CTTG-N5-CAAG |
| 9_non-REG | CGTG….CAAG | NAC: CTTG-N5-CAAG |
| 4_REG-like | CTTG……AAGT | NAC: CTTG-N5-CAAG |
| 9_non-REG | CTTG……AAGG | NAC: CTTG-N5-CAAG |
| 9_non-REG | CTTG……AAGA | NAC: CTTG-N5-CAAG |
| 9_non-REG | TTGC…TGAA | NAC: CTTG-N5-CAAG |
LDSS cluster indicates the group number of LDSS clustering shown in Fig. 2C. Sequence matching with the NAC target motif is underlined. A dot in a sequence means any nucleotide.
As the NAC gene family is composed of 94–106 genes in Arabidopsis,8 variations in the target sequence among this family and differentiation of their function could be present. Therefore, the sequences in Table 3 may be recognized by different NAC proteins.
3.3. Applications of bipartite octamer analysis to promoter prediction
The selected 8,044 bipartite octamers were utilized for promoter prediction. An ER stress-responsive BiP3 promoter was selected for the prediction of tunicamycin-responsive elements. The results of this prediction were compared with those obtained using the established method using octamers without any spacers.
Figure 5A shows the results of promoter scans of BiP3 for tunicamycin-responsive elements. The vertical axis shows the RAR, and typically peaks >3.0 are selected as prediction sites. As shown, several peaks are >3.0, and two of them match experimentally identified ERSEs, ERSE-A, and ERSE-B.21 The RAR values of bipartite octamers are indicated with red X marks, and they show much higher RAR values than the continuous octamers at the positions of ERSEs, demonstrating the superiority of the bipartite octamers in detection of the ERSE.
Figure 5.
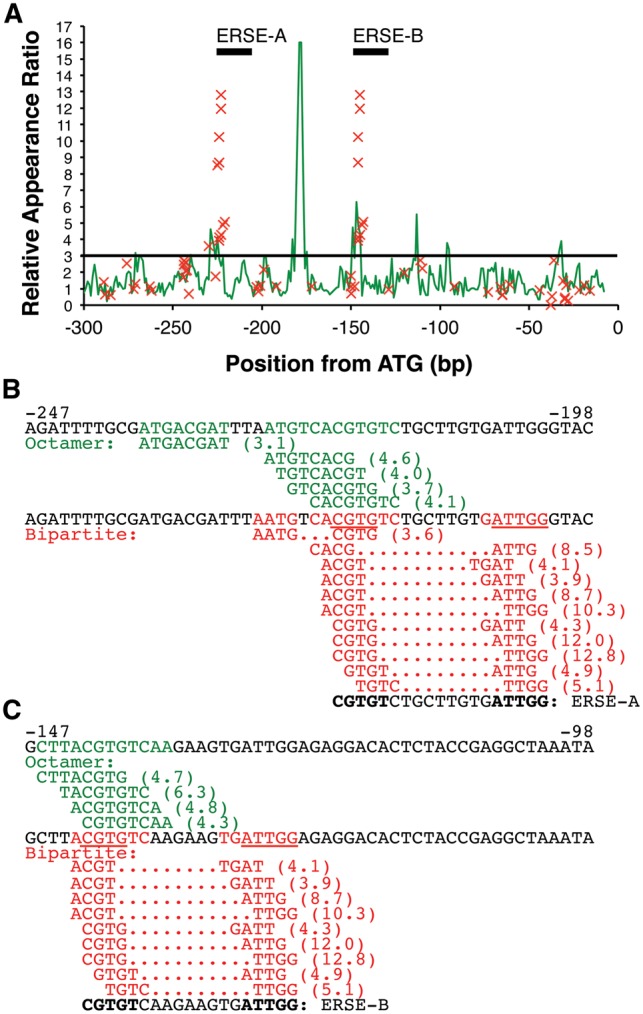
Promoter prediction of BiP3/BiP-L for tunicamycin response. Application of the bipartite sequences for prediction of tunicamycin-responsive elements in a BiP/BiP-L (AT1G09080) promoter. (A) Results of promoter scans using octamers (green line graph) and bipartite octamers (red X mark) are shown. The Relative Appearance Ratio (RAR) means the degree of overrepresentation in tunicamycin-responsive promoters over the total promoters and thus high RAR sites predict corresponding regulatory elements. A height of RAR = 3.0, a conventional threshold,3 is indicated by a black horizontal line. Positions of experimentally identified ERSEs, ERSE-A and ERSE-B, are also shown in the graph. (B and C) Sequences from -247 to -198 (B) and from -147 to -98 (C), relative to the translation start site (ATG), are shown. Green letters show predictions based on continuous octamers, and red letters are predictions based on bipartite octamers. Underlining indicates sequences that match with the ERSE motif (CCAAT-N9-CCACG). Values in parentheses are RAR scores that show the ratio of overrepresentation in tunicamycin-responsive promoters over the global promoter set in the Arabidopsis genome. ERSE-A and ERSE-B are functionally confirmed ERSEs reported by Noh et al.19 Sequence in bold means an ERSE motif in ERSE-A and ERSE-B, as reported by Noh et al.
Figure 5B and C shows sequences around ERSE-A (Panel B) and ERSE-B (Panel C), and the predictions using continuous octamers are shown in green letters. In both cases, the CCACG site of the ERSE, which is the recognition site (CGTGT, the underlining shows the match with the ERSE) of the ATF6 homolog of Arabidopsis, bZIP28,18 was detected by continuous octamer analysis, but the NF-Y binding site (ATTGG, the underlining shows the match with ERSE)18 was not. These results indicate that the bZIP binding site of the ERSE has some specificity in ER-stress responsive promoters, but the NF-Y site does not have any specificity in the same promoters, resulting in the failure to detect the NF-Y site as an ERSE.
For comparison, the same gene list from the microarray data of tunicamycin response has been applied to Gibbs Sampler, MEME, CONSENSUS and MD Scan provided by Melina II.22 These four methods could not detect either ERSE-A or ERSE-B (data not shown).
Predictions using our bipartite octamers are shown in red letters in Fig. 5B and C. Both the bZIP and NF-Y binding sites were detected as putative ERSEs, indicating the advantage of using the bipartite octamer analysis to predict the bipartite ERSE. Comparison of the RAR signals between the two methods reveals that signals of the bipartite octamer analysis are much higher than those of the continuous octamer analysis (Panel A). This indicates higher sequence specificity of the detected ERSE sequences in the bipartite octamer method than in the continuous method.
These results, shown in Fig. 5, demonstrate that detection of ERSEs among tunicamycin-stimulated ER-stress responsive promoters has been considerably improved by introducing the bipartite octamer analysis.
The second application of our new method is the prediction of ANAC017 target sites using microarray data of Arabidopsis ANAC017 mutants.14 As ANAC017 is a mediator of H2O2 signaling, the effect of a mutation was compared with wild type after H2O2 treatments. As shown in Fig. 6A, a promoter region of ATERF71 was predicted as a target site of ANAC017 (underlined) according to the following results: the expression level of ATERF71 was reduced in the ANAC017 mutants, and a target site of ANAC017 predicted by bipartite octamer analysis was mapped to the promoter region of ATERF71.
In order to confirm the predicted target site of ANAC017, direct binding of ANAC017 protein to the DNA sequence was examined in vitro by the AlphaScreen method. A FLAG-tagged ANAC017 protein was prepared in vitro using wheat germ and subjected to binding assays with a biotinylated oligo DNA probe. As shown in Fig. 6, binding assays of the ANAC017 protein to the probe containing the predicted target site gave positive signals, indicating direct binding (no competitor, Panel B). Addition of a non-biotinylated competitor reduced the signal (competitor M0), but addition of mutated competitors of M1, M2, M3, and M6 failed to reduce the binding signals. The target sequence, revealed by these assays, that is necessary for the binding is shown with asterisks in Panel A. These results demonstrate that the bipartite octamer analysis developed here has predicted the exact target sequence of the ANAC017 protein based on microarray data of ANAC017 mutants.
3.4. Possibility of further extension
We have tried several patterns other than [4 + 4], but could not obtain good improvements so far. In an example, a zinc finger protein, STOP1, recognizes [3 + 3 + 2] in a target promoter,5 but prediction of the target site using its knockout data was better with [8] than with [3 + 3 + 2] for some unknown reason. Currently, only results of [4 + 4] are worth reporting. We have given up to increase division patterns. We now think that extension of octamer analysis is enough with addition of [4 + 4].
In summary, we have successfully developed a supplementary method for promoter prediction for spacer-containing transcriptional regulatory elements in Arabidopsis. This method should be used alongside the octamer analysis that was established year ago3 and is applicable to any other genomes that are thought to contain bipartite transcriptional regulatory elements.
Conflict of interest
None declared.
Supplementary data
Supplementary Tables S1–S3 are available at www.dnaresearch.oxfordjournals.org.
Funding
This work is supported in part by JST ALCA (to Y.Y.Y.) and Grant-in-Aid for Scientific Research on Innovative Areas ‘Plant Perception’ (No. 23120511) (to Y.Y.Y.).
Supplementary Material
References
- 1. Lawrence C. E., Altschul S. F., Boguski M. S., Liu J. S., Neuwald A. F., Wootton J. C.. 1993, Detecting subtle sequence signals: a Gibbs sampling strategy for multiple alignment. Science, 262, 208–14. [DOI] [PubMed] [Google Scholar]
- 2. Bailey T. L., Elkan C.. 1995, The value of prior knowledge in discovering motifs with MEME. Proc. Int. Conf. Intell. Syst. Mol. Biol., 3, 21–9. [PubMed] [Google Scholar]
- 3. Yamamoto Y. Y., Yoshioka Y., Hyakumachi M., et al. 2011, Prediction of transcriptional regulatory elements for plant hormone responses based on microarray data. BMC Plant Biol., 11, 39. [DOI] [PMC free article] [PubMed] [Google Scholar]
- 4. Matsuo M., Johnson J. M., Hieno A., et al. 2015, High REDOX RESPONSIVE TRANSCRIPTION FACTOR1 levels result in accumulation of reactive oxygen species in Arabidopsis thaliana shoots and roots. Mol. Plant, 8, 1253–73. [DOI] [PubMed] [Google Scholar]
- 5. Tokizawa M., Kobayashi Y., Saito T., et al. 2015, SENSITIVE TO PROTON RHIZOTOXICITY1, CALMODULIN BINDING TRANSCRIPTION ACTIVATOR2, and other transcription factors are involved in ALUMINUM-ACTIVATED MALATE TRANSPORTER1 expression. Plant Physiol., 167, 991–1003. [DOI] [PMC free article] [PubMed] [Google Scholar]
- 6. Hayami N., Sakai Y., Kimura M., et al. 2015, The responses of Arabidopsis ELIP2 to UV-B, high light, and cold stress are regulated by a transcriptional regulatory unit composed of two elements. Plant Physiol., 169, 840–55. [DOI] [PMC free article] [PubMed] [Google Scholar]
- 7. Mathelier A., Fornes O., Arenillas D. J., et al. 2016, JASPAR 2016: a major expansion and update of the open-access database of transcription factor binding profiles. Nucleic Acids Res., 44, D110–115. [DOI] [PMC free article] [PubMed] [Google Scholar]
- 8. Mitsuda N., Ohme-Takagi M.. 2009, Functional analysis of transcription factors in Arabidopsis. Plant Cell Physiol., 50, 1232–48. [DOI] [PMC free article] [PubMed] [Google Scholar]
- 9. Hieno A., Naznin H. A., Hyakumachi M., et al. 2014, ppdb: plant promoter database version 3.0. Nucleic Acids Res., 42, D1188–92. [DOI] [PMC free article] [PubMed] [Google Scholar]
- 10. Yamamoto Y. Y., Ichida H., Matsui M., et al. 2007, Identification of plant promoter constituents by analysis of local distribution of short sequences. BMC Genomics, 8, 67. [DOI] [PMC free article] [PubMed] [Google Scholar]
- 11. Eisen M. B., Spellman P. T., Brown P. O., Botstein D.. 1998, Cluster analysis and display of genome-wide expression patterns. Proc. Natl. Acad. Sci. U. S. A., 95, 14863–8. [DOI] [PMC free article] [PubMed] [Google Scholar]
- 12. Crooks G. E., Hon G., Chandonia J. M., Brenner S. E.. 2004, WebLogo: a sequence logo generator. Genome Res., 14, 1188–90. [DOI] [PMC free article] [PubMed] [Google Scholar]
- 13. Nagashima Y., Mishiba K., Suzuki E., Shimada Y., Iwata Y., Koizumi N.. 2011, Arabidopsis IRE1 catalyses unconventional splicing of bZIP60 mRNA to produce the active transcription factor. Sci. Rep., 1, 29. [DOI] [PMC free article] [PubMed] [Google Scholar]
- 14. Ng S., Ivanova A., Duncan O., et al. 2013, A membrane-bound NAC transcription factor, ANAC017, mediates mitochondrial retrograde signaling in Arabidopsis. Plant Cell, 25, 3450–71. [DOI] [PMC free article] [PubMed] [Google Scholar]
- 15. Hieno A., Naznin H. A., Sawaki K., et al. 2013, Analysis of environmental stress in plants with the aid of marker genes for H2O2 responses. Methods Enzymol., 527, 221–37. [DOI] [PubMed] [Google Scholar]
- 16. Iwata Y., Koizumi N.. 2012, Plant transducers of the endoplasmic reticulum unfolded protein response. Trends Plant Sci., 17, 720–7. [DOI] [PubMed] [Google Scholar]
- 17. Yoshida H., Okada T., Haze K., et al. 2001, Endoplasmic reticulum stress-induced formation of transcription factor complex ERSF including NF-Y (CBF) and activating transcription factors 6alpha and 6beta that activates the mammalian unfolded protein response. Mol. Cell. Biol., 21, 1239–48. [DOI] [PMC free article] [PubMed] [Google Scholar]
- 18. Liu J. X., Howell S. H.. 2010, bZIP28 and NF-Y transcription factors are activated by ER stress and assemble into a transcriptional complex to regulate stress response genes in Arabidopsis. Plant Cell, 22, 782–96. [DOI] [PMC free article] [PubMed] [Google Scholar]
- 19. Martinez I. M., Chrispeels M. J.. 2003, Genomic analysis of the unfolded protein response in Arabidopsis shows its connection to important cellular processes. Plant Cell, 15, 561–76. [DOI] [PMC free article] [PubMed] [Google Scholar]
- 20. De Clercq I., Vermeirssen V., Van Aken O., et al. 2013, The membrane-bound NAC transcription factor ANAC013 functions in mitochondrial retrograde regulation of the oxidative stress response in Arabidopsis. Plant Cell, 25, 3472–90. [DOI] [PMC free article] [PubMed] [Google Scholar]
- 21. Noh S. J., Kwon C. S., Oh D. H., Moon J. S., Chung W. I.. 2003, Expression of an evolutionarily distinct novel BiP gene during the unfolded protein response in Arabidopsis thaliana. Gene, 311, 81–91. [DOI] [PubMed] [Google Scholar]
- 22. Okumura T., Makiguchi H., Makita Y., Yamashita R., Nakai K.. 2007, Melina II: a web tool for comparisons among several predictive algorithms to find potential motifs from promoter regions. Nucleic Acids Res., 35, W227–31. [DOI] [PMC free article] [PubMed] [Google Scholar]
Associated Data
This section collects any data citations, data availability statements, or supplementary materials included in this article.


