

Abstract
Coordinated transcriptional and metabolic reprogramming ensures a plant’s continued growth and survival under adverse environmental conditions. Transcription factors (TFs) act to modulate gene expression through complex cis-regulatory element (CRE) interactions. Genome-wide analysis of known plant CREs was performed for all currently predicted protein-coding gene promoters in grapevine (Vitis vinifera L.). Many CREs such as abscisic acid (ABA)-responsive, drought-responsive, auxin-responsive, and evening elements, exhibit bona fide CRE properties such as strong position bias towards the transcription start site (TSS) and over-representation when compared with random promoters. Genes containing these CREs are enriched in a large repertoire of plant biological pathways. Large-scale transcriptome analyses also show that these CREs are highly implicated in grapevine development and stress response. Numerous CRE-driven modules in condition-specific gene co-expression networks (GCNs) were identified and many of these modules were highly enriched for plant biological functions. Several modules corroborate known roles of CREs in drought response, pathogen defense, cell wall metabolism, and fruit ripening, whereas others reveal novel functions in plants. Comparisons with Arabidopsis suggest a general conservation in promoter architecture, gene expression dynamics, and GCN structure across species. Systems analyses of CREs provide insights into the grapevine cis-regulatory code and establish a foundation for future genomic studies in grapevine.
Keywords: gene co-expression network, cis-regulatory element, grapevine, promoter, transcriptional regulation
1. Introduction
Transcription factors (TFs) regulate the transcription of target genes both spatially and temporally through the specific binding of cis-regulatory elements (CREs or ‘motifs’) present in their promoters. On average 5% of the protein-coding genes encode TFs in monocotyledon and dicotyledonous plants, which can be divided into super families, and further into families, based on their DNA-binding domains.1 To date, 58 families have been assigned for plants,1 some of them are grouped in six TF super families. Many of these TF are essential for plant cell division, development, growth, and responses to the environment.2 In the last decade, ongoing efforts in curating reported plant CREs3,4 have been fruitful, providing useful clues into the role of TFs in regulating specific promoter sequences of interest. There have been recent efforts to elucidate the TF-binding specificity in Arabidopsis at a genome-wide scale using in vitro techniques coupled to high-throughput platforms such as protein binding microarrays.5 This strategy provided valuable CRE information for a large number of TFs (63 in total) covering 25 TF families. The most widely studied CREs in plants include the ABRE (abscisic acid (ABA)-responsive element) and DRE (dehydration-responsive element)/CRT (C-repeat) elements which are largely implicated in stress responses,6 CArG-box,7 AuxRE,8 and E2F-binding elements9 in plant development, and MBS elements implicated in a myriad of development processes and stress responses.10 Others CREs that belong to lesser known TF families (e.g. Golden2-like, GLK)5 or that are critical for the binding of well characterized TFs (e.g. AUXIN RESPONSE FACTOR, ARF)5,11 have been recently characterized as well.
Knowledge pertaining to TF and CRE repertoire has been instrumental in developing regulatory models explaining changes in gene expression patterns across organs, tissues, or in response to stress in Arabidopsis5,12–14 and some crop species.15,16 Approaches that consider the absence/presence of CREs, the distribution of CRE positions, or their over-representation (ratio of observed/random expectation) have all been used to establish transcriptional regulatory models in plants13,15,17 and mammals.18 Many of these studies have highlighted that CREs having a position bias towards the transcription start site (TSS) are more likely to be bona fide CREs functioning in important biological roles. Other sophisticated models that consider CRE combinatorial rules12,16 or its integration with gene co-expression networks (GCNs)5,12–14 have also been favored. In GCNs, genes are represented as nodes, and edges connecting any two nodes depict similarity in expression profile across different organs/tissues, developmental stages, and/or stress conditions. GCNs can be further classified into ‘condition-independent’ or ‘condition-specific’ GCNs, representing relationships inferred from multiple experimental conditions or in determined conditions (e.g. abiotic stress, biotic stress, or tissue-specificity), respectively.19 Lineage-specific GCNs have also been explored.20,21 Systems-based approaches, such as the integration of CREs, promoter architecture, and GCNs analysis, are promising methodologies to infer gene function,22 and are complementary to other network inference methods such as associologs—orthologous gene associations—and genome context similarities.23
Grapes (Vitis vinifera L.) are amongst the world’s major fruit crops and are highly valued for fresh fruit consumption and winemaking. The grapevine genome24 provides a strong foundation for elucidating the molecular genetics involved in grapevine physiology and response to environment. Specifically, seminal studies involving large-scale gene expression profiling have revealed important mechanisms and biomarkers critical for grapevine development across organs/tissues25,26 and berry phenotypic plasticity (e.g. genotype × environment interactions).27 The availability of the grapevine genome and the rapid accumulation of publicly available grapevine whole-genome microarray and RNA-seq datasets provide the raw material necessary for GCN and CRE analyses. To date, several studies have utilized GCN and CRE analyses in revealing biologically relevant target genes of grapevine TFs28–30 and/or providing clues into the regulatory relationships of TFs in key metabolic and ripening pathways.31,32 However, to date no study has characterized grapevine promoter architecture and identified putative CRE regulatory modules at a genome-wide scale.
In this study, the distribution and organization of promoter CREs and their properties were analysed for all currently predicted protein-coding genes in grapevine. Further insights into the biological role(s) of genes containing these CREs were achieved through analysis of enriched plant biological pathways. Meta-analysis of next-generation sequencing (RNA-seq) datasets and the grapevine tissue developmental atlas revealed the importance of many CREs in stress and developmental regulation. A bottom-up strategy was adopted to identify regulatory modules potentially driven by CREs in both stress- and development-specific GCNs. We apply a robust approach by integrating different layers of information—promoter architecture, gene expression, and GCNs—to identify the cis-regulatory code during environment stress, growth, and/or development in grapevine. The insights of this study will allow the prioritization of CREs and gene candidates for functional characterization in grapevines.
2. Materials and methods
2.1. Discovery of known plant CREs in grapevine promoters
Candidate plant CREs, were compiled from two plant promoter databases, namely AGRIS4 and PLACE,3 and from protein-binding microarray inferred CREs of 25 Arabidopsis TF families.5 A total of 559 non-redundant CREs were retained for subsequent analysis. The promoters of the grapevine genes were downloaded from EnsemblPlants using Biomart (http://plants.ensembl.org/index.html; 1 March 2016, date last accessed). Sequences between -1 to -1,000 bp upstream of each gene TSS containing < 10% N sequences were deemed as candidate promoter sequence of each gene. All 559 non-redundant CREs were scanned for exact pattern match (no mismatch) across 29,839 promoters on both + and – strands, and indexed for the number of occurrence, strand, and position information.
2.2. Positional bias and fold-change enrichment analysis of CREs in grapevine promoters
Each CRE was evaluated for positional bias using two popular approaches; the clustering factor (CF),18 and a recently proposed index, the Z-score.13 Another approach based on the fold-change/enrichment between observed/expected frequencies with resampling was considered.15 For the CF calculation, the number of occurrences of each CRE in each bin (50 bases, 20 bins total) was calculated. Based on the abundance of the CRE in the 20 bins, the mean (x̄) and standard deviation (σ) were calculated. A second mean (x̄ ʹ) and a second standard deviation (σʹ) were calculated based only on bin values that were < 2σ above x̄. Then the CF is calculated with the equation: CF = (xmax - x̄ ′)/(σ′). The Z-score,13 for a given CRE was calculated considering every gene in the mutual rank (MR) network(s). The Z-score for each CRE is calculated with the equation: Z-score = (L/2 + p)/√[((L - l + 1) ^2 − 1)/n], where L corresponds to the length of the promoter, l corresponds to the length of the motif, n corresponds the number of instances that the CRE is found in the promoters of the genes, and p corresponds to the mean position from all the instances the CRE was found. For the fold-change/enrichment (FE) calculation, the observed frequency is calculated as in the Z-score, based on the number of instances that the CRE was found in the promoters, and the expected frequency was calculated by performing 1,000 replicates of random sampling with equal sizes (number of genes containing the selected CRE).
2.3. Compilation of transcriptome datasets, differential expression (DE), and comparative gene expression analysis
Two different compilations of databases were made: a stress-related compendia, which was mainly derived from next-generation sequencing (RNA-seq) datasets publicly available from NCBI Sequence Read Archive (http://www.ncbi.nlm.nih.gov/sra; last accessed 01/03/2016), and a grapevine tissue developmental series (atlas), based on the NimbleGen Grape Whole-genome microarray platform. For RNA-seq datasets, quality control of raw single- and pair-end FASTQ reads were performed with Trimmomatic v0.36,33 ensuring all reads maintained a minimum Q score of 20 and a length of 40. Bowtie2 v2.2.734 was used with default parameters for read alignments using the 12× grapevine reference genome PN40024.24 Read summarization was performed with htseq-count v0.6.1 using the 12x V1 annotation with default settings.35DESeq236 was used for the DE analysis of the stress (RNA-seq) datasets, comparing the experiments’ treatments against controls. For the grapevine atlas dataset, DE analysis was performed using limma37 comparing the development progression from young to mature of each organ, except flower-, seedling-, and root-specific tissues. A threshold of false discovery rate (FDR) < 0.05 and absolute log2FC > 1 represents significant DE genes identified through DESeq2 and limma in each comparison. Estimation of RNA-seq derived transcript abundance was performed with DESeq2 by applying variance-stabilizing transformation (VST) while pre-normalized probe intensities (using Robust Multi-Array Average), were gathered from.25 All predicted grapevine-Arabidopsis orthologues were downloaded from EnsemblPlants (http://plants.ensembl.org/index.html; 1 March 2016, date last accessed). Expression analysis of Arabidopsis genes was conducted using the AtGenExpress compendium for the ‘stress’ and ‘pathogen’ series via the Bio-Analytic Resource for Plant biology database (http://bar.utoronto.ca/; 1 December 2016, date last accessed) expression browser tool.
2.4. Construction of GCNs
Prior to network construction, genes that are not DE in at least one comparison in each compendium were filtered. A final non-redundant list of DE genes in the stress-responsive and atlas compendia were obtained and used for GCN construction. Principal component analysis was performed on the RNA-seq VST dataset using R (http://www.r-project.org). Pearson’s correlation coefficient (PCC) values were used as a measurement of expression similarity between gene pairs. Ranks were assigned to gene pairs based on the PCC values of their genes. The formula for geometric mean of the ranks, MR(AB) = √(Rank(A→B) × Rank(B→A)), was used to calculate the MR value for each pair-wise genes.19,20 Rank(A→B) corresponds to the rank assigned to gene B given the list of co-expression genes from gene A, while vice versa for Rank(B→A). For each individual network (stress and atlas), the significance of MR values was estimated based on 1,000 permutations as per.21
2.5. Network-based CRE subnetwork selection and functional enrichment analysis
For each gene and all immediate connected genes (nodes) forming a group, enrichment P-values for CREs in their promoters were based on hypergeometric distribution.13 From each GCN with significant MR values, genes having a given CRE enriched at P < 0.01 were then selected as ‘seed’ or ‘guide’ genes to generate the relevant CRE network. For the construction of Arabidopsis CRE network (P < 0.01), the Arabidopsis graphical Gaussian model gene network with a partial correlation threshold > 0.05 was used.13 To further identify densely connected regions (subnetworks) within each CRE network, the Girvan–Newman fast greedy algorithm was applied.38 Functional enrichment of MapMan39 ontology terms for grapevine and Arabidopsis was performed in R and terms with an FDR < 0.05 were considered significantly enriched. In each CRE subnetwork, genes within selected ‘seed’ or ‘guide’ gene(s) node vicinity of up to two steps (k = 2) were extracted for further analyses. All visualization of various CRE subnetworks was performed with Cytoscape v3.4.40
3. Results and discussion
3.1. Distribution of CREs in grapevine promoters
An evaluation of base composition is often the first step in characterizing promoter sequences of an organism. In this study, analysis of promoter sequences (1,000 bp upstream of the TSS) revealed an AT-rich ratio, where A:C:G:T composition are 0.33:0.16:0.16:0.34, respectively. Promoter sequences of Arabidopsis, soybean, and rice are also AT-rich15 which is a strong indicator of bona fide plant promoter regions.41 Therefore, promoter sequences extracted here likely reflect actual promoter regions and not random genomic regions. Rigorous statistical and DNA-binding specificity evaluation have shown that CREs between 6- and 8-mer provide an optimal threshold for capturing most biologically relevant CREs.5,16,17 Indeed, the occurrence of CREs, shorter than 6-mer or larger than 8-mer, in the promoters of the grapevine genome (Supplementary File 1) might result in a large or small number of hits, respectively, complicating the statistical evaluation for the identification of biologically relevant CREs (Fig. 1, Supplementary Table S1). Focussing on promoter sequences containing CREs between 6- and 8-mer, three separate approaches were considered to identify biologically relevant CREs, fulfilling a positional bias towards the TSS (using CF and Z-score) and/or having high fold enrichment when compared with random occurrences in shuffled promoter sequences (using FE). CREs were seen to score differently according to each of the three approaches (Supplementary Table S1).
Figure 1.
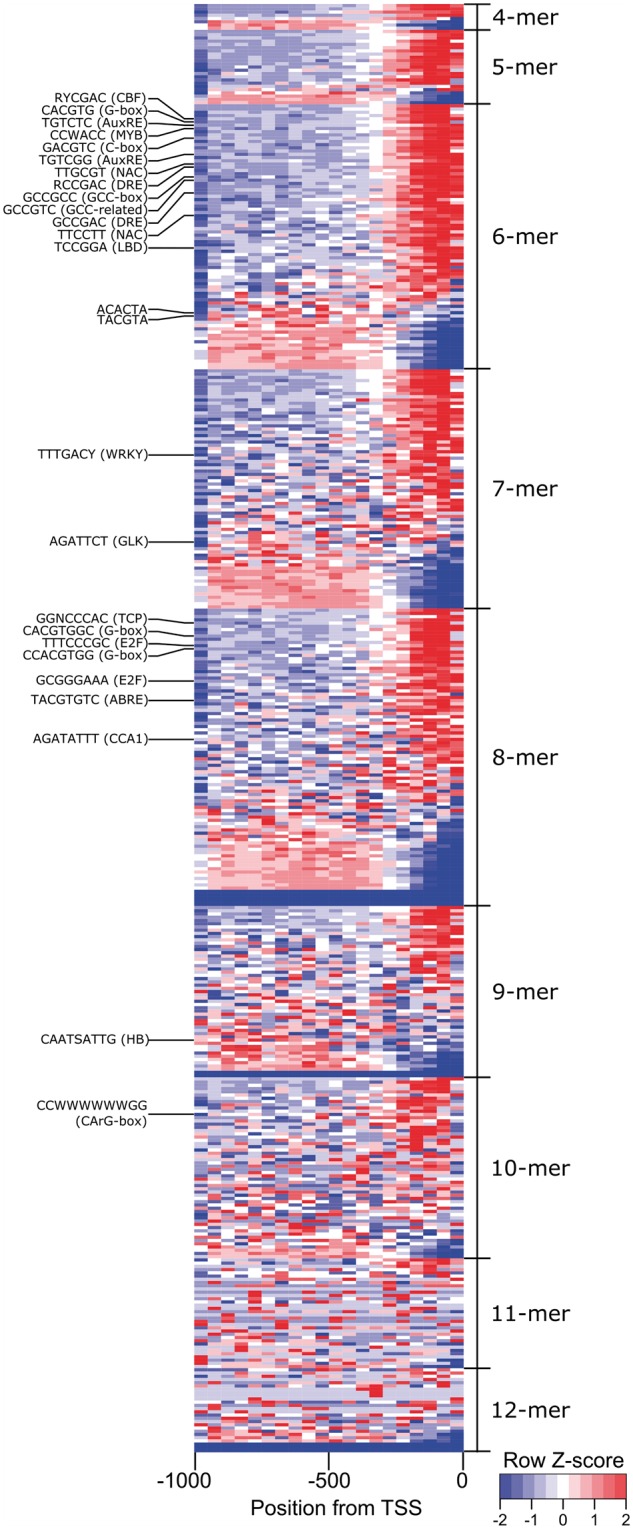
Distribution of selected CREs in grapevine promoter sequences. CREs of each size category (4–12-mer) were ranked according to their Z-score values in descending order. The frequencies of each CRE are binned into 50 bp intervals from the TSS (0 bp) to –1,000 bp. High and low frequencies of each CRE are depicted as red/light gray and blue/dark gray color shades, respectively. Examples of CREs and their commonly associated names are indicated in brackets. TSS, transcription start site.
Several examples 6-mer CREs that are canonical TF binding sites for auxin responsive factor (AuxRE5,11,42: TGTCTC and TGTCGG), AP2/ERF superfamily (DRE43: RCCGAC and GCCGAC; and GCC-box43: GCCGCC), bZIP44 (G-box: CACGTG; and C-box: GACGTC), bHLH45,46 (G-box), and CAMTA (CGCGBOXAT47: VCGCGB) TFs showed strong position bias towards the TSS and/or were strongly over-represented. The AuxRE TGTCTC CRE had a CF (highest) and Z-score score of 5.8, was present in 9,111 promoters (n = 11,621 occurrences) with a peak position between 0 and 50 bp from the TSS, and had a FE value showing 3.3-fold more observed occurrences compared with occurrences in random promoters (Fig. 1, Supplementary Table S1). A novel AuxRE, TGTCGG, which was recently shown to be the preferred binding site for ARFs compared with TGTCTC5,11 has a slightly different distribution profile. TGTCGG is present in fewer (4,411) promoters, with a different peak position (50–100 bp upstream of TSS), lower CF and Z-score, but with higher FE values (6.8-fold more occurrences than in random promoters). Commonly associated bZIP and bHLH binding site motif, G-box (CACGTG), was present in 6,200 promoters (n =7,956 occurrences) with a peak position between 50 and 100 bp from the TSS, and CF, Z-score, and FE, of 2.9, 6.1, and 4.8 (Supplementary Table S1). Meanwhile, the GCCGAC CRE, a component of DRE, was among the CREs with the highest FE (12.9-fold more occurrences than in random promoters), was present in 2,312 promoters (n = 2,529 occurrences), with the same peak position as G-box, with CF and Z-score of 2.9 and 3.9, respectively.
Considering 8-mer CREs, several CREs potentially targeted by E2F TF9 including the GCGGGAAA (E2F1OSPCNA) and TTTCCCGC (E2FANTRNR), present in 347 (n= 360 occurrences) and 410 (n= 418 occurrences) promoters were ranked highly considering CF, Z-scores, and FE criterions. In addition, several longer instances of G-box (e.g. CACGTGGC and CCACGTGG), and other instances of bZIP TFs44 (e.g. TACGTGTC) were also highly ranked. Among the top-scoring 8-mer CREs for CF is the AGATATTT sequence, a circadian clock associated CRE, recognized by Arabidopsis MYB-related TF, CCA1, and RVE1.5,48 There were 4,120 promoters containing AGATATTT (n = 4,567 occurrences) with a peak position between 0 and 50 bp from the TSS, and a FE value of 7.2 (Supplementary Table S1).
Top-scoring CREs in grapevine promoters, such as the G-box, CGCGBOXAT, DRE, GCC-box, E2F1OSPCNA, and AGATATTT, share similar promoter distribution profiles as in the promoters of other species; having a peak position within 200 bp upstream of TSS,15,17 a high Z-score (>3)13 and/or CF, or are highly over-represented compared with random promoters5,15 reaffirming some extent of conservation in plant promoter architecture and CRE distribution.14,16,17 Several exceptions exist where well-characterized plant CREs, such as CArG box (CC[A/T]6GG) and A-box (TACGTA) recognized by MADS TFs7 and bZIP44 TFs, respectively (Fig. 1, Supplementary Table S1), do not possess authentic CRE properties. This observation does not discount these CREs’ involvement in the regulation of plant biological functions, showing the need for additional scanning approaches or other statistical models12 in order to capture the full spectrum of functional CREs in grapevine.
3.2. Enriched biological pathways support the relevance of CREs in grapevine promoters
To ascertain the biological roles of genes whose promoters contain these CREs, functional enrichment analysis has been widely adopted.14,16 In this study, the MapMan ontology,39 tailored specifically for plants, was adopted for the identification of enriched biological pathways due to its improve gene function prediction performance compared with gene ontology.49 The evaluation of all compiled CREs was performed and summarized in Supplementary Table S2. Emphasis is given to those which scored highly across the CF, Z-score, or FE (Fig. 2).
Figure 2.

Enriched functional categories of genes containing selected 6-mer and 8-mer CREs in their promoter sequences. The opacity of the dot corresponds to –log10 FDR functional category enrichment values. The size of the dots corresponds to the number of genes (log10 scaled) whose promoters contain the selected CRE. Commonly associated names for CREs are indicated in brackets.
The AuxRE, TGTCTC, was enriched (FDR < 0.05) in protein targeting, regulation of transcription, and secondary metabolism with 64,724, and 251 genes, respectively (Supplementary Table S2). Conversely, TGTCGG-containing promoters are highly enriched in hormone metabolism (168 genes, FDR < 5.5E-04) pathways, specifically auxin (49 genes) and ethylene (38 genes) biosynthesis and regulation. Cell wall metabolism (105 genes) and post-translational modification (160 genes) pathways were also significantly enriched. Enrichment of hormone homeostasis and post-translational modification pathways is not surprising as these mechanisms regulate plant ARF function and ARFs are known to facilitate feedback loops within the auxin signalling pathway.8 Although both TGTCTC’s and TGTCGG’s functional enrichment profiles suggest that various pathways are potentially targeted by ARFs in grapevine, TGTCGG-containing promoters show higher enrichment profiles coinciding with a higher affinity presence of ARFs.5,11 Nonetheless, treatment of the auxin analogue (naphtalenacetic acid) in grape berries at the onset of ripening and harvest significantly modulated > 1,000 genes at each stage, many of which were auxin- and ethylene-related pathway genes,50 consistent with the enrichment profiles of TGTCGG-containing genes reported here. As no grapevine ARFs have been functionally characterized, the specificity of each member (19 in total8) in delineating real targets from the vast number of AuxRE-containing promoters, and the exact mode of their regulation (activation/repression), remains to be determined.
The CACGTG (G-box) containing promoters were enriched (FDR < 0.05) in a plethora of pathways including regulation of transcription (552 genes), abiotic and biotic stress (230 genes), development (185 genes), flavonoid metabolism (85 genes), sugar metabolism (43 genes), and many more (Supplementary Table S2). This observation is consistent with the role of plant bZIP44 and bHLH46 TFs; especially a subset of those who regulate a large repertoire of plant development processes and stress responses (e.g. bZIP-HY551,52 and bHLH-PIFs45). In grapevine, recent studies demonstrate that bZIP/bHLH TFs have a role in regulating fruit ripening (VviABF253) and the flavonoid pathway (VvibZIPC22,28VviHY5,29 and VviMYC154). The high enrichment of CACGTG-containing genes (122 genes, FDR < 2.1E-05) in biotic stress pathways is of interest as limited information is known on the roles of bZIP and bHLH TFs in plant immunity regulatory networks.55
Promoters of genes containing AGATATTT, a circadian clock associated CRE, were highly enriched in secondary metabolism (197 genes, FDR < 4.6E-06; especially flavonoids and isoprenoids), hormone metabolism (159 genes, FDR < 1.1E-04), and abiotic stress (102 genes, FDR < 1.5E-03) pathways. The ubiquity of the circadian clock in regulating many aspects of secondary metabolism (e.g. flavonoid and isoprenoid), hormone biosynthesis and signaling (e.g. jasmonic acid (JA), salicylic acid (SA), auxin, and ABA), and abiotic stress (e.g. cold, drought, and nutrient availability) is well documented.56,57 Interestingly, many chalcone (10 genes), stilbene (20 genes),58 and terpene (35 genes)59 synthases that contain the AGATATTT CRE within their promoters, exist in grapevines as highly duplicated gene families compared with other plants.24 Many of these stilbene and terpene synthases may belong to a novel ‘expanded’ clock regulatory network in grapes, especially for stilbene synthases which are exclusively found in stilbene-producing plants, such as grapevines.58 These insights reveal both potential and novel regulatory repertoires of grapevine circadian clock homologues, VviLHY and VviRVE1.60
Collectively, these examples and many others (Supplementary Table S2) characterize potential targets of grapevine TFs and provide insight into the collective roles of genes containing certain CREs. Nonetheless, we further explored the possibility of obtaining more information on the grapevine CRE cis-regulatory code by integrating large-scale gene expression meta-analysis and GCN. Compared with approaches that solely rely on the distribution of CREs alone, integrated approaches provides a deeper understanding of the contribution of CREs in determining global gene expression responses12 and the coordinated regulation among genes in a GCN based on their network connectivity and promoter CRE structure.13
3.3. Numerous CREs are implicated in grapevine stress-responsive and development-dynamic transcription
To determine the contribution of CREs in determining stress-responsive and development-dynamic gene transcription, meta-analysis of publicly available next-generation sequencing (RNA-seq) and the grapevine tissue developmental atlas was first performed (Supplementary Fig. S1). The survey for stress-related RNA-seq datasets yielded a total of 87 conditions (260 non-averaged) from 10 experiments that considered various abiotic (e.g. drought and shading) and biotic stress (e.g. Botrytis cinerea, Erysiphenecator, and Plasmoparaviticola) (Supplementary Table S3). All these conditions also correspond to three different organs: leaf, berry, and flower. Given the incompleteness of sequenced mRNA across tissues and associated developmental stages, the grapevine expression atlas was considered.25 Based on the NimbleGen microarray platform capable of profiling > 95% of the predicted grapevine transcriptome. The grapevine atlas represents the most comprehensive (54 tissues) compendia of tissue x developmental gene expression series to date.
In the stress-related compendia, 17,623 genes (59% of transcriptome) were collectively modulated (|log2FC|>1, FDR < 0.05) across all the comparisons (Supplementary Table S4 and Supplementary Fig. S1). Abiotic stress treatments (drought and shading) modulated more than 5,000 genes in leaves and flowers, while biotic stress treatments (B. cinerea, E. necator, P. viticola, and Tetranychusurticae) modulated more than 4,000 genes collectively in berries and leaves. Previous work by Fasoli et al.25 revealed the grapevine atlas transcriptome relationships to be highly clustered according to their developmental indices, but did not identify the genes that are developmentally modulated in each tissue/organ. Meanwhile, reanalysis of grapevine atlas was performed to identify genes that are modulated during development and maturity progression. As expected, more than 85% (25,947 genes) of the predicted transcriptome is significantly modulated (|log2FC|>1, FDR < 0.05) across the whole atlas (excluding carpel, stamen, petal, pollen, seedling, and root). In organs such as berry (flesh, pericarp, and seed), tendril, stem, and buds more than 10,000 genes were modulated as development progresses while berry skin, rachis, leaf, and inflorescence had lesser modulated genes.
Several studies have shown that filtering for highly modulated genes, often within top 100 most modulated genes15 or having large (> 6-fold) fold changes,12 may be better suited for identifying major CREs driving expression under a particular condition. We empirically determined that the top 300 most up- and down-regulated genes would provide a reasonable threshold closely satisfying the large fold change requirements (Fig. 3A;Supplementary Fig. S2). These genes typically have a median fold change greater than 4- and 8-fold in the stress and development datasets, respectively. In addition, 10,847 and 8,224 unique genes were within top 300 up- and down-regulated genes in at least one stress and developmental condition, respectively, with an overlap of 5,601 genes that were within the 300 up- and down-regulated genes in both stress-responsive and developmental-dynamic condition.
Figure 3.

Summary of differential expression analysis and distribution patterns of CRE presence under stress and development conditions. (A) Boxplots depict the fold change distribution of all top 300 most differentially modulated (up-regulated and down-regulated) genes in S and D compendia. S, stress; D, development. (B) Boxplots depict the proportions of the genes (containing the respective CRE) that were highly responsive to either stress-responsive and/or development-dynamic (orange) or were non-responsive to the tested conditions (purple), for all 6-mer and 8-mer CRE. (C) Boxplots depict the proportions of the genes (containing the respective CRE) that were highly responsive to only stress-responsive (red), development-dynamic (blue), and both stress-responsive and development-dynamic (green).
For each 6-mer CRE, the proportion of the genes (containing the respective CRE) that were highly responsive to either stress-responsive and/or development-dynamic was analysed in detail. Considering all 6-mer CREs, their proportions had a median distribution of 46% (Fig. 3B); more specifically, a median distribution of 37% was considered only stress-responsive, 28% was only development-dynamic, while 19% was considered both stress-responsive and development-dynamic (Fig. 3C). Similar proportions were also observed for 8-mer CREs (Fig. 3B and C), albeit some outlier CREs show that genes containing the latter CREs were neither highly stress-responsive nor development-dynamic. Therefore, this suggests that the distribution of 6-mer to 8-mer CREs in gene promoters likely contributes to approximately half of the DE across the various abiotic, biotic stresses, and development comparisons evaluated. These analyses provided a basis for selecting genes for the construction of condition-specific GCNs in order to discover condition-specific 6–8-mer CRE-driven regulatory modules.
3.4. CRE-driven modules are biologically relevant in condition-specific GCNs
Two GCNs (one stress- and one development-specific) were constructed with gene expression matrices using the MR approach. Co-expression studies in many plants23 and in grapevine28–30,61 have shown that direct correlations (e.g. PCC) and rank-based co-expression (e.g. MR) can be used to infer co-expression relationships, albeit rank-based co-expression is generally more robust and is the most popular approach among crop GCNs.23 In addition, establishment of statistically significant reciprocal ranks, MR in this case, may further improve the robustness of the resulting GCN by retaining strong and significant co-expression.21 In the two datasets, we empirically chose a MR cut-off of 35 based on 1,000 permutations of each expression matrices, which corresponds to a statistical confidence of P < 0.003 and 0.005 for the surviving MR in the stress- and development-specific GCN, respectively. These network criteria are highly comparable to the parameters applied in other studies that define strong and significant co-expression. For example, GCNs constructed with MR < 50,19 statistical significance of reciprocal ranks with P < 0.01,21 or by retaining top 100 strongest connections.20 The final stress-specific GCN results in 10,800 nodes and 134,100 edges, while the final development-specific GCN consists of 8,224 nodes, 113,790 edges (Supplementary Tables S5 and S6). The number of connections for each node in the stress-specific GCN network ranges between 1 and 84, with a median of 21 connections, while the development-specific GCN ranged between 2 and 93, with a median of 24 connections.
Next, we adopted a recently proposed ‘bottom-up’ approach by Ma and co-workers13 to identify gene expression modules potentially driven by CREs of co-expressed genes. Using this approach, 245 and 289 CRE-driven modules (Supplementary Tables S7 and S8) in stress- and development-specific GCNs, respectively, were enriched (FDR < 0.05) with at least one MapMan BIN category (Supplementary Table S2). Although modular structures self-manifested in most CRE-driven modules,13 we applied community clustering to ensure robust final submodules.38 In total, 880 and 1,095 CRE-driven submodules were enriched (FDR < 0.05) in the stress and development-specific GCNs, respectively, with at least one MapMan BIN category (Supplementary Table S2). Interestingly, these enriched submodules corresponded to more ‘global’ CRE-driven modules, 293 and 314 for stress and development, respectively, demonstrating that CRE-driven submodules have higher predictive performance compared with interpreting ‘global’ CRE-driven modules as a whole. The biological relevance for some of these condition-specific CRE-driven submodules will be discussed in greater detail.
3.5. CACGTG enriched co-expression network is involved in ABA metabolism and light-related functions
The G-box (CACGTG) was found to be highly enriched for stress-responsive genes having scored a CF, Z-score, and FE of 2.7, 3.7, and 4.5, respectively. To investigate whether the enrichment observed has a biological relevance, a gene network was constructed for the stress dataset. A total of 842 genes composed a network comprising a total of 20 community clusters. Some of these clusters were significantly enriched with different MapMan BIN categories (Table 1). Focus is given to the core modules with bZIP and bHLH TFs since previous research has shown that the G-box CRE has been associated with the binding of these TFs.44,46 The presence of these TFs within the modules of the CACGTG network would suggest that the TFs contribute to the regulation of genes and processes pertaining to the selected module.
Table 1.
MapMan enrichment of selected G-box and GCC-core submodules in the stress dataset
| CRE | Module | x | n | k | P value | FDR | MapMan term |
|---|---|---|---|---|---|---|---|
| CACGTG (G-box) | I | 7 | 189 | 132 | 2.19E-05 | 1.48E-02 | Hormone metabolism.abscisic acid |
| II | 5 | 55 | 74 | 2.71E-07 | 3.68E-04 | Cell wall.pectin*esterases | |
| 5 | 55 | 114 | 2.31E-06 | 1.57E-03 | Misc.glutathione S transferases | ||
| 6 | 55 | 268 | 1.01E-05 | 3.43E-03 | Secondary metabolism.isoprenoids | ||
| III | 9 | 67 | 549 | 3.75E-06 | 5.09E-03 | Cell wall | |
| V | 5 | 57 | 181 | 2.55E-05 | 1.16E-02 | Secondary metabolism.phenylpropanoids | |
| VI | 7 | 163 | 145 | 1.56E-05 | 1.35E-02 | Hormone metabolism.ethylene | |
| VII | 3 | 7 | 389 | 7.61E-05 | 3.45E-02 | Secondary metabolism.flavonoids | |
| VIII | 3 | 5 | 498 | 4.66E-05 | 3.16E-02 | Stress.abiotic | |
| IX | 11 | 25 | 288 | 2.55E-16 | 6.92E-14 | Lipid metabolism.lipid degradation | |
| 16 | 25 | 1,448 | 1.43E-15 | 3.23E-13 | Signalling.receptor kinases | ||
| 8 | 25 | 1,111 | 2.28E-06 | 3.09E-04 | Stress.biotic | ||
| X | 6 | 143 | 8 | 3.29E-13 | 4.47E-10 | Lipid metabolism.TAG synthesis | |
| 3 | 143 | 18 | 8.54E-05 | 3.87E-02 | Development.late embryogenesis abundant | ||
| XII | 32 | 73 | 127 | 1.32E-57 | 8.99E-55 | PS.lightreaction | |
| 6 | 73 | 36 | 3.44E-10 | 5.83E-08 | PS.calvin cycle | ||
| GCC-core | I | 6 | 101 | 145 | 1.04E-05 | 5.19E-03 | Hormone metabolism.ethylene |
| II | 5 | 94 | 61 | 1.50E-06 | 2.15E-03 | RNA.regulation of transcription.WRKY | |
| 8 | 94 | 309 | 6.20E-06 | 4.44E-03 | RNA.regulation of transcription.AP2/ERF | ||
| III | 33 | 71 | 304 | 6.49E-47 | 3.10E-44 | Secondary metabolism.flavonoids | |
| 9 | 71 | 174 | 3.77E-10 | 7.71E-08 | Secondary metabolism.phenylpropanoids | ||
| V | 3 | 30 | 11 | 1.57E-07 | 5.61E-05 | Mitochondrial electron transport/ATP synthesis.cytochrome c | |
| VI | 8 | 27 | 1,016 | 2.25E-06 | 1.61E-03 | Signalling.receptor kinases |
x, overlap size; n, query size; and k, term size represent the contingency tables for MapMan enrichment calculations.
Module I (Fig. 4A and B) had a MapMan ontology enrichment pertaining to ABA metabolism. In this module six bZIPs and one bHLH were identified, of which one bZIP encodes the grapevine ABSCISIC ACID RESPONSE ELEMENT-BINDING FACTOR2 (VviABF2, VIT_18s0001g10450) involved in regulating berry ripening in an ABA-dependent manner.53 However, direct implication of VviABF2 in regulating stress response networks remains to be established. In Arabidopsis, previous research has shown that this homologous bZIP is involved in ABA mediated stress responses including drought.62 In the VviABF2 subnetwork (k = 2) of Module I (Fig. 4A), members of the ABA signaling pathway were immediately connected with VviABF2 including a homolog (VviABI1, VIT_11s0016g03180) of an Arabidopsis protein phosphatase 2C, ABA insensitive 1, an essential component of the ABA signaling network,63 and two homeodomain-leucine zipper TFs (VviHB7, VIT_15s0048g02870 and VviHB12, VIT_02s0025g02590), involved in the signal transduction pathways mediating growth in response to drought.64 In addition, VviABF2 might be involved indirectly (k = 2) in the regulation of a 9-cis-epoxycarotenoid dioxygenase 2 (VviNCED3, VIT_19s0093g00550), encoding the putative rate-limiting step of ABA biosynthesis, and a protein phosphatase 2C gene (VviPP2C9, VIT_06s0004g05460) involved in ABA signalling.63 To determine the involvement of this subnetwork in grapevine stress responses, meta-analysis of stress-related RNA-seq datasets described above was performed. Water deficit resulted in higher gene expression and greater up-regulation of module genes especially in leaves compared with berries (Fig. 4C). This observation is in agreement with the role of ABA metabolism and signaling in response to drought,63 while highlighting differences in ABA metabolism and signaling pathways that arise between organs.65,66
Figure 4.

A stress-specific G-box (CACGTG) submodule and the expression profile of submodule genes in different stress conditions and tissues. The color of the box in the submodule name corresponds to the color on the left of the gene expression heat map. The relative position of each submodule within stress-specific G-box submodule I (upper right of each subnetwork) is shown by the black circle. Submodule of (A) VviABF2 and (B) VviHYH as the ‘seed’ or ‘guide’ gene (k = 2). Circle and square nodes depict co-expressed gene and transcription factors, respectively. The red/gray-circle subnode depicts the presence of CRE in gene promoter. Node color depict assigned functions of genes involved in hormone signaling, hormone metabolism, DNA repair, electron transport/oxidative stress, chloroplast-related function, oxidative stress, phenylalanine and flavonoid metabolism, plastid import, and signaling. Edges indicate statically significant relationships (mutual rank < 35) between any two nodes. (C) Heat map showing significant and strong differential expression (up-regulation, red/light gray; down-regulation, blue/dark gray) of submodule genes in several stress conditions considering different tissues (See Supplementary Fig. S1A for descriptions).
Another bZIP gene in this module, encodes a grapevine HY5 HOMOLOGUE (VviHYH, VIT_05s0020g01090). Our recent work proposed that VviHYH may fulfil both co-operative and partially redundant roles with VviHY5 during both grapevine photomorphogenic growth, berry development, and under stress.29,67 Supporting this, many genes involved in light- and chloroplast-related functions were densely connected the VviHYH subnetwork (k = 2) of Module I (Fig. 4B). This includes electron transport pathway genes (e.g. NDHT, VIT_18s0117g00260 and PGR5, VIT_05s0049g01760), chlorophyll breakdown (e.g. ACD1/PAO, VIT_06s0004g00610), chloroplast-targeting (TIC55, VIT_04s0008g07020 and ANKYRIN REPEAT PROTEIN, VIT_04s0008g03840), DNA-damage repair (e.g. PHOTOLYASE 1/PHR1/UVR2, VIT_02s0241g00040 and CRY3, VIT_04s0008g02670), and light signaling (SUPPRESSOR OF PHYA 3/SPA3, VIT_12s0028g03570). In addition, genes involved in the glycosylation of flavonols—essential for enhancing their solubility in water and accumulation in plant cells68—namely VviGT5 (VIT_11s0052g01630) and VviGT6 (VIT_11s0052g01600), were connected with VviHYH within one and two steps, respectively. An Arabidopsis MYB-like domain TF homolog (VviMYBD, VIT_01s0026g01050), involved in the regulation of anthocyanin biosynthesis,69 was also co-regulated with VviHYH (k = 2). These observations reaffirm the involvement of VviHYH submodule genes in light-regulated transcriptional and secondary metabolism networks in a stress-related context. The strong presence of the G-box CRE may imply a co-operative role of other bZIP TFs in its regulation, such as HY5.51 This has been shown for VviGT5, which is up-regulated in a grape HY5 transient expression assay,29 although VviHYH might also be involved in VviGT5 regulation. Expression of module genes was largely down-regulated during the early stages (12–24 hours post-inoculation, hpi) of leaves infected with P. viticola and E. necator, spider-mites, as well as berries infected with B. cinerea at the late stages of berry development (Fig. 4C). This strong and rapid negative response to pathogen and pest attack supports the growing evidence of the involvement of light-regulated transcriptional networks, such as the VviHYH subnetwork, in plant–herbivore and plant–pathogen interactions.52
3.6. GCC-box network highlights pathogen response and signalling in stress dataset
Although individual CRE modules may reveal important biological insights, many CRE modules often overlap13 as underlying genes are shared between similar as well as distinct CRE modules. In the case of similar CREs, the canonical GCC-box sequence (GCCGCC), a well-known binding site for DREB and ERF subfamilies of AP2/ERFs TFs, mediates ethylene and jasmonate signaling in response to pathogens.43,55 Recent studies now show that GCC-related elements (GCCGTC and GCCGGC) are also CREs targeted by DREB and ERF TFs.5 In this study, GCC-box, and GCC-related CREs (GCCGTC and GCCGGC) were found to be enriched. GCNs were built for these CREs. Each of three CREs’ GCNs contained at least one module with an AP2/ERF TF: Modules I and VI for GCCGCC, Module II for GCCGTC, and Modules I, III, and IV for GCCGGC (Supplementary Table S7). Comparing those modules, the expression profiles of their genes were highly similar (Supplementary Fig. S3) and were enriched with genes pertaining to ethylene and jasmonate signaling. Furthermore, when comparing the genes involved in their networks, GCCGCC contained 82.9% unique genes, GCCGTC had 42.2% unique genes, and GCCGGC had 37.8% unique genes (Fig. 5A). Taking note of the similarity between these networks, a GCC core network (Fig. 5B) comprised of 428 genes was formed by merging the three mentioned networks. From the modules generated, two of them, Module I (Fig. 5C) and II (Fig. 5D) contained various combination of AP2/ERF CREs.
Figure 5.

Combined stress-specific GCC-box and related submodules and the expression profile of submodule genes in different stress conditions. The color of the box in the submodule name corresponds to the color on the left of the gene expression heat map. The position of each submodule within their corresponding module (lower or upper right of each subnetwork) is shown by the black circle. (A) Venn diagram representing the number of unique and shared genes between the GCCGCC, GCCGTC, and GCCGGC modules. (B) Visualization of the stress-specific GCC-core module, constructed through the integration of GCC-box and related CREs (GCCGCC, GCCGTC, and GCCGGC) modules. Submodule (C) I and (D) II of the stress-specific GCC-core module constructed using AP2/ERFs as the ‘seed’ or ‘guide’ genes. Circle and square nodes depict co-expressed gene and transcription factors, respectively. Circle subnode consisting of different blue/gray shades depicts the presence of the GCC-box and related CREs (GCCGCC, GCCGTC, and GCCGGC) in gene promoter. Node color depict assigned functions for genes involved in hormone signaling, pathogen signaling, pathogenesis related, signaling, detoxification, hormone metabolism, and phenylalanine and flavonoid metabolism. (E) Heat map showing significant and strong differential expression (up-regulation, red/light gray; down-regulation, blue/dark gray) of submodule genes in several stress conditions considering different tissues (see Supplementary Fig. S1A for descriptions).
In Module I, five predicted grapevine AP2/ERFs (VviERF106, VIT_15s0021g01630; VviERF107, VIT_16s0013g00890; VviERF127, VIT_07s0005g03220; VviERF132, VIT_14s0081g00730; VviERF1L2, VIT_07s0005g03230) were found (Fig. 5C), all of which are homologous to group IX (B-3) AP2/ERFs in Arabidopsis.70 Members of group IX (B-3) AP2/ERFs are widely implicated in pathogen responses in Arabidopsis.43 In this module, VviERF1L2 is directly co-expressed with several genes containing GCC-related CREs including one class I chitinase (VIT_07s0005g02560) which may fulfil basic defense-related roles in grapevine,71 an Arabidopsis homolog of 12-oxophytodienoate reductase (VviOPR1, VIT_18s0041g02070) involved in the detoxification of harmful oxylipins accumulated during pathogen attack or wounding and potentially JA biosynthesis,72 and a protein kinase gene (VIT_13s0019g01080) closely related to Arabidopsis BOTRYTIS-INDUCED KINASE173 involved in the signaling cascade for defense response against pathogens. Other basic defense-related genes such as a pathogenesis-related protein (VIT_05s0077g01690) containing a GCC-box CRE is connected with VviERF132. Phenylpropanoid pathway genes encoding stilbene synthases (VIT_10s0042g00850 and VIT_10s0042g00860) and a cinnamoyl-CoA reductase (VIT_14s0066g01150) involved in the biosynthesis of stilbene and lignin compounds implicated in grapevine biotic stress response,58,74 were directly connected with VviERF106 and VviERF127. One ethylene biosynthesis gene encoding 1-aminocyclopropane-1-carboxylic acid oxidase (VIT_12s0059g01380) was directly co-expressed with VviERF107. The gene expression profile of module genes involved in hormone biosynthesis (ethylene and JA), signalling, secondary metabolism, and transcriptional regulation, were induced by B. cinerea infection in berries (24 hpi), leaves upon herbivory attack by spider mite, and leaves with powdery mildew (5 days post-infection) in the susceptible genotype Carignan (Fig. 5E). This observation supports the participation of module genes and multiple GCC-related CREs in grapevine response to pathogens (necrotrophic and biotrophic) and insect herbivory, whereby activation of inducible defense mechanism via ethylene and JA pathways might confer basal defense against these biotic stressors.
In Module II, three AP2/ERF genes were present namely VviERF2 (VIT_02s0234g00130), VviERF017 (VIT_11s0016g00660), and VviRRTF1 (VIT_03s0063g00460), of group IX (B-3), II (A-5), and X (B-4), respectively.70 Compared with the previous module, this module had an enrichment pertaining to transcription regulation and signaling with respect to AP2/ERFs and WRKYs (Table 1). Three ERFs were selected as ‘seed’ or ‘guide’ ERFs to create a subnetwork, where VviERF2 is central, connecting all nodes within this subnetwork (Fig. 5D). The homologs of Arabidopsis WRKY33 (VviWRKY33, VIT_06s0004g07500) and WRKY40 (VviWRKY40, VIT_09s0018g00240) were directly connected with VviERF2. In Arabidopsis, WRKY33 modulates many hormonal and metabolic pathway genes, including AtERF2, and confers defense against B.cinerea.75 The presence of the GCC-box CRE in promoters of VviWRKY33 and direct connectivity with VviERF2 highlights a potential conserved regulation with that of Arabidopsis, where VviWRKY33 might be a target of VviERF2 in grapevines. Arabidopsis WRKY40 also contributes to broad resistance against necrotrophs, biotrophs, and hemibiotrophs, through the modulation of JA and SA crosstalk when facing different pathogen lifestyles.76 In addition, a NAC TF gene homologous to Arabidopsis ATAF1 (ATAF1, VIT_07s0031g02610), was directly connected with VviERF2. Arabidopsis ATAF1 is involved in both JA and ABA crosstalk and has dual roles in abiotic and biotic stress.77 Together, the co-expression network surrounding VviERF2, VviERF017, and VviRRTF1, may be implicated in hormonal crosstalk during plant immune response and abiotic stress through cooperative action with WRKY and NAC TFs. Both abiotic and biotic transcriptional networks are known to be mediated by AP2/ERF, WRKY, and NAC TFs regulons in plants.6,78 One pathogen-related secretory pathway gene encoding grapevine PENETRATION1 (VviPEN1, VIT_08s0032g01150) was directly co-expressed with VviERF2 and VviRRTF1. The PEN1-mediated secretory pathway is an important defense strategy against powdery mildew, mediating penetration resistance.79 The gene expression profile of the GCC module II subnetwork is similar to module I, concordant with the role of module genes involved in immunity against necrotrophs as observed in Arabidopsis (Fig. 5E). Striking differences were observed especially in grapevine leaves infected with P. viticola, as many module genes were down-regulated, potentially highlighting antagonism between JA and SA signaling pathway. Down-regulation of JA signaling might alleviate repression of SA signaling, and activate early defense-related pathways during P. viticola interaction.71 In addition, module genes may play a role in the regulation of signaling pathways for flower abscission, as module genes were largely down-regulated by gibberellic acid treated flowers but up-regulated in shaded ones. Therefore, comparison of module I and II of the GCC network may reveal different aspects of transcriptional networks targeted by GCC-box and related sequences, such as the activation of defense mechanisms or the modulation of hormone signaling.
3.7. Different cell wall remodelling genes are enriched in subnetworks of the CCWACC development-specific network
Differences in biological function enrichments were also observed for many CRE submodules constructed from the developmental and stress-specific GCNs. For example, CCWACC commonly referred to as an AC-element, is one of the three main R2R3-MYB binding sites.10 It showed bona fide CRE properties (CF 1.90, Z-score 3.61, and FE 1.86 in stress-responsive, and CF 1.87, Z-score 3.10, and FE 1.87 in development-dynamic genes), and was highly enriched for biological functions in both sets of genes. However, in the developmental dataset greater enrichment for biological pathways, especially cell wall metabolism, was observed compared with stress. Therefore, focus will be given to the development-specific CCWACC network.
Two modules in the CCWACC network were enriched with distinct cell wall remodeling gene families (Table 2). The Module I (Fig. 6A) contained genes related to primary cell wall-related functions, while the Module VI (Fig. 6B) contained genes related to secondary cell wall metabolism. One MYB gene in module I (VviMYB91A, VIT_08s0007g00410) encodes an orthologue of Arabidopsis MYB91/ASYMETRIC LEAVES 1.80 In Arabidopsis, MYB91/ASYMETRIC LEAVES 1 regulates the development of several vegetative and reproductive organs including leaves and flowers.80 Additionally, a SQUAMOSA PROMOTER-BINDING PROTEIN 8 gene (VviSPL8, VIT_15s0021g02300), shown to regulate the floral and seed development in Arabidopsis,81 was directly connected to VviMYB91A. Many cell wall remodelling genes involved in degradation and modification containing CCWACC CREs in their promoter were also present, indirectly and directly connected to VviMYB91A and VviSPL8, respectively. Examples include one gene encoding expansin B (VviEXPB2, VIT_12s0059g00190), pectin methylesterase (VviPME3, VIT_03s0017g01950), two predicted polygalacturonases (VviPG, VIT_05s0020g00420 and VIT_15s0046g02000), and orthologues of Arabidopsis Beta-d-xylosidase 4 (VviXYL4, VIT_12s0055g01180 and VIT_12s0121g00230). Module genes were highly expressed during the early growth stages and decreased during development of various vegetative (e.g. rachis, tendril, leaf, stem, and seedling) and in reproductive (e.g. inflorescence, flowering, berry skin, and seed) organs (Fig. 6D). This observation reveals a strong coordinated regulation of module genes and TFs (e.g. VviMYB91A and VviSPL8) which might be critical for precise growth control during early stages of development.
Table 2.
MapMan enrichment of selected MYB and GLK submodules in the development dataset
| CRE | Module | x | n | k | P value | FDR | Mapman term |
|---|---|---|---|---|---|---|---|
| CCWACC (MYB) | I | 6 | 87 | 170 | 1.09E-05 | 3.71E-03 | Cell wall.degradation |
| II | 5 | 17 | 288 | 4.78E-07 | 1.30E-04 | Lipid metabolism.lipid degradation | |
| 7 | 17 | 1,448 | 8.11E-06 | 1.57E-03 | Signalling.receptor kinases | ||
| V | 2 | 34 | 6 | 1.94E-05 | 2.63E-02 | Hormone metabolism.jasmonate | |
| VI | 6 | 43 | 20 | 2.58E-13 | 1.17E-10 | Cell wall.hemicellulose synthesis | |
| 5 | 43 | 98 | 3.15E-07 | 1.07E-04 | Cell wall.cellulose synthesis | ||
| 3 | 43 | 47 | 4.44E-05 | 1.21E-02 | Cell wall.cell wall proteins | ||
| VII | 7 | 15 | 498 | 2.15E-09 | 1.46E-06 | Stress.abiotic | |
| VIII | 9 | 9 | 268 | 3.77E-19 | 5.12E-16 | Secondary metabolism.isoprenoids | |
| IX | 30 | 78 | 389 | 2.66E-36 | 9.04E-34 | Secondary metabolism.flavonoids | |
| 21 | 78 | 181 | 4.47E-29 | 8.67E-27 | Secondary metabolism.phenylpropanoids | ||
| X | 3 | 6 | 512 | 9.94E-05 | 4.50E-02 | DNA | |
| XV | 2 | 5 | 8 | 6.46E-07 | 8.78E-04 | Lipid metabolism.TAG synthesis | |
| AGATTCT | I | 7 | 15 | 127 | 1.47E-13 | 9.98E-11 | PS.lightreaction |
| II | 5 | 21 | 127 | 2.63E-08 | 1.79E-05 | PS.lightreaction |
x, overlap size; n, query size; and k, term size represent the contingency tables for MapMan enrichment calculations.
Figure 6.

Development-specific submodules extracted from AC-element (CCWACC) and AGATTCT CRE modules, and the expression profile of submodule genes in different tissues and developmental stages. The color from the submodule name corresponds to the color on the left of the gene expression heat map. The position of each submodule within their corresponding CRE’s network module (upper right of each subnetwork) is shown by the black circle. Development-specific (A) G-box, (B) AC-element, and (C) GLK1 motif submodule extracted using bZIP, R2R3 MYB, and GLK1 genes as ‘seed’ or ‘guide’ genes, respectively. Descriptions for nodes (circle and square), circle subnodes, and edges are the same with Fig. 4A and B. Node color depict assigned functions for genes involved in general cell wall metabolism, cell wall signaling, secondary cell wall-specific metabolism, and photosynthesis. (D) Heat map depicts the gene expression (row Z-score normalized) of submodule genes in various tissues and across multiple developmental stages (see Supplementary Fig. S1B for descriptions).
Module VI contained a homolog of Arabidopsis MYB83 (VviMYB185, VIT_06s0004g02110), which is widely implicated in the regulation of secondary cell wall biosynthesis components.82 Accordingly, genes directly connected to VviMYB185 are widely implicated in secondary cell wall biosynthesis and deposition. These include a fasciclin arabinogalactan-protein (VviFLA11, VIT_06s0004g03050), a glucuronyltransferase (VviGUX2, VIT_18s0001g10580), a galacturonosyltransferase (VviGAUT12, VIT_19s0014g05130), a COBRA protein (VviCOBL4, VIT_14s0083g01150), one cellulose synthase (VviCESA8, VIT_10s0003g01560), and two laccase (VviLAC17, VIT_13s0019g01920, VIT_13s0019g02160) genes. Interestingly, one NAC TF (VviNST1, VIT_02s0025g02710), homolog to Arabidopsis NST1, was directly connected with VviMYB185. In Arabidopsis, both NST1 and MYB83 are master switches for secondary cell wall development, albeit NST1 function as the primary master switch while MYB83 is downstream in the hierarchy.83 Meanwhile, an additional battery of secondary cell wall-related genes indirectly connected with VviMYB185 encoding a cellulose synthase (VviCESA7, VIT_11s0037g00530), a laccase (VviLAC4, VIT_06s0004g06090), a galacturonosyltransferase-like protein (VviGATL1, VIT_04s0023g01120), a beta-xylosidase (VviBXL1, VIT_05s0077g01280), and two xylan synthases (VviIRX9, VIT_08s0040g02340) contain CCWACC CRE in their promoters. The latter genes may also be potential regulatory targets of VviMYB185 or of other R2R3-MYBs. Supporting this idea, many secondary cell wall genes in Arabidopsis that are present in the VviMYB185 network are known to be regulated by R2R3-MYB TFs (including MYB83) through the AC-element and related sequences.83,84 Compared with Module I of the developmental CCWACC network, this module’s activation was mainly present at the early development stages of the seed, rachis, and stem, and in the late stages of the inflorescence and tendrils (Fig. 6D). The difference in cell wall metabolism pathway enrichment is not limited to the CCWACC network, but to other developmental submodules that are potentially regulated by ARF (TGTCGG and TGTCGA),5,11 NAC (TTGCGT and TTCCTT),85 and AP2/ERF (ACCGACA).6,43
3.8. AGATTCT developmental network module is specifically enriched in photosynthesis-related genes
Although CREs and CRE-driven subnetworks, such as those previously discussed, show that strong positional bias towards the TSS and FE scores provide reasonable proxies for identifying bona fide CREs and biologically relevant modules, some CREs and CRE-driven subnetworks lack these properties. For example, the 7-mer CRE AGATTCT (CF 2.69, Z-score 0.13, and FE 6.91 in the developmental dataset), whose network contains a G2-like TF. DNA-binding specificities of lesser known plant TF families such as G2-like, a subclass of GARP proteins, have been recently characterized.5 The G2-like TF, GLK, is implicated in photosynthesis and chloroplast development in many plants86 and is a key factor regulating the latitudinal gradient of ripening87 and various quality traits in fruits.88 Arabidopsis GLK1 recognizes the AGATTCT CRE sequence.5 The AGATTCT network in the developmental dataset contained 113 genes and was highly enriched for many photosynthesis-related genes, especially in modules I and II (Table 2) suggesting that GLK-regulated gene networks are highly conserved across plants including grapevine. Present in module I (Fig. 6C) are VviGLK1, the homolog of Arabidopsis GLK1 (VviGLK1, VIT_12s0028g03100), and its likely target genes which encode for photosystem I polypeptide subunits (VviPSAN, VIT_04s0044g01410; VviPSAF, VIT_00s0125g00280; VviPSAD-2, VIT_05s0020g03180) and light harvesting complexes (VviCAB1-1, VIT_10s0003g02890; VviCAB1-2, VIT_10s0003g02900; VviLHB6, VIT_12s0055g01110). One gene involved in cellular redox homeostasis (VviCDSP32, VIT_18s0001g00820) was also implicated in this module. The expression survey across the developmental dataset revealed that module I genes are highly expressed in immature organs of the berry pericarp, flesh, skin, and seed, as well as in rachis, buds, and leaves, and gradually decrease their expression as development of each organ progresses (Fig. 6D). Therefore, the consistent down-regulation of module genes may reflect an active role of photosynthetic genes and VviGLK1 in the immature-to-mature phase transition of grapevine organs, similar to the observations in other plants.86 Additionally in grape berries, these module genes may be critical for the establishment of differing ripening gradients during the onset of ripening, as seen with the role of GLK1 in tomatoes.87,88
3.9. Comparison between grapevine and Arabidopsis motif-driven GCNs
Compared with other plants, CRE-driven GCNs have only been elucidated in Arabidopsis; several of which include the G-box, MYB (CCWACC), WRKY (KTTGACY), and the site II element (TGGGCY) CRE modules.13 Based on the conserved G-box and CCWACC CRE, which are also evaluated in this study, many enriched (GO enrichment) biological pathways in Arabidopsis are shared with those identified in this study. For example, highly enriched terms related to photosynthesis, hormone (ethylene and ABA) metabolism, and stress responses were common in G-box CRE modules between grapevine (Supplementary Table S3) and Arabidopsis.13 Similarly, secondary metabolic pathways, especially related to flavonoid and phenylpropanoid metabolism, cell wall, and stress responses, were common for the CCWACC (MYB) CRE module. To determine if other grapevine CRE modules harbor unique and/or common features at a larger scale, we expanded the search in Arabidopsis by constructing CRE modules (P < 0.01) using the Arabidopsis graphical Gaussian model gene network with a partial correlation threshold > 0.05 (Ma et al.13) (Supplementary Table S9). We then determined their biological pathway (Mapman) enrichment profiles (Supplementary Table S10) and performed the comparison with CRE modules from grapevine. In addition to the G-box and CCWACC CRE, some grapevine CRE modules share a high degree of similar gene enrichments with Arabidopsis CRE modules which includes ACGTGKC (ABRE), TGTCGG, TTTCCCGC, and YAACKG (MYB) (Supplementary Table S10), suggesting similar properties of gene expression and gene networks between grapevine and Arabidopsis. However, others share a small proportion of enriched pathways and/or have entirely unique enriched terms such as GCCGCC, RCCGAC, TGACGTG (bZIP), TTGACC (W-box), TGTCGA, TGTCTC, TTGCGT (NAC), and TTCCTT (NAC) (Supplementary Table S10). For example, enriched terms in the Arabidopsis GCC-box CRE modules include biotic stress and ATP synthesis. In comparison, the grapevine stress-dependent GCC-box CRE modules share enrichment for ATP synthesis but have unique enriched terms related to hormone signaling—jasmonate and ethylene, TF regulation, and flavonoid and phenylpropanoid metabolism. Similarly, CRE modules such as DRE (A/GCCGAC) conserved between Arabidopsis and grapevine share enrichment profiles for galactinol/raffinose metabolism but differ in specific cell wall metabolic processes, hormone metabolism, and stress responses. Unique enrichment profiles for the grapevine DRE module include lipid metabolism and photosynthesis. These differences might indicate potential diversification of utilized CREs between grapevine and Arabidopsis that maintain the enriched CRE modules but with differing biological functions. Nonetheless, parameters used to construct the respective CRE modules which include different underlying experimental conditions, correlation metrics, and CRE P-value threshold may also introduce differences.
Comparative expression analysis of grapevine genes (assigned to CRE modules) with corresponding Arabidopsis orthologues may also reveal potential similarities and differences in expression dynamics between species. Genes of selected CRE modules such as G-box and GCC-core modules were further evaluated considering the responses of their putative Arabidopsis orthologues under similar and additional treatments (Supplementary Table S11). For example, 123 (of the 189) genes in the grapevine stress-specific G-box module I have predicted Arabidopsis orthologues. Arabidopsis orthologues for these genes are largely induced in various abiotic stress conditions especially cold, osmotic stress, and salt, but also to UV-B, drought, and heat stress albeit at a lesser extent (Supplementary Table S11A). Biotic stress pathways are also highly modulated in the G-box module I of Arabidopsis and a greater proportion of orthologues are down-regulated against different biotic stress including B. cinerea and powdery mildew, as seen in grapevine (Supplementary Table S11B). In addition, in module I (Supplementary Table S11C) and II (Supplementary Table S11D) of the stress-specific GCC-core module, there are 47 (of 102) and 66 (of 94) grapevine genes which have Arabidopsis orthologues, respectively. Like grapevine, Arabidopsis orthologues for these genes were highly induced upon a wide variety elicitors and plant–pathogen treatments. Although similar gene expression responses were observed for B. cinerea and powdery mildew infection for grapevine and Arabidopsis, an opposite response (induction) was observed for Arabidopsis infection with H. arabidopsidis, the causal agent of downy mildew (Supplementary Table S11C and D), compared with grapevine (Fig. 5E). This highlights potential differences in the transcriptional networks of plant immunity employed by the two species that may involve differing CRE regulation. Nonetheless, the strong and consistent modulation of gene orthologues of CRE modules between grapevine and Arabidopsis suggest a general conservation in promoter architecture, gene expression dynamics, and gene regulatory networks.
4. Conclusion
In this study, we have elucidated the properties of a large selection of known plant CREs in grapevine promoters at the genome-scale. We observed that many CREs fulfill the widely-adopted criterions defining authentic plant CREs. We corroborated these findings through extensive biological pathway enrichment analysis suggesting the characterized CRE structure has strong biological relevance. Together, these assessments have elucidated many potential targets of a large repertoire of grapevine TFs for the first time. Large-scale transcriptome analysis using the developmental atlas dataset and a selection of stress-related RNA-seq datasets demonstrated that the distribution of CREs in gene promoters explains close to half of the DE across the various abiotic and biotic stresses, and developmental comparisons evaluated. However, several exceptions exist where well-characterized plant CREs does not possess authentic CRE properties and/or strong enrichment, highlighting the potential diversification of CREs in grapevine promoters and divergence of transcriptional regulatory pathways. Therefore, additional scanning approaches or other statistical models, such as scans using position weight matrices or all possible k-mer nucleotide combinations, might be necessary to capture the full spectrum of grapevine CREs and their biological functions. Nonetheless, by integrating condition-specific GCN, CRE enrichment, and gene expression profiles, numerous condition-specific CRE-driven modules (and submodules) were discovered, providing additional information on the coordinated regulation of submodule genes. Although some of these genes may not contain the given CRE, they are implicated in similar functions, specificity of stress responses, and/or gene expression pattern in tissues/organs within and between CRE-driven submodules. This integrated approach uncovered biologically meaningful submodules in a more robust fashion than just utilizing the distribution of CREs alone. This is exemplified by the modules that corroborated known roles in drought response, pathogen defense, cell wall metabolism, and fruit ripening in grapevine and in other plant species. Some modules reveal novel regulatory functions, although further functional validation will be necessary to confirm the transcriptional control exerted by the large TF repertoire in grapevines. Application of these approaches is not just limited to grapevines but to other sequenced plant genomes, especially crop species,89–91 permitting a greater understanding of the evolution and conservation of plant CREs and transcriptional regulatory pathways.
Supplementary Material
Acknowledgements
We thank the grapevine research community for making various RNA-seq and microarray datasets publicly available.
Conflict of interest
None declared.
Supplementary data
Supplementary data are available at www.dnaresearch.oxfordjournals.org.
Funding
This study was funded by the University of British Columbia (10R18459), Genome British Columbia (10R21188), and the Natural Sciences and Engineering Research Council of Canada (10R23082).
References
- 1. Jin J., Zhang H., Kong L., Gao G., Luo J.. 2014, PlantTFDB 3.0: a portal for the functional and evolutionary study of plant transcription factors. Nucleic Acids Res., 42, 1182–7. [DOI] [PMC free article] [PubMed] [Google Scholar]
- 2. Riechmann J. L., Ratcliffe O. J.. 2000, A genomic perspective on plant transcription factors. Curr. Opin. Plant Biol., 3, 423–34. [DOI] [PubMed] [Google Scholar]
- 3. Higo K., Ugawa Y., Iwamoto M., Korenaga T.. 1999, Plant cis-acting regulatory DNA elements (PLACE) database: 1999. Nucleic Acids Res., 27, 297–300. [DOI] [PMC free article] [PubMed] [Google Scholar]
- 4. Yilmaz A., Mejia-Guerra M. K., Kurz K., Liang X., Welch L., Grotewold E.. 2011, AGRIS: the arabidopsis gene regulatory information server, an update. Nucleic Acids Res., 39, D1118–22. [DOI] [PMC free article] [PubMed] [Google Scholar]
- 5. Franco-Zorrilla J. M., López-Vidriero I., Carrasco J. L., Godoy M., Vera P., Solano R.. 2014, DNA-binding specificities of plant transcription factors and their potential to define target genes. Proc. Natl. Acad. Sci. U. S. A., 111, 2367–72. [DOI] [PMC free article] [PubMed] [Google Scholar]
- 6. Yamaguchi-Shinozaki K., Shinozaki K.. 2006, Transcriptional regulatory networks in cellular responses and tolerance to dehydration and cold stresses. Annu. Rev. Plant Biol., 57, 781–803. [DOI] [PubMed] [Google Scholar]
- 7. Gramzow L., Theissen G.. 2010, A hitchhiker’s guide to the MADS world of plants. Genome Biol., 11, 214. [DOI] [PMC free article] [PubMed] [Google Scholar]
- 8. Chandler J. W. 2016, Auxin response factors. Plant. Cell Environ., 39, 1014–28. [DOI] [PubMed] [Google Scholar]
- 9. Vandepoele K., Vlieghe K., Florquin K., et al. 2005, Genome-wide identification of potential plant E2F target genes. Plant Physiol., 139, 316–28. [DOI] [PMC free article] [PubMed] [Google Scholar]
- 10. Prouse M. B., Campbell M. M.. 2012, The interaction between MYB proteins and their target DNA binding sites. Biochim. Biophys. Acta – Gene Regul. Mech., 1819, 67–77. [DOI] [PubMed] [Google Scholar]
- 11. Boer D. R., Freire-Rios A., Van Den Berg W. A. M., et al. 2014, Structural basis for DNA binding specificity by the auxin-dependent ARF transcription factors. Cell, 156, 577–89. [DOI] [PubMed] [Google Scholar]
- 12. Zou C., Sun K., Mackaluso J. D., et al. 2011, Cis-regulatory code of stress-responsive transcription in Arabidopsis thaliana. Proc. Natl. Acad. Sci. U. S. A., 108, 14992–7. [DOI] [PMC free article] [PubMed] [Google Scholar]
- 13. Ma S., Shah S., Bohnert H. J., Snyder M., Dinesh-Kumar S. P.. 2013, Incorporating motif analysis into gene co-expression networks reveals novel modular expression pattern and new signaling pathways. PLoS Genet., 9, e1003840. [DOI] [PMC free article] [PubMed] [Google Scholar]
- 14. Vandepoele K., Quimbaya M., Casneuf T., De Veylder L., Van de Peer Y.. 2009, Unraveling transcriptional control in Arabidopsis using cis-regulatory elements and coexpression networks. Plant Physiol., 150, 535–46. [DOI] [PMC free article] [PubMed] [Google Scholar]
- 15. Maruyama K., Todaka D., Mizoi J., et al. 2012, Identification of cis-acting promoter elements in cold- and dehydration-induced transcriptional pathways in Arabidopsis, Rice, and Soybean. DNA Res., 19, 37–49. [DOI] [PMC free article] [PubMed] [Google Scholar]
- 16. Ding J., Hu H., Li X.. 2012, Thousands of cis-regulatory sequence combinations are shared by Arabidopsis and Poplar. Plant Physiol., 158, 145–55. [DOI] [PMC free article] [PubMed] [Google Scholar]
- 17. Yamamoto Y. Y., Ichida H., Matsui M., et al. 2007, Identification of plant promoter constituents by analysis of local distribution of short sequences. BMC Genomics, 8, 67. [DOI] [PMC free article] [PubMed] [Google Scholar]
- 18. FitzGerald P. C., Shlyakhtenko A., Mir A. A., Vinson C.. 2004, Clustering of DNA sequences in human promoters. Genome Res., 14, 1562–74. [DOI] [PMC free article] [PubMed] [Google Scholar]
- 19. Obayashi T., Nishida K., Kasahara K., Kinoshita K.. 2011, ATTED-II updates: condition-specific gene coexpression to extend coexpression analyses and applications to a broad range of flowering plants. Plant Cell Physiol., 52, 213–9. [DOI] [PMC free article] [PubMed] [Google Scholar]
- 20. Aoki Y., Okamura Y., Tadaka S., Kinoshita K., Obayashi T.. 2016, ATTED-II in 2016: a plant coexpression database towards lineage-specific coexpression. Plant Cell Physiol., 57, e5. [DOI] [PMC free article] [PubMed] [Google Scholar]
- 21. Mutwil M., Klie S., Tohge T., et al. 2011, PlaNet: combined sequence and expression comparisons across plant networks derived from seven species. Plant Cell, 23, 895–910. [DOI] [PMC free article] [PubMed] [Google Scholar]
- 22. Higashi Y., Saito K.. 2013, Network analysis for gene discovery in plant-specialized metabolism. Plant. Cell Environ., 36, 1597–606. [DOI] [PubMed] [Google Scholar]
- 23. Lee T., Kim H., Lee I.. 2015, Network-assisted crop systems genetics: network inference and integrative analysis. Curr. Opin. Plant Biol., 24, 61–70. [DOI] [PubMed] [Google Scholar]
- 24. Jaillon O., Aury J.-M., Noel B., et al. 2007, The grapevine genome sequence suggests ancestral hexaploidization in major angiosperm phyla. Nature, 449, 463–7. [DOI] [PubMed] [Google Scholar]
- 25. Fasoli M., Dal Santo S., Zenoni S., et al. 2012, The grapevine expression atlas reveals a deep transcriptome shift driving the entire plant into a maturation program. Plant Cell, 24, 3489–505. [DOI] [PMC free article] [PubMed] [Google Scholar]
- 26. Palumbo M. C., Zenoni S., Fasoli M., et al. 2014, Integrated network analysis identifies fight-club nodes as a class of hubs encompassing key putative switch genes that induce major transcriptome reprogramming during grapevine development. Plant Cell Online, 26, 4617–35. [DOI] [PMC free article] [PubMed] [Google Scholar]
- 27. Dal Santo S., Tornielli G. B., Zenoni S., et al. 2013, The plasticity of the grapevine berry transcriptome. Genome Biol., 14, r54. [DOI] [PMC free article] [PubMed] [Google Scholar]
- 28. Malacarne G., Coller E., Czemmel S., et al. 2016, The grapevine VvibZIPC22 transcription factor is involved in the regulation of flavonoid biosynthesis. J. Exp. Bot., 67, 3509–22. [DOI] [PMC free article] [PubMed] [Google Scholar]
- 29. Loyola R., Herrera D., Mas A., et al. 2016, The photomorphogenic factors UV-B RECEPTOR 1, ELONGATED HYPOCOTYL 5, and HY5 HOMOLOGUE are part of the UV-B signalling pathway in grapevine and mediate flavonol accumulation in response to the environment. J. Exp. Bot., 67, 5429–5445. [DOI] [PMC free article] [PubMed] [Google Scholar]
- 30. Wong D. C. J., Schlechter R., Vannozzi A., et al. 2016, A systems-oriented analysis of the grapevine R2R3-MYB transcription factor family uncovers new insights into the regulation of stilbene accumulation. DNA Res., 23, 451–466. [DOI] [PMC free article] [PubMed] [Google Scholar]
- 31. Savoi S., Wong D. C. J., Arapitsas P., et al. 2016, Transcriptome and metabolite profiling reveals that prolonged drought modulates the phenylpropanoid and terpenoid pathway in white grapes (Vitis vinifera L.). BMC Plant Biol., 16, 67. [DOI] [PMC free article] [PubMed] [Google Scholar]
- 32. Wong D. C. J., Lopez Gutierrez R., Dimopoulos N., Gambetta G. A., Castellarin S. D.. 2016, Combined physiological, transcriptome, and cis-regulatory element analyses indicate that key aspects of ripening, metabolism, and transcriptional program in grapes (Vitis vinifera L.) are differentially modulated accordingly to fruit size. BMC Genomics, 17, 416. [DOI] [PMC free article] [PubMed] [Google Scholar]
- 33. Bolger A. M., Lohse M., Usadel B.. 2014, Trimmomatic: a flexible trimmer for illumina sequence data. Bioinformatics, 30, 2114–20. [DOI] [PMC free article] [PubMed] [Google Scholar]
- 34. Langmead B., Salzberg S. L.. 2012, Fast gapped-read alignment with Bowtie 2. Nat. Methods, 9, 357–9. [DOI] [PMC free article] [PubMed] [Google Scholar]
- 35. Anders S., Pyl P. T., Huber W.. 2014, HTSeq a python framework to work with high-throughput sequencing data. Bioinformatics, 31, 166–9. [DOI] [PMC free article] [PubMed] [Google Scholar]
- 36. Love M. I., Huber W., Anders S.. 2014, Moderated estimation of fold change and dispersion for RNA-seq data with DESeq2. Genome Biol., 15, 550. [DOI] [PMC free article] [PubMed] [Google Scholar]
- 37. Ritchie M. E., Phipson B., Wu D., et al. 2015, Limma powers differential expression analyses for RNA-sequencing and microarray studies. Nucleic Acids Res., 43, e47. [DOI] [PMC free article] [PubMed] [Google Scholar]
- 38. Newman M. E. J., Girvan M.. 2004, Finding and evaluating community structure in networks. Phys. Rev. E – Stat. Nonlinear, Soft Matter Phys., 69, 1–15. [DOI] [PubMed] [Google Scholar]
- 39. Thimm O., Bläsing O., Gibon Y., et al. 2004, MAPMAN: a user-driven tool to display genomics data sets onto diagrams of metabolic pathways and other biological processes. Plant J., 37, 914–39. [DOI] [PubMed] [Google Scholar]
- 40. Shannon P., Markiel A., Ozier O., et al. 2003, Cytoscape: a software environment for integrated models of biomolecular interaction networks. Genome Res., 13, 2498–504. [DOI] [PMC free article] [PubMed] [Google Scholar]
- 41. Morey C., Mookherjee S., Rajasekaran G., Bansal M.. 2011, DNA free energy-based promoter prediction and comparative analysis of Arabidopsis and Rice genomes. Plant Physiol., 156, 1300–15. [DOI] [PMC free article] [PubMed] [Google Scholar]
- 42. Ulmasov T., Hagen G., Guilfoyle T. J.. 1997, ARF1, a transcription factor that binds to auxin response elements. Science, 276, 1865–8. [DOI] [PubMed] [Google Scholar]
- 43. Licausi F., Ohme-Takagi M., Perata P.. 2013, APETALA2/Ethylene Responsive Factor (AP2/ERF) transcription factors: mediators of stress responses and developmental programs. New Phytol., 199, 639–49. [DOI] [PubMed] [Google Scholar]
- 44. Jakoby M., Weisshaar B., Dröge-Laser W., et al. 2002, bZIP transcription factors in Arabidopsis. Trends Plant Sci., 7, 106–11. [DOI] [PubMed] [Google Scholar]
- 45. Leivar P., Monte E.. 2014, PIFs: systems integrators in plant development. Plant Cell, 26, 56–78. [DOI] [PMC free article] [PubMed] [Google Scholar]
- 46. Carretero-Paulet L., Galstyan A., Roig-Villanova I., Martínez-García J. F., Bilbao-Castro J. R., Robertson D. L.. 2010, Genome-wide classification and evolutionary analysis of the bHLH family of transcription factors in Arabidopsis, poplar, rice, moss, and algae. Plant Physiol., 153, 1398–412. [DOI] [PMC free article] [PubMed] [Google Scholar]
- 47. Yang T., Poovaiah B. W.. 2002, A calmodulin-binding/CGCG box DNA-binding protein family involved in multiple signaling pathways in plants. J. Biol. Chem., 277, 45049–58. [DOI] [PubMed] [Google Scholar]
- 48. Nagel D. H., Doherty C. J., Pruneda-Paz J. L., Schmitz R. J., Ecker J. R., Kay S. A.. 2015, Genome-wide identification of CCA1 targets uncovers an expanded clock network in Arabidopsis. Proc. Natl. Acad. Sci. U. S. A., 112, E4802–10. [DOI] [PMC free article] [PubMed] [Google Scholar]
- 49. Klie S., Nikoloski Z.. 2012, The choice between MapMan and Gene ontology for automated gene function prediction in plant science. Front. Genet., 3, 1–14. [DOI] [PMC free article] [PubMed] [Google Scholar]
- 50. Ziliotto F., Corso M., Rizzini F. M., Rasori A., Botton A., Bonghi C.. 2012, Grape berry ripening delay induced by a pre-véraison NAA treatment is paralleled by a shift in the expression pattern of auxin- and ethylene-related genes. BMC Plant Biol., 12, 185. [DOI] [PMC free article] [PubMed] [Google Scholar]
- 51. Jiao Y., Lau O. S., Deng X. W.. 2007, Light-regulated transcriptional networks in higher plants. Nat. Rev. Genet., 8, 217–30. [DOI] [PubMed] [Google Scholar]
- 52. Heijde M., Ulm R.. 2012, UV-B photoreceptor-mediated signalling in plants. Trends Plant Sci., 17, 230–7. [DOI] [PubMed] [Google Scholar]
- 53. Nicolas P., Lecourieux D., Kappel C., et al. 2013, The basic leucine zipper transcription factor ABSCISIC ACID RESPONSE ELEMENT-BINDING FACTOR2 is an important transcriptional regulator of abscisic acid-dependent grape berry ripening processes. Plant Physiol., 164, 365–83. [DOI] [PMC free article] [PubMed] [Google Scholar]
- 54. Hichri I., Heppel S. C., Pillet J., et al. 2010, The basic helix-loop-helix transcription factor MYC1 is involved in the regulation of the flavonoid biosynthesis pathway in grapevine. Mol. Plant, 3, 509–23. [DOI] [PubMed] [Google Scholar]
- 55. Tsuda K., Somssich I. E.. 2015, Transcriptional networks in plant immunity. New Phytol., 206, 932–47. [DOI] [PubMed] [Google Scholar]
- 56. Greenham K., McClung C. R.. 2015, Integrating circadian dynamics with physiological processes in plants. Nat. Rev. Genet., 16, 598–610. [DOI] [PubMed] [Google Scholar]
- 57. Vranová E., Coman D., Gruissem W.. 2013, Network analysis of the MVA and MEP pathways for isoprenoid synthesis. Annu. Rev. Plant Biol., 64, 665–700. [DOI] [PubMed] [Google Scholar]
- 58. Vannozzi A., Dry I. B., Fasoli M., Zenoni S., Lucchin M.. 2012, Genome-wide analysis of the grapevine stilbene synthase multigenic family: genomic organization and expression profiles upon biotic and abiotic stresses. BMC Plant Biol., 12, 130. [DOI] [PMC free article] [PubMed] [Google Scholar]
- 59. Martin D. M., Aubourg S., Schouwey M. B., et al. 2010, Functional annotation, genome organization and phylogeny of the grapevine (Vitis vinifera) terpene synthase gene family based on genome assembly, FLcDNA cloning, and enzyme assays. BMC Plant Biol., 10, 226. [DOI] [PMC free article] [PubMed] [Google Scholar]
- 60. Carbonell-Bejerano P., Rodríguez V., Royo C., et al. 2014, Circadian oscillatory transcriptional programs in grapevine ripening fruits. BMC Plant Biol., 14, 78. [DOI] [PMC free article] [PubMed] [Google Scholar]
- 61. Wong D. C. J., Sweetman C., Drew D. P., Ford C. M.. 2013, VTCdb: a gene co-expression database for the crop species Vitis vinifera (grapevine). BMC Genomics, 14, 882. [DOI] [PMC free article] [PubMed] [Google Scholar]
- 62. Yoshida T., Fujita Y., Sayama H., et al. 2010, AREB1, AREB2, and ABF3 are master transcription factors that cooperatively regulate ABRE-dependent ABA signaling involved in drought stress tolerance and require ABA for full activation. Plant J., 61, 672–85. [DOI] [PubMed] [Google Scholar]
- 63. Cutler S. R., Rodriguez P. L., Finkelstein R. R., Abrams S. R.. 2010, Abscisic acid: emergence of a core signaling network. Annu. Rev. Plant Biol., 61, 651–79. [DOI] [PubMed] [Google Scholar]
- 64. Olsson A. S. B., Engström P., Söderman E.. 2004, The homeobox genes ATHB12 and ATHB7 encode potential regulators of growth in response to water deficit in Arabidopsis. Plant Mol. Biol., 55, 663–77. [DOI] [PubMed] [Google Scholar]
- 65. Rossdeutsch L., Edwards E., Cookson S. J., et al. 2016, ABA-mediated responses to water deficit separate grapevine genotypes by their genetic background. BMC Plant Biol., 16, 91. [DOI] [PMC free article] [PubMed] [Google Scholar]
- 66. Rattanakon S., Ghan R., Gambetta G. A., Deluc L. G., Schlauch K. A., Cramer G. R.. 2016, Abscisic acid transcriptomic signaling varies with grapevine organ. BMC Plant Biol., 16, 72. [DOI] [PMC free article] [PubMed] [Google Scholar]
- 67. Matus J. T. 2016, Transcriptomic and metabolomic setworks in the grape berry illustrate that it takes more than flavonoids to fight against ultraviolet radiation. Front. Plant Sci., 7, 1337. [DOI] [PMC free article] [PubMed] [Google Scholar]
- 68. Ono E., Homma Y., Horikawa M., et al. 2010, Functional differentiation of the glycosyltransferases that contribute to the chemical diversity of bioactive flavonol glycosides in grapevines (Vitis vinifera). Plant Cell, 22, 2856–71. [DOI] [PMC free article] [PubMed] [Google Scholar]
- 69. Nguyen N. H., Jeong C. Y., Kang G. H., Yoo S. D., Hong S. W., Lee H.. 2015, MYBD employed by HY5 increases anthocyanin accumulation via repression of MYBL2 in Arabidopsis. Plant J., 84, 1192–205. [DOI] [PubMed] [Google Scholar]
- 70. Cramer G. R., Ghan R., Schlauch K. A., et al. 2014, Transcriptomic analysis of the late stages of grapevine (Vitis vinifera cv. Cabernet Sauvignon) berry ripening reveals significant induction of ethylene signaling and flavor pathways in the skin. BMC Plant Biol., 14, 1–21. [DOI] [PMC free article] [PubMed] [Google Scholar]
- 71. Armijo G., Schlechter R., Agurto M., Muñoz D., Nuñez C., Arce-Johnson P.. 2016, Grapevine pathogenic microorganisms: understanding infection strategies and host response scenarios. Front. Plant Sci., 7, 382. [DOI] [PMC free article] [PubMed] [Google Scholar]
- 72. Mueller S., Hilbert B., Dueckershoff K., et al. 2008, General detoxification and stress responses are mediated by oxidized lipids through TGA transcription factors in Arabidopsis. Plant Cell, 20, 768–85. [DOI] [PMC free article] [PubMed] [Google Scholar]
- 73. Veronese P., Nakagami H., Bluhm B., et al. 2006, The membrane-anchored BOTRYTIS-INDUCED KINASE1 plays distinct roles in Arabidopsis resistance to necrotrophic and biotrophic pathogens. Plant Cell, 18, 257–73. [DOI] [PMC free article] [PubMed] [Google Scholar]
- 74. Höll J., Vannozzi A., Czemmel S., et al. 2013, The R2R3-MYB transcription factors MYB14 and MYB15 regulate stilbene biosynthesis in Vitis vinifera. Plant Cell, 25, 4135–49. [DOI] [PMC free article] [PubMed] [Google Scholar]
- 75. Birkenbihl R. P., Diezel C., Somssich I. E.. 2012, Arabidopsis WRKY33 is a key transcriptional regulator of hormonal and metabolic responses toward Botrytis cinerea infection. Plant Physiol., 159, 266–85. [DOI] [PMC free article] [PubMed] [Google Scholar]
- 76. Xu X., Chen C., Fan B., Chen Z.. 2006, Physical and functional interactions between pathogen-induced Arabidopsis WRKY18, WRKY40, and WRKY60 transcription factors. Plant Cell, 18, 1310–26. [DOI] [PMC free article] [PubMed] [Google Scholar]
- 77. Wu Y., Deng Z., Lai J., et al. 2009, Dual function of Arabidopsis ATAF1 in abiotic and biotic stress responses. Cell Res., 19, 1279–90. [DOI] [PubMed] [Google Scholar]
- 78. Pieterse C. M. J., Van der Does D., Zamioudis C., Leon-Reyes A., Van Wees S. C. M.. 2012, Hormonal modulation of plant immunity. Annu. Rev. Cell Dev. Biol., 28, 489–521. [DOI] [PubMed] [Google Scholar]
- 79. Feechan A., Jermakow A. M., Ivancevic A., et al. 2013, Host cell entry of powdery mildew is correlated with endosomal transport of antagonistically acting VvPEN1 and VvMLO to the papilla. Mol. Plant. Microbe. Interact., 26, 1138–50. [DOI] [PubMed] [Google Scholar]
- 80. Byrne M. E., Barley R., Curtis M., et al. 2000, Asymmetric leaves1 mediates leaf patterning and stem cell function in Arabidopsis. Nature, 408, 967–71. [DOI] [PubMed] [Google Scholar]
- 81. Xing S., Salinas M., Garcia-Molina A., Höhmann S., Berndtgen R., Huijser P.. 2013, SPL8 and miR156-targeted SPL genes redundantly regulate Arabidopsis gynoecium differential patterning. Plant J., 75, 566–77. [DOI] [PubMed] [Google Scholar]
- 82. McCarthy R. L., Zhong R., Ye Z. H.. 2009, MYB83 is a direct target of SND1 and acts redundantly with MYB46 in the regulation of secondary cell wall biosynthesis in arabidopsis. Plant Cell Physiol., 50, 1950–64. [DOI] [PubMed] [Google Scholar]
- 83. Zhong R., Ye Z. H.. 2015, Secondary cell walls: biosynthesis, patterned deposition and transcriptional regulation. Plant Cell Physiol., 56, 195–214. [DOI] [PubMed] [Google Scholar]
- 84. Zhong R., Ye Z.-H.. 2012, MYB46 and MYB83 bind to the SMRE sites and directly activate a suite of transcription factors and secondary wall biosynthetic genes. Plant Cell Physiol., 53, 368–80. [DOI] [PubMed] [Google Scholar]
- 85. Lindemose S., Jensen M. K., De Velde J. Van, et al. 2014, A DNA-binding-site landscape and regulatory network analysis for NAC transcription factors in Arabidopsis thaliana. Nucleic Acids Res., 42, 7681–93. [DOI] [PMC free article] [PubMed] [Google Scholar]
- 86. Jarvis P., López-Juez E.. 2013, Biogenesis and homeostasis of chloroplasts and other plastids. Nat. Rev. Mol. Cell Biol., 14, 787–802. [DOI] [PubMed] [Google Scholar]
- 87. Nguyen C. V, Vrebalov J. T., Gapper N. E., et al. 2014, Tomato GOLDEN2-LIKE transcription factors reveal molecular gradients that function during fruit development and ripening. Plant Cell, 26, 585–601. [DOI] [PMC free article] [PubMed] [Google Scholar]
- 88. Powell A. L. T., Nguyen C. V., Hill T., et al. 2012, Uniform ripening encodes a Golden 2-like transcription factor regulating tomato fruit chloroplast development. Science, 336, 1711–5. [DOI] [PubMed] [Google Scholar]
- 89. Yasui Y., Hirakawa H., Ueno M., et al. 2016, Assembly of the draft genome of buckwheat and its applications in identifying agronomically useful genes. DNA Res., 23, 215–24. [DOI] [PMC free article] [PubMed] [Google Scholar]
- 90. Hirakawa H., Okada Y., Tabuchi H., et al. 2015, Survey of genome sequences in a wild sweet potato, Ipomoea trifida (H. B. K.) G. Don. DNA Res., 22, 171–9. [DOI] [PMC free article] [PubMed] [Google Scholar]
- 91. Sato K., Tanaka T., Shigenobu S., Motoi Y., Wu J., Itoh T.. 2015, Improvement of barley genome annotations by deciphering the Haruna Nijo genome. DNA Res., 23, 21–8. [DOI] [PMC free article] [PubMed] [Google Scholar]
Associated Data
This section collects any data citations, data availability statements, or supplementary materials included in this article.