

Abstract
This paper presents an integrated dietary assessment system based on food image analysis that uses mobile devices or smartphones. We describe two components of our integrated system: a mobile application and an image-based food nutrient database that is connected to the mobile application. An easy-to-use mobile application user interface is described that was designed based on user preferences as well as the requirements of the image analysis methods. The user interface is validated by user feedback collected from several studies. Food nutrient and image databases are also described which facilitates image-based dietary assessment and enable dietitians and other healthcare professionals to monitor patients dietary intake in real-time. The system has been tested and validated in several user studies involving more than 500 users who took more than 60,000 food images under controlled and community-dwelling conditions.
Keywords: Dietary Assessment, Evidence-Based Design, User Interface, Mobile Food Record, Food Image Database
1. INTRODUCTION
Many chronic diseases, including obesity and cancer are related to diet [36, 46]. Methods of dietary assessment attempt to capture a person’s food intake. This data can provide valuable information for the prevention of chronic diseases. Dietary assessment includes methods, such as the 24-hour dietary recall [24], in which a trained interviewer probes an individual about foods and beverages consumed over the past 24 hours. Another method is the dietary record which relies on the individual recording (usually on paper) all food and beverages consumed over a specified number of days (most commonly from 1 to 7 days). Dietary records in particular can be time consuming, tedious and burdensome for the user. As a consequence of these issues as well as the analysis time involved, researchers tend to avoid using this method in larger populations [44]. In addition, various studies have demonstrated that due to the recording burden people will underreport their intake [9,23,31,39,43,45].
The user burden and inaccuracy associated with existing dietary assessment methods have resulted in adopting technology as a path to improved methods. Recent research has demonstrated that the use of mobile telephones as a dietary record promises to be a valuable tool for dietitians and other healthcare professionals for dietary assessment [41]. Today, mobile devices (e.g., smartphones) have evolved to become general purpose mobile computing devices. Their high-speed multimedia processors, data network capability, and other features such as built-in cameras, location information retrieval, accelerometers and other sensors allow for new, complete and promising dietary assessment methods.
Several “nutrition” applications and internet-based tools and services have become available for the iPhone and Android telephones. Some of these applications also include the capability of taking images of foods eaten at different eating occasions and using the images as part of a food diary to assist users in manually recording their diets. These applications include Hyperfit [21], Calorie Counter [6], Meal Snap [1], Tap & Track [4], PhotoCalorie [3], MyFitness-Pal [2], Foodcam [25] and Im2Calories [35]. In many of these systems, a user must first identify the names and quantities of food items and then the nutrient values are estimated, which places a large portion of the dietary assessment on the user (or on a human analyst).
One issue in the use of food images for dietary assessment is the ability of having a set of images with ground truth information so that the performance of the food image analysis can be evaluated. It is beyond the scope of this paper to discuss food image analysis in any detail. We briefly discuss here existing food image databases and then we will contrast this with the approach we used in the system described in this paper. By “ground truth information” above we mean food images where one is given the food locations (segmented regions), food types/labels, and the food volume and/or food portion size. Unfortunately, there is not one single publicly available food image dataset that meets these goals. There are several publicly available food datasets that only provide labels of the food types that appear in the image, they do not provide any information relative to portion size (i.e., segmented regions and food volume) that we also require. These publicly available datasets include the 100,000+ images in the Food-101 dataset [12], approximately 1 million food images in the ImageNet dataset [32], the 4545 images and 606 stereo pairs in the Pittsburgh Fast Food image dataset [13,47], the 5000 images in the Foodcam Dataset [25, 26, 34], the 3000 images in the FooDD dataset [38], and the 3583 images in the UNICT-FD889 dataset [17].
For the past several years we have been developing a system that uses the integrated digital camera in a mobile telephone for taking food images known as the Technology Assisted Dietary Assessment (TADA) system [40, 41, 50]. The TADA system consists of two main parts: a mobile application that runs on a mobile telephone or tablet, which is known as the mobile food record (mFR) and the backend cloud-like system consisting of computation for food image analysis and database servers. The TADA system has a fully integrated database system which contains food images, “ground truthed images”, and other associated metadata (e.g., geo-coded information) which are described in detail in Section 4. This database is far more advanced than any of the food databases we described above. A description of the TADA system is presented in Section 2. Our goal is to provide a tool for researchers, professional dietitians, and other healthcare professionals that will produce an improved assessment of dietary intake than what is currently available using existing methods.
This paper describes the end-to-end architecture of the TADA system with emphasis on the design of the mobile application and the integrated backend database system. The use of image analysis imposes requirements on the mFR and that makes the design of the mFR challenging. The solutions we provide are designed in a way to meet the requirements yet make the mFR user interface “easy-to-use.” In previous papers [8, 11, 30], earlier versions of the mFR and the database system were presented.
Since we published the above papers we have conducted more studies using our system. Based on feedback from adolescents and adults participating in user studies, new features for the mFR have been developed, as well as enhancements to the cloud-based image analysis and databases. This paper describes these new features and the integration of new capabilities into the system. These include the use of the Universal Product Code (via barcodes), improvements in image acquisition, the user review process, the integration of nutritional information with visual characteristics of foods, the addition of real time estimates of “user eating statistics” such as most frequently recorded foods and average duration of eating occasions. Also, an email-based notification system is described that can be used for reminders.
We have completed six user studies with the mFR that included feedback from users. These studies have included 126 children, 3–8 years old [7]; 119 adolescents, 11–18 years old [14,41]; and 349 adults, 18–65 years old [14, 28]. Specifically, the data from two of these studies with adult participants will be used in this paper to demonstrate improvements to the system and the ease of use.
2. OVERALL SYSTEM ARCHITECTURE
The TADA system consists of two main parts: a mobile application that runs on a mobile device, this is known as the mobile food record (mFR), and the “backend” cloud-like system consisting of the computation and database servers which includes the image-based food nutrient database system and food-image analysis methods [50]. In this paper, we limit our discussion to the mFR and the image-based food nutrient database systems.
In the TADA system, dietary intake is estimated using the images captured during eating occasions. Each food item in the image is segmented, identified [49], and its volume is estimated [16]. From this information, the energy and nutrient intake can be determined using a food composition table [27]. Figure 1 shows an overview of our system. The first step is to use the mFR to acquire images of an eating occasion, one image before and one image after eating, and send them to the server along with appropriate metadata (e.g. date, time, geolocation, and camera angle). Automatic image analysis (image segmentation and food identification) is done on the server (step 2) [49]. These results from the “before” image are sent back to the mFR (step 3) where the user reviews and confirms the food labels (step 4). In step 5, the server receives the information back from the user and uses these results for final image analysis refinement and volume estimation [16]. Step 6 consists of structuring the data generated in the previous steps by forming object descriptions (e.g. user information, images, metadata, and image analysis results) and storing them in a database system. Also in step 6, energy (kilocalories) and nutrient information (e.g., vitamin C) is determined from an expanded version of the USDA Food and Nutrient Database for Dietary Studies (FNDDS1 [5]). Finally, these results are made available to researchers through a web-based interface (step 7).
Figure 1.
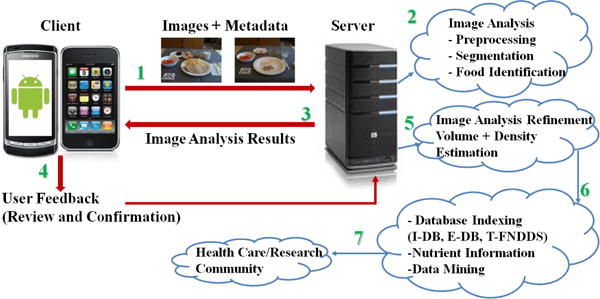
Architecture of the TADA Image-Based Dietary Assessment System [50].
3. MFR INTERFACE
This section describes the design and implementation of the user interface for the mFR iPhone application.2 Our goal was to develop a user interface that is easy-to-use with very little or no training, intuitive and simultaneously satisfies the requirements imposed by the food image analysis. Our design takes into consideration four elements in the user interface: easy and fast collection of daily food images, minimum user burden, protection of user personal information, and efficient network usage.
We developed the user interface in an iterative process where each iteration included three main steps: setting the goals and guidelines, prototyping, and then implementing the user interface on the actual device. The methodology we used in designing our user interface is discussed in more depth in [29] and [22] and emphasizes the aspect of “usability” of the user interface. After the three steps were completed, the application was used in a user study where users provided feedback by completing a questionnaire about the usability of the application. We collected user feedback after each study and repeated the three-step process until we reached the current state of the user interface. In some of the studies, we required users to come in, eat foods that we provided, and monitored them while using the application. This allowed us to measure the amount of time the user spent for each part of the application and to assess the usability of the interface. We used the same three-step iterative process for each feature we added to the application. Some features needed one iteration only, others needed two, and at most we had to do three iterations. Prototyping was done using white boards and paper in long meetings which included both the engineering and nutrition science teams. This prototyping method is described in [42].
Our current mobile application consists of three main “views, which the user can access using a tab bar. The views are entitled Record, Review, and More and appear on the tab bar from left to right in this respective order (Figure 2). The Record view is used for capturing images of eating occasions, while the Review view is used for reviewing the results received from the server, and finally the view titled More provides general features of the application.
Figure 2.
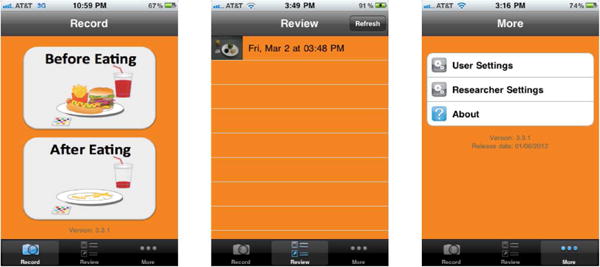
Main Views of the mFR User Interface.
3.1 Recording Eating Occasions
In our system, the user records eating occasions by capturing images of foods and beverages. Figure 2 shows the recording view, titled Record, on the left. This view consists of two primary buttons, one for taking an image before eating and another for taking an image after eating. The buttons are purposely large to aid the user in quickly identifying and tapping the correct button. For fast and efficient use, when the user launches the application, the first view is the Record view. When at other views, the user can go to the Record view by choosing the button entitled Record from the tab bar on the bottom of the application screen. Through feedback from users in our user studies, we found that limiting the record options to a simple, “before eating” and “after eating” best accommodated an eating occasion, as well as second helpings. In the latter case, taking an “after eating” image prior to adding more food and then taking another “before eating” image after adding more food was found to be a more intuitive solution from the user perspective. Initially, the Record view included a prompt to select the description of the eating occasion, e.g., breakfast, snack. This was found to use too much time given that the application saves real-time the labeling of the eating occasion type.
3.1.1 Image Acquisition
Image acquisition is a crucial step which has a great impact on the performance of any image-based dietary assessment system. The user interface should be designed to assist the user in capturing useful images. The image is considered to be “useful” if it fulfills the requirements that allow the backend food image processing to analyze and extract information from the image. Our back-end cloud-based image analysis system requires a food-image to: (1) have food placed on a flat surface with all food items appearing in the view, (2) have minimal highlights or shadows in the view, (3) have the fiducial marker3 placed to the lower left of the food, (4) be captured in landscape view with a specific orientation, and (5) have a view angle between 45 and 60 degrees from the horizontal.
The Record view is designed in such a way to help the user in meeting these imaging requirements, particularly requirements 3 to 5. In order to ensure that the user is aware of these requirements and to address the remaining requirements, we implemented tips in the form of an alert message that pops up before the user takes an image (Step 1 in Figure 3). These tips can be turned off in the user settings. To address requirement 3, we implemented a fast method in the mFR that searches for the fiducial marker in an image and provides immediate feedback [48]. If the fiducial marker is not found, the user is asked to either retake the image or save it (without the fiducial marker present). Requirement 4 is addressed by displaying two labels with titles Top and Bottom in the camera view to indicate landscape mode and to show where the top and the bottom of the image should be located (Step 2 in Figure 3) [30]. Requirement 5 is addressed by using the accelerometer in the mobile device to extract the angle information, which we use to ensure that the user is not taking a top view or a front view of the food. This is important for later server-side volume estimation. To guide the user to the correct orientation (i.e., landscape view with correct angle), we display guidelines on the top and bottom of the camera view that are located under the Top and Bottom labels. These lines and the Top and Bottom labels are in red when the camera is not in the correct orientation (pose) and turn green when it is in proper orientation. Further, a camera assistant is added in the form of small-font texts displayed in the middle of the camera view (see Figure 3). The camera assistant can be turned off in the user settings in order to have a clear view of the food.
Figure 3.
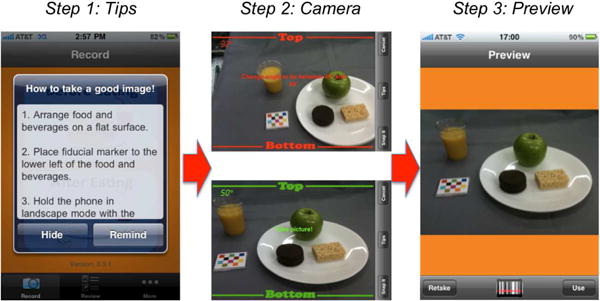
The Image Acquisition Process in the mFR Application.
3.1.2 Saving Eating Occasion Information
For each eating occasion, the food images are compressed and saved on the mobile device. In addition, information for each eating occasion is written in a specific file with a .rec extension (hereafter referred as a rec file). This information includes the device ID, user ID, date and time of the image acquisition, along with the file names of the before and after eating images. The date and time of the eating occasion corresponds to the date and time of the before eating image acquisition. If the user permits the mFR to use location services, the GPS location information, when available, of each image is written in a specific file with .gps extension (hereafter referred as a gps file).
3.1.3 Barcode Scanning
The mFR application provides an option to capture the barcode of food items. This feature can be accessed by choosing the button with the barcode symbol from the toolbar of the Preview screen, after taking the before eating or after eating image (Figure 3). The barcode feature allows the user to scan the barcode as shown in Figure 4(left). After the application reads the barcode, the result is displayed on the screen (Figure 4(right)), with the option to report a mismatch in detected barcode to the server by pressing the Report Mismatch button. For every eating occasion, the barcode information is written into a specific file with .bar extension (hereafter referred as a bar file).
Figure 4.
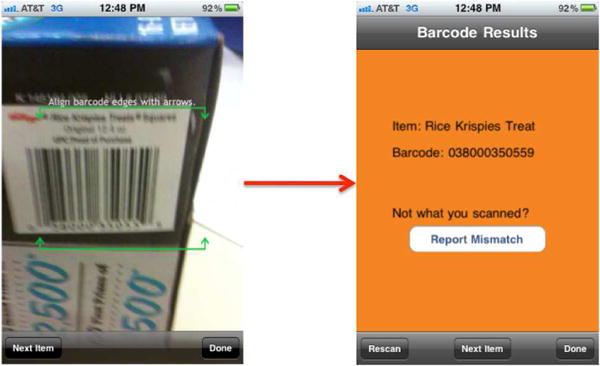
Barcode Capture Feature in the mFR Application.
3.1.4 Communication with the Server
Once the “after eating image” is captured and saved, the data for the specific eating occasion, including the images, the rec file, the gps file, and the bar file are ready to be sent to the server. All communications with the server, in both directions, are encrypted using Transport Layer Security (TLS) [15]. In order to avoid losing any data for an eating occasion, we keep track of the status of the communication of each eating occasion in a separate file. If all the required files of the eating occasion are successfully received by the cloud-based server, then an alert message is displayed on the screen notifying the user of successful communications. Otherwise, the user will be notified and then a button is placed on the top-right of the Record screen indicating the number of unsent eating occasions. This button can be used for sending the unsent eating occasions to the server again and is hidden when all eating occasions are received at the server.
In our most recent version of the mFR, data communication is done in the background, i.e., the user is not made aware of any of the communications. Also, unsent data is sent in the background automatically, removing the burden of manually starting the process. In addition, we recently developed an application programming interface (API) that allows for a “standard” way for devices to communicate with our cloud-based servers based on the webservices representational state transfer (REST) style [18]. Specifically, the API allows clients (e.g. smartphones, web browsers, etc.) to connect to our servers using HTTPS for all communications.
3.2 Reviewing Eating Occasions
The mFR has a dedicated view, entitled Review, for reviewing the food images of the eating occasions (shown in middle of Fig. 2). This allows a user to review the results of the image analysis and provide information that image analysis uses to update its learning methods. This view consists of a list of eating occasions that are ready to be reviewed and a button on the top-right of the screen that is used to check and download any new results available on the server. For each eating occasion, the results are downloaded in a file with extension .tag (hereafter referred as a tag file) that contains a list of the foods identified in the image with their names, FNDDS database codes, and the pixel location. This information is determined in the image analysis operations on the server.
When the user taps on an eating occasion from the list, the before eating image is then displayed in landscape view with the food labels placed on the image according to the image analysis results received from the server (Fig. 5(1)). The labels are in the form of pins pointing to the food and a bubble that includes an abbreviated food name of 15 characters or less (due to the small screen space constraints). Pins and corresponding bubbles of different colors are used to differentiate labels and aid the user in understanding bubble-pin correspondence. The green color is reserved for confirmed labels. The user can zoom-in to have a better view of the location of the pins (Figure 5(2)), which is important when labels happen to be overlapping.
Figure 5.
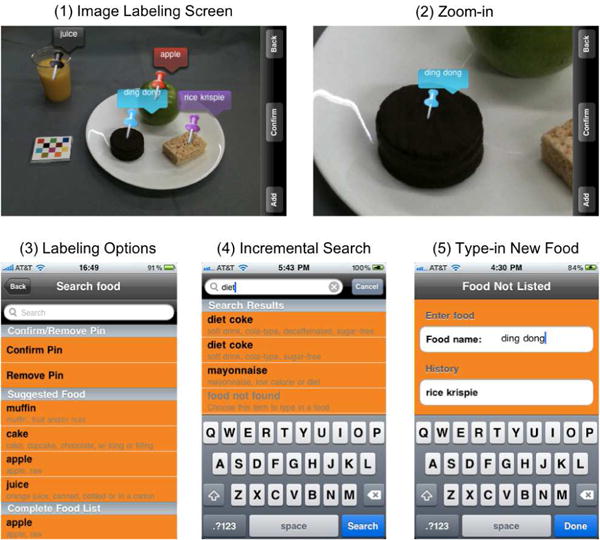
Image Labeling in the Review Process.
The review process, confirming and/or editing the food labels, consists of four main operations: confirming the label, removing the label, changing the food name shown in the bubble, and adding a new label. Any of the first three operations can be performed by tapping the bubble of the label, which displays a list consisting of three different sections, with a search bar on top (Figure 5(3)). The sections have the titles, and also appear in the respective order, Confirm/Remove Pin, Suggested Food, and Complete Food List. Under the Confirm/Remove Pin, the options to confirm and remove the pinare listed. To change the food name, the Suggested Food section contains four suggested foods listed in order of likelihood from the image analysis performed on the sever. In addition, Complete Food List section lists all the foods available in the database on the device along with their detailed descriptions. In Figure 5(4), the abbreviated “diet coke” is listed twice in the search result. However, the second line reveals two choices to be distinct, i.e., “soft drink, cola-type, decaffeinated, sugar-free” or “soft drink, cola-type, sugar-free.” Thus, a user could specify whether the cola in the image was decaffeinated or not, which is a characteristic that cannot be determined from the image analysis. We also implemented an incremental search mechanism to help the user quickly search the complete list. The user can perform this search by using the search bar that is located above the list (Figure 5(4)). The user can also type-in a new food name if it is not found in the list (Food Not Listed view shown in Figure 5(5)).
The fourth operation, adding a new label, is done by tapping the Add button from the toolbar (Step 1, Figure 6). Then, the toolbar displays two buttons; one with a pencil image and the other one to cancel adding a pin (Step 2, Figure 6. After zooming to the food that is to be labeled (Step 3, Figure 6), the user can choose the pencil button to start drawing a contour around the food using the touch screen (Step 4, Figure 6). The information about the contour is represented in points and is saved in a file with extension .pts (hereafter referred as a pts file). After drawing the contour, the user can either choose to clear the contour or use it. If they choose to use it, then the Complete Food List is displayed along with a search bar (Step 5, Fig. 6). After choosing a food, a green pin (indicating that the pin is confirmed) is added to the image at the appropriate location with the name of food in the bubble. We consider the entire process of adding a new label of adding labels by drawing contours around the food to be a significant contribution to the implementation of the user interface for these types of applications, because it allows the user to add a food label in a simple way, and more importantly, allows for description retrieval of the contour of the added food, which is made accurate by the zooming capability.
Figure 6.
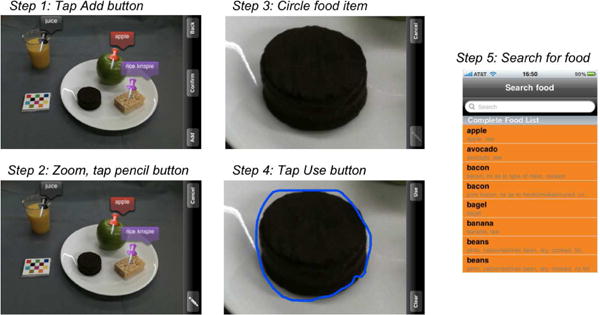
Adding a New Food Label to the Image.
After the user completes the labeling of the image, i.e., all the labels are green, the user can choose the Confirm button placed in the middle of the toolbar (Figure 5(1)). Then, the updated tag file is sent to the server along with a single pts file that is created by appropriately merging all the pts files for the user-added labels. The information from the review process including contours of any newly added foods are used by the image analysis methods to learn a user’s diet and hence improve the results of image analysis.
4. THE TADA DATABASES
A cloud-based database system for managing and storing the data generated by our system including the mFR is part of the backend architecture (see Figure 1). In our database system data is organized around three key elements: images, food nutrients and energy, and users. Our distributed design allows for more efficient data retrieval as opposed to the global/local database approach while providing much more information than a typical food and nutrient database. Our approach for organizing and storing the large amounts of images and metadata generated by TADA uses three logically interrelated databases namely I-TADA, T-FNDDS, and E-TADA. This was done based on feedback we received from professional end users (healthcare professionals) who wanted to be able to have distinct (but integrated and secure) databases so that the data could be examined separately.
The I-TADA database contains metadata and contextual information related to the food images along with pointers to the actual food images. The T-FNDDS database is an extension of the original USDA Food and Nutrient Database for Dietary Studies (FNDDS) [5] by adding visual descriptions and other information associated with each food item such as barcode data. The E-TADA database stores information available for each user and data related to the user nutrition studies. The system is compliant with all US regulations with respect to user privacy. Dietitians and other healthcare professionals could use our system to aid in the treatment of a particular user by relating a user’s User ID to their actual identity. This section describes each of the three databases in detail. Figure 7 shows the main information stored in each of the three databases.
Figure 7.
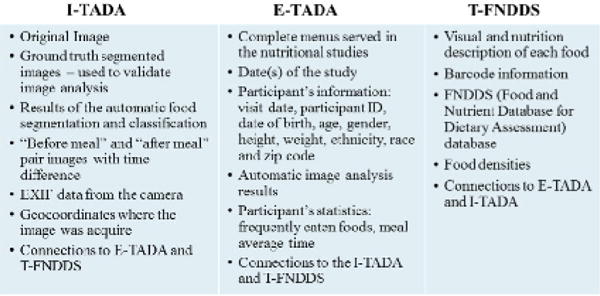
Main Components of the Databases and Their Contents.
4.1 I-TADA
The I-TADA database or image database is a food image database that contains metadata and contextual information from the food images. As soon as an image arrives at the cloud-based server from the mFR application, the server builds a data structure with the information that can be obtained from the image. This data structure includes the list of all the food items in the image from the image analysis and the results confirmed by the user, the time difference between both images, the user ID, a tag indicating the study ID, image metadata, and connections to E-TADA and T-FNDDS. Figure 8 shows an example of the data available. Each before (and after) eating image in the I-TADA is linked with its corresponding after (and before) eating image.
Figure 8.
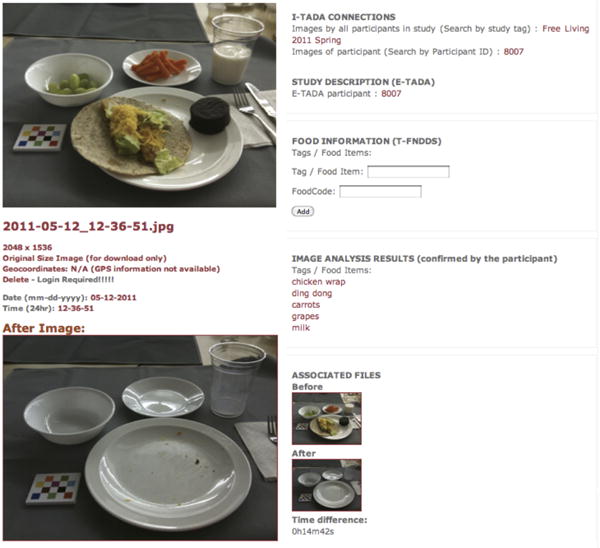
An Example of the Information Available in the I-TADA Database for a Typical Image.
In general, images generated from digital cameras contain data integrated into the image file header. This image metadata mostly comes from the EXIF (Exchangeable Image File Format) header of the image file [20]. This includes date and time stamps, camera specifications such as camera model or make, internal parameters associated to each camera/lens such as aperture, focal length, and shutter speed. The EXIF data is used to evaluate the image analysis performance across different camera models and other EXIF parameters. The camera parameters are also used for camera calibration. When available, the GPS information and the GPS time stamp is incorporated into I-TADA. Other contextual information related to the camera pose, whether the fiducial marker was present, and the results of the blur detection are also entered into I-TADA.
The metadata is used in two ways: as an “extra feature” by providing a rich set of information to aid the image analysis and to obtain patterns of dietary habits. GPS information can also be used to help identify foods. In I-TADA, the eating events and foods eaten by a user are stored so that the food identification system can use this information to create “individual” sets of training data related to each user and learn the users’s eating patterns. All the data available in I-TADA is interconnected to data available in the T-FNDDS and E-TADA.
4.2 T-FNDDS
The T-FNDDS database is an extension of the existing FNDDS [5] food database with image-based dietary assessment information added. The FNDDS is a public database of foods, nutrient values, and weights for typical food portions. FNDDS has 11 tables including primary descriptions for approximately 7,000 food items, weights for various portions of each food (approximately 30,000 weights), complete nutrient profiles (food energy and 60 nutrient/food components), descriptions and measurement units for each component, and descriptions for approximately 6,500 similar food items associated with specific main food items. Each food is described by an 8-digit unique food code. We have imported the FNDDS into the T-FNDDS.
We developed many visual characteristics (features) that are used for each food item so that foods can be correctly identified from their images. These features describe elementary characteristics such as color, perceptual features, type index (solid/liquid), and reflectivity. They can be grouped together forming a collection of metadata that we refer to as the Visual Characterization Metric (VCM). The VCM is a unique way for food to be indexed in a food database and provide the research community with features needed to recognize food items from food images. For each food item identified in the image, a set of visual descriptors are constructed. A standard reference language must be used to describe the VCM. This can be accomplished by using a Description Definition Languages (DDL) defining the syntax rules to combine, modify, and/or extend the descriptors. Most DDLs are based on the Extensible Markup Language (XML) (e.g., MPEG-7 [33], MPEG-21 [10], or Dublin Core [19]). By expressing the VCM in XML, the VCM can easily be exported to other applications.
We have also incorporated Universal Product Code (UPC) information via food barcodes [37]. The mFR is capable of capturing food bar codes that we index into the database and use for dietary assement. Having UPC information can provide faster and more accurate food identification and portion size in situations where it is not possible for the user to take images of their foods (e.g., low-lighting conditions). The barcode can also be used to correct misidentification of foods in the review process (step 4 of Figure 1).
4.3 E-TADA
The purpose of E-TADA or the Experiments database is to store data related to study participants using the mFR. We have conducted two types of user studies: community-dwelling studies and controlled feeding studies. During community dwelling studies, study participants carry on their normal lives and acquire food images as they would in normal life scenarios such as eating at fast-food restaurants, at home watching TV, in the office, on-the-go, and other real life situations. For the controlled feeding studies, study participants are served food from a pre-defined menu while in a controlled eating environment with pre-decided foods and weighed portions. In some cases, environmental conditions, such as table cloths, plates, glasses, utensils, and lighting conditions, are pre-defined. At a minimum, the participant’s ID and visit date information is stored in E-TADA. Some other information is study specific, such as menus, dates and times, or number of study participants. If needed by the investigators, additional information may be stored, e.g., date of birth, age, sex, height, body weight, ethnicity, race, or zip code.
As discussed in Section 4.4, E-TADA can be an excellent source of information to predict eating patterns with respect to a user or entire populations. User specific statistics can be obtained from the data stored in E-TADA including the most frequently eaten foods, average eating occasion, most frequent eating locations, and most frequent eating times.
Our current database system consists of 119 tables with more than 600 fields and 15 million parameters. More than 500 participants have used the mFR and have populated I-TADA with more than 60,000 food images. There are more than 15,000 groundtruth images in I-TADA used for testing the image analysis methods. There are also approximately 7,000 food items in our database.
4.4 Healthcare Professional Interface
A web-based interface to our cloud-based databases allows healthcare professionals to access the data in real time via a study-specific password protected website. This provides a wide range of information including, food information, user statistics, and image analysis results. The web interface provides a mechanism to monitor study participants involved in studies using the mFR. Real-time statistics can also be obtained, such as the most commonly eaten foods by a study participant, mean eating occasion duration time, and time of a particular eating event. In addition, nutrient information of each of the foods in an image recently acquired by a study participant. The user’s data from past and current studies can be accessed from any device with an internet browser. To visualize the location where an image was acquired, the geolocation information is provided by Google Maps.
One can select any image in the database and display the information related to that image. Each set of information has a associated hyperlink that executes a particular query in the database and displays the results. Metadata and other contextual information related to the image is also shown: EXIF data and geolocation coordinates are displayed with embedded hyperlinks (e.g., all the images acquired with the same camera or the geographic area where the image was acquired).
Complementing the web interface, we have created an email-based monitoring system. Whenever a particular event occurs, the notification system automatically generates and sends an email to the healthcare professional with the event notification information. The desired events may vary depending on the characteristics of the study.
5. VALIDATION THROUGH USER STUDIES
Throughout the development of the TADA system, adolescents and adults have participated in a variety of studies to aid with improving the TADA system and evaluating the accuracy of the results generated. We developed the mFR user interface in an iterative process that is described in Section 3. Before each iteration we used the user feedback, along with observations we obtained from health care professionals, from the previous iteration to improve the user interface for the next iteration.
All participants were asked to acquire images of single or multiple eating occasions using the mFR and reviewed the results from the food image analysis. These studies have used two basic study designs: controlled feeding under observation or community-dwelling. For the controlled feeding studies, adolescents and adults were served food from a pre-defined menu while in a controlled eating environment with pre-decided table cloths, plates, glasses, utensils, and lighting conditions. Prior to each study, all of the foods to be served were prepared and images were captured for training the classification system and populating the image-based food and nutrient database. For one of the community-dwelling studies, adults were provided all meals and snacks of known portions at energy levels in excess of their estimated energy requirements allowing for participants to eat to satiation. All foods were consumed in their usual eating environments. They were provided pre-decided placements, plates, and glasses. They were encouraged to eat foods not provided, such as coffee, alcohol, favorite foods. As done prior to the controlled feeding studies, images of the foods to be provided were captured and used to train the classification system. In a second community-dwelling study, participants acquired images of their eating occasions under real life situations (e.g., eating at home watching TV, eating at the office, eating on-the-go).
To validate our system, we present results from two studies where the mFR was used. After using the mFR for the specified duration, the participants were asked to complete a survey about their experience in the study. In this paper, we focus on the questions that are user-interface related. The first study is the community-dwelling study where food was provided and 45 men and women were asked to acquire a pair of images (i.e., before and after eating) at each eating occasion for 7 days. Hereafter, we will refer to this study as the Food In Focus (FIF) study. These images were automatically processed by the TADA system. A total of 1562 before images were acquired and analyzed by the TADA food image analysis system. The largest number of images acquired by any participant was 88 before images over the 7 days and the smallest number of images was 23. The average number of before images acquired per week/per participant was 37.
In the second study, known as CHAT [28], the Review section of the app was omitted and the study included 247 participants. The CHAT study followed a 6-month randomized trial in community-dwelling young adults aged 18 to 30 years. The participants used the mpFR for 4-days at baseline and then 6 months later. The omission of the Review section in the CHAT study helped us evaluate the burden added on the user by the Review section.
User-interface related questions for the Food In Focus study are shown in Figure 9. For data analysis purposes, we will replace the multiple choice answers “Strongly agree” through “Strongly disagree” with numbers from 1 to 5. The mean response scores for questions 1 through 3 of Figure 9 are summarized in Table 1. Question 1 in Figure 9 evaluated the overall use of the mFR. No participant in the Food In Focus study selected “Strongly disagree” as a response to Question 1; therefore responses range from 1 to 4. The mean response to this question was 1.96 which indicates that the users primarily agreed that the mFR, which included the Review section, was easy to use. These results support the conclusion that the user interface presented in this paper is indeed easy to use. One aspect of the mFR that we believe would bring the mean of Question 1 even closer to 1, is to have the communications run in the background without the user being aware of it, which has become possible by the recent releases of iPhone’s iOS. The mFR in that case would also send unsent data automatically to the cloud-based server in the background without the user having to be burdened with manually initiating the process. We recently finished the implementation of this feature that will be included in our future user studies for usability testing.
Figure 9.
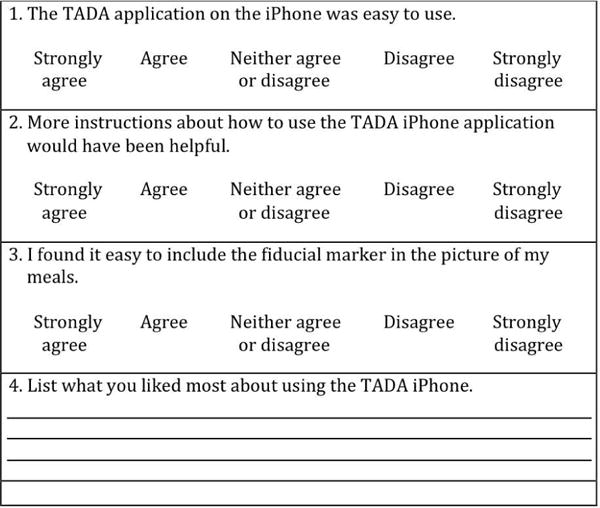
User-interface related survey questions for the Food In Focus study.
Table 1.
Mean response scores for questions 1 to 3 of Figure 9 in the Food In Focus study.
| FIF Question | 1 | 2 | 3 |
| Mean Score | 1.96 | 3.35 | 1.88 |
In Question 2 of Figure 9, we asked the participants whether or not they needed more instructions on the mFR, and the mean was 3.35, which is closest to the answer “Neither agree nor disagree”, leaning a little bit towards “disagree”. This shows that the overall easiness of the user interface can be further enhanced by enhancing the instructions for the mFR. To address this problem, we added a short instructional video to the mFR at the initial launch of the mFR, and added the video to the More section of the mFR so that users can always access the video when desired. As we discuss the results of the CHAT study below more instructions are needed for the Review section, compared to the Record section. Another important question of interest is to evaluate the easiness of including the fiducial marker in the view of the camera, which we addressed in Question 3. Question 3 scored a mean of 1.88 which indicated that users more than likely agreed that it was easy to use the fiducial marker as advised. Our future plan is to make the fiducial marker the size of a credit card so that it is smaller and can fit in pockets or wallets. We think this will further enhance the easiness of using the fiducial marker. In Question 4, we asked the users what they liked most about the mFR. Interestingly, 15 out of 45 participants said that what they liked most about the mFR is that it was easy/simple to use. More interestingly, 7 participants said that they liked the food labeling in the Review section the most. Two participants said that they liked the camera angle prompt the most.
The questions for the CHAT study are shown in Figure 10. Recall that in the CHAT study, the Review section was omitted from the mFR. As before, we replaced the multiple choice answers “Strongly Agree” through “Strongly disagree” with numbers from 1 to 5 for data analysis. The mean response scores for questions 1 through 3 of Figure 10 are summarized in Table 2. Question 1 addressed the overall easiness of the mFR and the mean response score was 1.64. As in the Food In Focus study, no participant in the CHAT study selected “Strongly disagree” to this question. The mean response went from 1.96 for Question 1 in the Food In Focus study to 1.64 for the CHAT study. The slightly lower score indicating greater agreement with regard to ease of use among the CHAT study participants may be secondary to the omission of the Review section. However, we can conclude from comparing these results that the Review section, which was included in the Food In Focus mFR, does not add substantial burden on the user. This result is important and validates the implementation of the Review section, which is a challenging module of the mFR, and of image-based systems with automated dietary assessment, in general, due to display size constraints on the devices being used.
Figure 10.
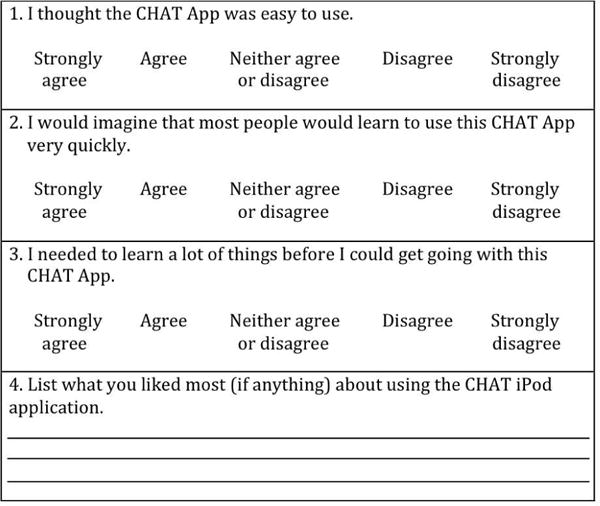
User-interface related survey questions for the CHAT study.
Table 2.
Mean response scores for questions 1 to 3 of Figure 10 in the CHAT study.
| CHAT Question | 1 | 2 | 3 |
| Mean Score | 1.64 | 1.53 | 4.33 |
Question 2 of Figure 10 scored a mean answer of 1.53 which indicated that our implementation of the Record section does not require extensive training. It is also important to see whether users perceive that they needed to have previous background or long training. This was addressed in Question 3, which scored a mean answer of 4.33. This shows again that the Record section of the mFR is easy to use and does not require extensive training. Another important result that validates the implementation of the Record section, is that 103 participants out of the 247 participants in the CHAT study, listed as an answer to Question 4 in Figure 10 that what they liked the most about the mFR is that it is easy/simple/fast/quick.
6. CONCLUSION
In this paper we described the mobile food record (mFR) and the image-based food nutrient databases of our system used for dietary assessment. A mobile user interface was presented and its design and implementation was described. The strategy was to develop a user interface that is easy and intuitive to use for non-technical users yet that meets the requirements imposed by the image analysis process. The mFR has been deployed on the Apple iPhone and the Android OS and has been tested in extensive studies conducted by dietitians and researchers. We presented data on the user feedback collected from two studies that validate the design of the user interface presented in this paper. We also described three interconnected databases that provide tools that can be used by dietitians and other healthcare professionals for dietary assessment. Potential data mining functionality for finding and predicting patterns of dietary habits and assessment is currently being investigated.
Footnotes
This work was sponsored by a grant from the US National Institutes of Health under grant NIH/NIEHS5R01ES012459-05S1. Any opinions, findings, and conclusions or recommendations expressed in this material are those of the author(s) and do not necessarily reflect the views of the US National Institutes of Health.
The FNDDS [5] is a food composition database containing foods eaten in the U.S., their nutrient values, and weights for standardized food portions.
There is also an Android version of the mFR.
A fiducial marker is an object of known shape, size and color (e.g. a checkerboard pattern) used to correct the colors of the acquired images to match the reference colors and to estimate food portion using geometric models.
Contributor Information
Ziad Ahmad, Purdue University, School Of Electrical And Computer Engineering, West Lafayette, IN, USA.
Deborah A. Kerr, Curtin University, Curtin Health Innovation Research Institute and The School of Public Health, Perth, WA, Australia
Marc Bosch, The Johns Hopkins University, Applied Physics Laboratory, Laurel, MD, USA.
Carol J. Boushey, University of Hawaii Cancer Center, Honolulu, HI, USA
Edward J. Delp, Purdue University, School Of Electrical and Computer Engineering, West Lafayette, IN, USA
Nitin Khanna, Indian Institute of Technology, Gandhinagar Electrical Engineering, Gandhinagar, India.
Fengqing Zhu, Purdue University, School Of Electrical and Computer Engineering, West Lafayette, IN, USA.
References
- 1.Meal Snap. DailyBurn [Google Scholar]
- 2.MyFitnessPal.
- 3.PhotoCalorie.
- 4.Tap & track.
- 5.USDA food and nutrient database for dietary studies, 1.0. Beltsville, MD: Agricultural Research Service, Food Surveys Research Group; 2004. [Google Scholar]
- 6.iPhone Calorie Counter. Demand Media, Inc.; 2010. [Google Scholar]
- 7.Aflague TF, Boushey CJ, Guerrero RTL, Ahmad Z, Kerr DA, Delp EJ. Feasibility and use of the mobile food record for capturing eating occasions among children ages 3–10 years in guam. Nutrients. 2015;7:6. 4403–4415. doi: 10.3390/nu7064403. [DOI] [PMC free article] [PubMed] [Google Scholar]
- 8.Ahmad Z, Khanna N, Kerr DA, Boushey CJ, Delp EJ. Proceedings of SPIE. San Francisco, CA: Feb, 2014. A mobile phone user interface for image-based dietary assessment; pp. 903007–903007-9. [DOI] [PMC free article] [PubMed] [Google Scholar]
- 9.Bathalon G, Tucker K, Hays N, Vinken A, Greenberg A, McCrory M, Roberts S. Psychological measures of eating behavior and the accuracy of 3 common dietary assessment methods in healthy postmenopausal women. American Journal of Clinical Nutrition. 2000;71:739–745. doi: 10.1093/ajcn/71.3.739. [DOI] [PubMed] [Google Scholar]
- 10.Bormans J, Gelissen J, Perkis A. Mpeg-21: The 21st century multimedia framework. IEEE Signal Processing Magazine. 2003;20:53–62. [Google Scholar]
- 11.Bosch M, Schap T, Khanna N, Zhu F, Boushey CJ, Delp EJ. Proceedings of the 1st IEEE International Workshop on Multimedia Services and Technologies for E-health. Barcelona, Spain: Jul, 2011. Integrated databases system for mobile dietary assessment and analysis; pp. 1–6. [DOI] [PMC free article] [PubMed] [Google Scholar]
- 12.Bossard L, Guillaumin M, Van Gool L. Proceedings of the European Conference on Computer Vision 8694. Zurich, Switzerland: Sep, 2014. Food-101 – mining discriminative components with random forests; pp. 446–461. [Google Scholar]
- 13.Chen M, Dhingra K, Wu W, Yang L, Sukthankar R, Yang J. Proceedings of the IEEE International Conference on Image Processing. Cairo, Egypt: Nov, 2009. Pfid: Pittsburgh fast-food image dataset; pp. 289–292. [Google Scholar]
- 14.Daugherty LB, Schap ET, Ettienne-Gittens R, Zhu MF, Bosch M, Delp JE, Ebert SD, Kerr AD, Boushey JC. Novel technologies for assessing dietary intake: Evaluating the usability of a mobile telephone food record among adults and adolescents. Journal of Medical Internet Research. 2012 Apr;14(2):e58. doi: 10.2196/jmir.1967. [DOI] [PMC free article] [PubMed] [Google Scholar]
- 15.Dierks T, Rescorla E. RFC 5246: The Transport Layer Security (TLS) Protocol – Version 1.2. http://tools.ietf.org/html/rfc5246, August 2008.
- 16.Fang S, Liu C, Zhu F, Delp E, Boushey C. Proceedings of the IEEE International Symposium on Multimedia. Miami, Florida: Dec, 2015. Single-view food portion estimation based on geometric models. [DOI] [PMC free article] [PubMed] [Google Scholar]
- 17.Farinella GM, Allegra D, Stanco F. Proceedings of the European Conference on Computer Vision Workshops. Zurich, Switzerland: Sep, 2014. A benchmark dataset to study the representation of food images; pp. 584–599. [Google Scholar]
- 18.Fielding RT, Taylor RN. Principled design of the modern web architecture. ACM Transactions on Internet Technology. 2002 May;2(2):115–150. [Google Scholar]
- 19.International Organization for Standardization. Information and Documentation. The Dublin Core metadata element set. Brittish Standard, 2009
- 20.Japan Electronic Industry Development Association (JEIDA). Design rule for camera file system, version 1.0., 1998
- 21.Jarvinen P, Jarvinen T, Lahteenmaki L, Sodegard C. Proceedings of the Second International Conference on Pervasive Computing Technologies for Healthcare. Tampere, Finland: Jan, 2008. Hyperfit: Hybrid media in personal nutrition and exercise management; pp. 222–226. [Google Scholar]
- 22.Ji YG, Park JH, Lee C, Yun MH. A usability checklist for the usability evaluation of mobile phone user interface. International Journal Human-Computer Interaction. 2006;20(3):207–231. [Google Scholar]
- 23.Johnson R, Soultanakis R, Matthews D. Literacy and body fatness are associated with underreporting of energy intake in US low-income women using the multiple-pass 24-hour recall: a doubly labeled water study. Journal of the American Dietetic Association. 1998;98:1136–1140. doi: 10.1016/S0002-8223(98)00263-6. [DOI] [PubMed] [Google Scholar]
- 24.Johnson RK. Dietary intake – how do we measure what people are really eating? Obesity Research. 2002;10:63S–68S. doi: 10.1038/oby.2002.192. [DOI] [PubMed] [Google Scholar]
- 25.Joutou T, Yanai K. Proceedings of the IEEE International Conference on Image Processing. Cairo, Egypt: Oct, 2009. A food image recognition system with multiple kernel learning; pp. 285–288. [Google Scholar]
- 26.Kawano Y, Yanai K. Proceedings of the European Conference on Computer Vision Workshops. Zurich, Switzerland: Sep, 2014. Automatic expansion of a food image dataset leveraging existing categories with domain adaptation; pp. 3–17. [Google Scholar]
- 27.Kelkar S, Boushey CJ, Okos M. A method to determine the density of foods using x-ray imaging. Journal of Food Engineering. 2015;159:36–41. doi: 10.1016/j.jfoodeng.2015.03.012. [DOI] [PMC free article] [PubMed] [Google Scholar]
- 28.Kerr DA, Pollard CM, Howat P, Delp EJ, Pickering M, Kerr KR, Dhaliwal SS, Pratt IS, Wright J, Boushey CJ. Connecting health and technology (chat): protocol of a randomized controlled trial to improve nutrition behaviours using mobile devices and tailored text messaging in young adults. BMC public health. 2012;12(1):477. doi: 10.1186/1471-2458-12-477. [DOI] [PMC free article] [PubMed] [Google Scholar]
- 29.Kies JK, Williges RC, Rosson MB. Coordinating computer-supported cooperative work: A review of research issues and strategies. Journal of the American Society for Information Science. 1998 Dec;49(9):776–791. [Google Scholar]
- 30.Kim S, Schap T, Bosch M, Maciejewski R, Delp E, Ebert D, Boushey C. Proceedings of the 9th International Conference on Mobile and Ubiquitous Multimedia. Limassol, Cyprus: Dec, 2010. Development of a mobile user interface for image-based dietary assessment; pp. 13:1–13:7. [DOI] [PMC free article] [PubMed] [Google Scholar]
- 31.Klesges R, Eck L, Ray J. Who underreports dietary intake in a dietary recall? Evidence from the Second National Health and Nutrition Examination Survey. Journal of Consulting and Clinical Psychology. 1995;63:438–444. doi: 10.1037//0022-006x.63.3.438. [DOI] [PubMed] [Google Scholar]
- 32.Krizhevsky A, Sutskever I, Hinton GE. Imagenet classification with deep convolutional neural networks. Proceedings of Advances in Neural Information Processing Systems. 2012 Dec;:1097–1105. [Google Scholar]
- 33.Manjunath B, Salembier P, Sikora T. Introduction to MPEG-7: Multimedia Content Description Interface. Wiley and Sons; USA: 2002. [Google Scholar]
- 34.Matsuda Y, Yanai K. Proceedings of IEEE International Conference on Pattern Recognition. Providence, Rhode Island: Jun, 2012. Multiple-food recognition considering co-occurrence employing manifold ranking; pp. 2017–2020. [Google Scholar]
- 35.Myers A, Johnston N, Rathod V, Korattikara A, Gorban A, Silberman N, Guadarrama S, Papandreou G, Huang J, Murphy K. Im2calories: Towards an automated mobile vision food diary. Proceedings of the International Conference on Computer Vision. 2015 Dec; [Google Scholar]
- 36.National Vital Statistics Systems. Quickstats: Age-adjusted death rates for the 10 leading causes of death. Morbidity and Mortality Weekly Report. 2009;58(46):1303. [Google Scholar]
- 37.Palmer R. The Bar-Code Book. Helmers Publishing; 1989. [Google Scholar]
- 38.Pouladzadeh P, Yassine A, Shirmohammadi S. Proceedings of New Trends in Image Analysis and Processing – International Conference on Image Analysis and Processing Workshops 9281. Genova, Italy: Jun, 2015. Foodd: Food detection dataset for calorie measurement using food images; pp. 441–448. [Google Scholar]
- 39.Sawaya A, Tucker K, Tsay R, Willett W, Saltzman E, Dallal G, Roberts S. Evaluation of four methods for determining energy intake in young and older women: Comparison with doubly labeled water measurements of total energy expenditure. American Journal of Clinical Nutrition. 1996;63:491–499. doi: 10.1093/ajcn/63.4.491. [DOI] [PubMed] [Google Scholar]
- 40.Six B, Schap T, Kerr D, Boushey C. Evaluation of the food and nutrient database for dietary studies for use with a mobile telephone food record. Journal of Food Composition and Analysis. 2011;24:1160–1167. doi: 10.1016/j.jfca.2011.06.006. [DOI] [PMC free article] [PubMed] [Google Scholar]
- 41.Six B, Schap T, Zhu F, Mariappan A, Bosch M, Delp E, Ebert D, Kerr D, Boushey C. Evidence-based development of a mobile telephone food record. Journal of American Dietetic Association. 2010 Jan;:74–79. doi: 10.1016/j.jada.2009.10.010. [DOI] [PMC free article] [PubMed] [Google Scholar]
- 42.Snyder C. Paper prototyping: The fast and easy way to design and refine user interfaces. Morgan Kaufmann; 2003. [Google Scholar]
- 43.Subar AF, Kipnis V, Troiano RP, Midthune D, Schoeller DA, Bingham S, Sharbaugh CO, Trabulsi J, Runswick S, Ballard-Barbash R, Sunshine J, Schatzkin A. Using intake biomarkers to evaluate the extent of dietary misreporting in a large sample of adults: The open study. American Journal of Epidemiology. 2003;158(1):1–13. doi: 10.1093/aje/kwg092. [DOI] [PubMed] [Google Scholar]
- 44.Thompson F, Subar A, Loria C, Reedy J, Baranowski T. Need for technological innovation in dietary assessment. Journal of the American Dietetic Association. 2010;110(1):48–51. doi: 10.1016/j.jada.2009.10.008. [DOI] [PMC free article] [PubMed] [Google Scholar]
- 45.Tooze J, Subar A, Thompson F, Troiano R, Schatzkin A, Kipnis V. Psychosocial predictors of energy underreporting in a large doubly labeled water study. American Journal of Clinical Nutrition. 2004;79:795–804. doi: 10.1093/ajcn/79.5.795. [DOI] [PubMed] [Google Scholar]
- 46.United States Department of Agriculture. Report of the Dietary Guidelines Advisory Committee on the Dietary Guidelies for Americans. 2010 Available: http://www.cnpp.usda.gov/DGAs2010-DGACReport.htm.
- 47.Wu W, Yang J. Proceedings of the IEEE International Conference on Multimedia and Expo. New York, NY: Jun, 2009. Fast food recognition from videos of eating for calorie estimation; pp. 1210–1213. [Google Scholar]
- 48.Xu C, Khanna N, Boushey C, Delp E. Proceedings of the IEEE International Symposium on Multimedia. Dana Point, USA: Dec, 2011. Low complexity image quality measures for dietary assessment using mobile devices; pp. 351–356. [DOI] [PMC free article] [PubMed] [Google Scholar]
- 49.Zhu F, Bosch M, Khanna N, Boushey C, Delp E. Multiple hypotheses image segmentation and classification with application to dietary assessment. IEEE Journal of Biomedical and Health Informatics. 2015 Jan;19(1):377–388. doi: 10.1109/JBHI.2014.2304925. [DOI] [PMC free article] [PubMed] [Google Scholar]
- 50.Zhu F, Bosch M, Woo I, Kim S, Boushey CJ, Ebert DS, Delp EJ. The use of mobile devices in aiding dietary assessment and evaluation. IEEE Journal of Selected Topics in Signal Processing. 2010 Aug;4(4):756–766. doi: 10.1109/JSTSP.2010.2051471. [DOI] [PMC free article] [PubMed] [Google Scholar]