Summary paragraph
Adult pair bonding involves dramatic changes in the perception and valuation of another individual1. One key change is that partners come to reliably activate the brain's reward system2-6, though the precise neural mechanisms by which partners become rewarding during sociosexual interactions leading to a bond remain unclear. Using a prairie vole model of social bonding7, we show how a functional circuit from medial prefrontal cortex (mPFC) to nucleus accumbens (NAcc) is dynamically modulated to enhance females' affiliative behavior towards a partner. Individual variation in the strength of this functional connectivity, particularly after the first mating encounter, predicts how quickly animals begin affiliative huddling with their partner. Rhythmically activating this circuit in a social context without mating biases later preference towards a partner, indicating that this circuit's activity is not just correlated with how quickly animals become affiliative but causally accelerates it. These results provide the first dynamic view of corticostriatal activity during bond formation, revealing how social interactions can recruit brain reward systems to drive changes in affiliative behavior.
Main
The formation of socially monogamous relationships, or pair bonds, is a complex phenomenon occurring in less than 5% of mammalian species8. In the monogamous prairie vole, neurochemicals (e.g. oxytocin, dopamine)7 act in two anatomically-connected9,10 corticostriatal areas, the medial prefrontal cortex (mPFC) and nucleus accumbens (NAcc), to establish a selective preference towards a partner3,4. Individual variation in neurochemical receptors within this circuit explains differences in affiliative behavior4,5. However, little is known about how mPFC and NAcc are dynamically activated during sociosexual interactions. mPFC-NAcc communication is more generally implicated in an animal's ability to effectively coordinate its behavior to obtain rewards11,12, including gaining new behavioral strategies13. We therefore hypothesized that mPFC-NAcc functional connectivity helps to switch animals to express affiliative behavior towards a partner.
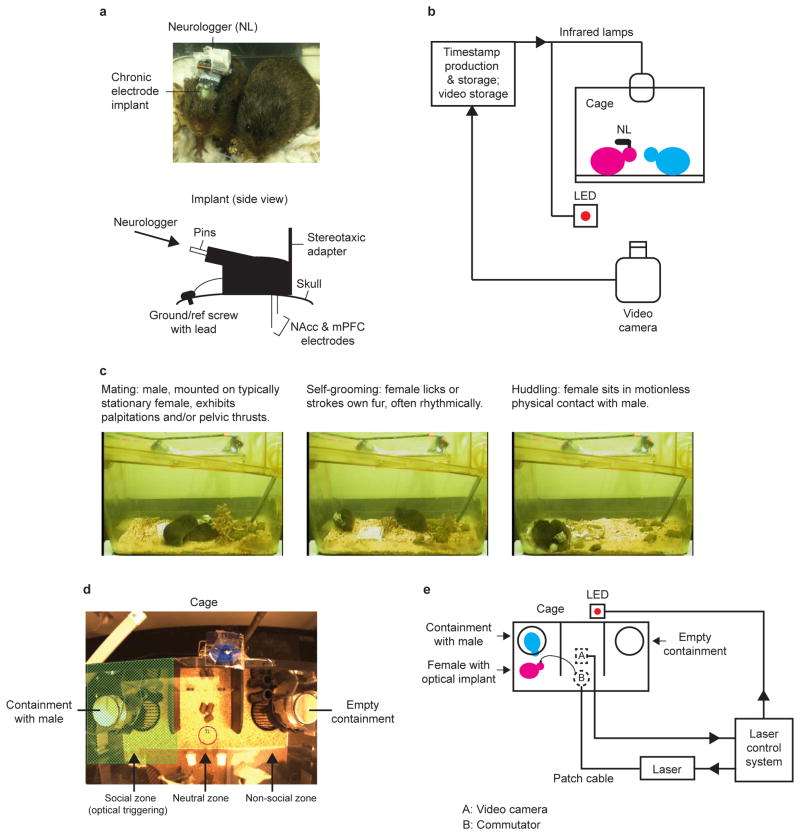
To examine the neural and behavioral specificity of this hypothesis, we developed an electrophysiological recording paradigm for freely-moving females during sociosexual interactions (Extended Data Fig. 1a-c). Electrodes were chronically implanted (Extended Data Fig. 2) in the mPFC and NAcc (hit animals) or an off-target area posterior to NAcc (within or bordering the bed nucleus of the stria terminalis (BNST); non-hit animals). Synchronized local field potentials (LFPs) and video were acquired during a 6-hour cohabitation with a male. Mating, which accelerates bond formation15, and side-by-side huddling, an index of bond expression16, were assessed as measures of affiliative behaviors during cohabitation. Self-grooming was assessed as a self-directed, high-motion control behavior.
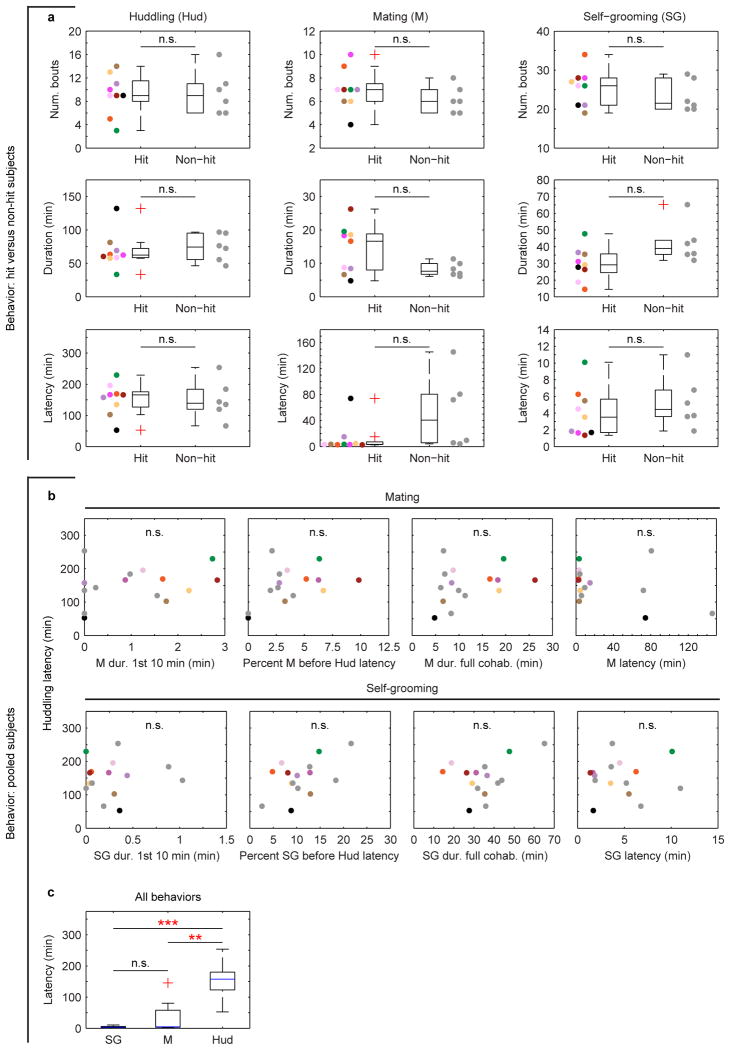
Behaviors were variable from individual to individual, yet not different overall between hit and non-hit animal groups (Extended Data Fig. 3a). In particular, individuals varied in how quickly they began huddling (huddling “latency”), with those that started earlier going on to huddle more (Fig. 1a-c). Accelerated huddling latencies were not simply explained by the quantity or timing of mating or self-grooming (Extended Data Fig. 3b), motivating us to ask whether mPFC-NAcc circuit activation could better explain variability in the timing of a switch towards more huddling.
Figure 1. Mating enhances low-frequency coherence across multiple brain areas.
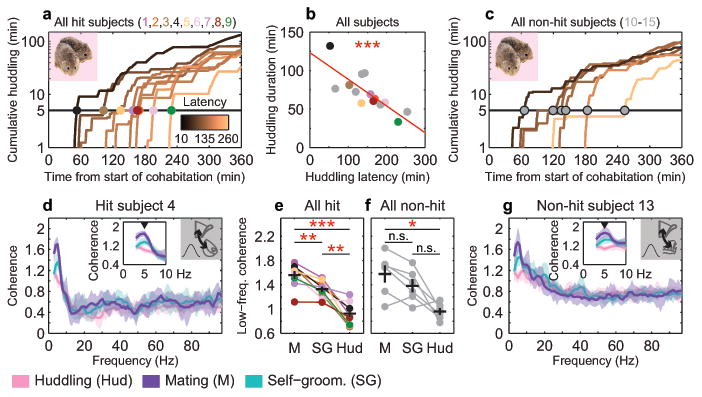
a, Cumulative huddling trajectories of hit and (c) non-hit subjects during cohabitation; huddling latencies are indicated by dots color-coded by subject. b, Huddling latency negatively correlates with total huddling duration over full cohabitation (n = 15; R2 = 0.63, P < 0.001). d, Coherence spectra for example hit and (g) non-hit subjects, with insets indicating low-frequency peaks during mating (5 Hz). Solid lines and shaded regions show mean and mid-95 percentile range, respectively, of the n = 40 coherence estimates for a given behavior (see Methods). e, 5 Hz coherence is significantly modulated by behavior in both hits (F2, 16 = 35.10, P < 0.001; post-hoc, M vs. SG, t8 = 4.65, P = 0.005; M vs. Hud, t8 = 6.73, P < 0.001; SG vs. Hud, t8 = 5.10, P = 0.003) and (f) non-hits (F2, 10 = 12.43, P = 0.002; post-hoc, M vs. SG, t5 = 2.44, P = 0.176; M vs. Hud, t5 = 4.08, P = 0.029; SG vs. Hud, t5 = 3.08, P = 0.082). Reported coherence P-values are Bonferroni-corrected for multiple comparisons (see Methods). Error bars show mean ± s.e.m. Image of huddling voles adapted from [17].
Low-frequency drive from mPFC to NAcc can alter behavioral responses to environmental stimuli18,19, so we analyzed whether mPFC-NAcc connectivity increases during social behaviors that promote more affiliative responses to a partner. Low-frequency coherence, a common measure of functional connectivity, was significantly higher during mating compared to self-grooming and huddling (Fig. 1d, e). Non-hit animals also showed significantly higher low-frequency coherence during mating compared to huddling (Fig. 1f, g), indicating that mating generally enhances low-frequency connectivity across multiple brain areas, consistent with a previous Fos study in males6.
To assess how this low-frequency connectivity modulates local activity within brain areas, we measured the interaction between low- and high (gamma)-frequency oscillations across brain areas (Fig. 2a). Gamma oscillations reflect local network activation20, including entrainment of fast-spiking interneurons within the ventral striatum21-23. In contrast, lower-frequency rhythms (e.g. delta, theta) can regulate gamma oscillations by phase modulating their amplitude24, a phenomenon observed across brain areas25. In both hit and non-hit groups, phase-amplitude coupling (“net modulation”, Fig. 2b, c) over the full cohabitation was maximal when low-frequency mPFC activity (5-6 Hz) modulated high gamma (80-84 Hz) activity in either the NAcc or non-hit area, motivating our focus below on this specific oscillatory channel for communication between regions.
Figure 2. mPFC-NAcc cross-frequency coupling is dynamically modulated and behavior-dependent.
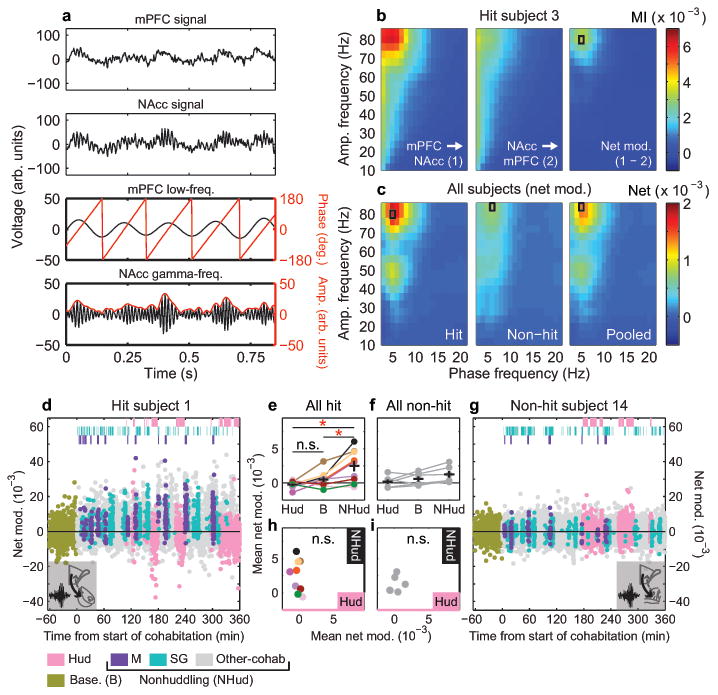
a, Example raw LFP from mPFC (top) and NAcc (upper middle), filtered into low-frequency (lower middle) and gamma-frequency (bottom) bands, shows gamma amplitude modulation by low-frequency phase. b, Modulation Index (MI) of phase-amplitude coupling for example hit subject showing mPFC-to-NAcc (left) and NAcc-to-mPFC (middle) directions during cohabitation. “Net modulation” (right) is difference in MI between directions. c, Mean net modulation for hit (left, n = 9), non-hit (middle, n = 6), or pooled (right, n = 15) subjects shows peaks when mPFC low-frequency phase modulates NAcc (or non-hit) gamma amplitude (indicated by black rectangle). d, Net modulation values (2-s, non-overlapping windows) sampled over a baseline solo period (gold points) and 6-hr cohabitation for example hit and (g) non-hit subjects. Values that temporally overlap with mating, self-grooming and huddling behaviors (top hashes) are color-coded accordingly. All non-scored values are indicated as “other-cohab,” which together with mating and self-grooming represent “nonhuddling” values. e, Mean net modulation across subjects during huddling, baseline and nonhuddling behaviors in all hits and (f) non-hits. Net modulation varies with behavior in hits (F1.219, 9.754 = 9.44, P = 0.010, Greenhouse-Geisser corrected; post-hoc, NHud vs. B, t8 = 3.39, P = 0.028; NHud vs. Hud, t8 = 3.17, P = 0.040; Hud vs. B, t8 = 1.81, P = 0.322) but not non-hits (F1.027, 5.133 = 3.94, P = 0.102, Greenhouse-Geisser corrected). h, Nonhuddling and huddling net modulations are not correlated in either hits (R2 = 0.10, P = 0.417) or (i) non-hits (R2 = 0.06, P = 0.630). Reported P-values in e, f are Bonferroni-corrected for multiple comparisons (see Methods). Error bars show mean ± s.e.m.
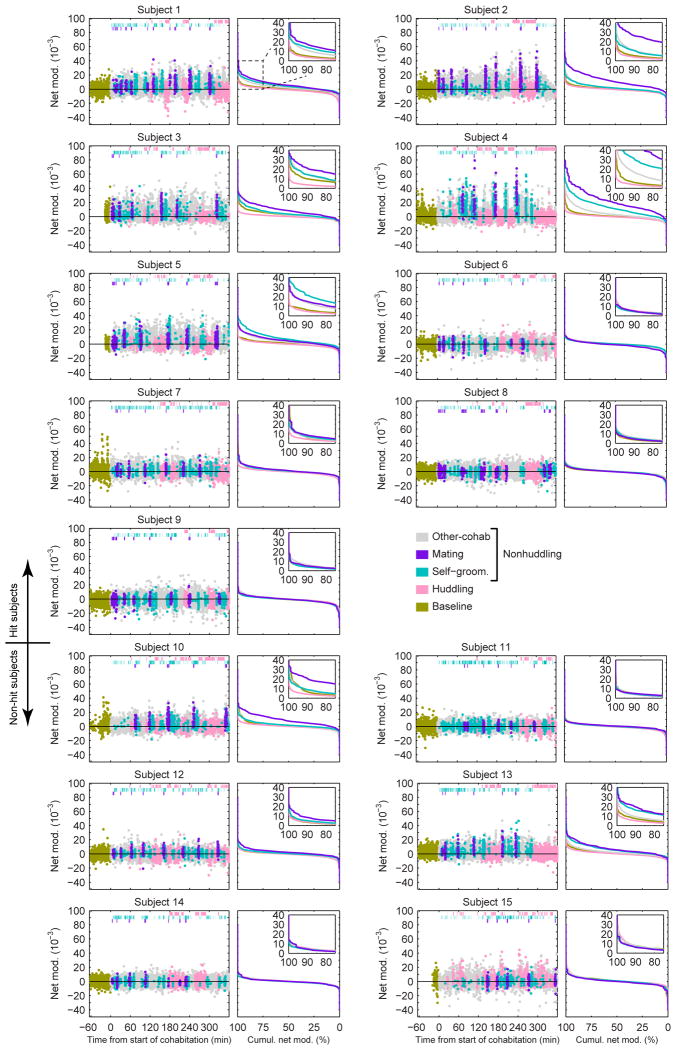
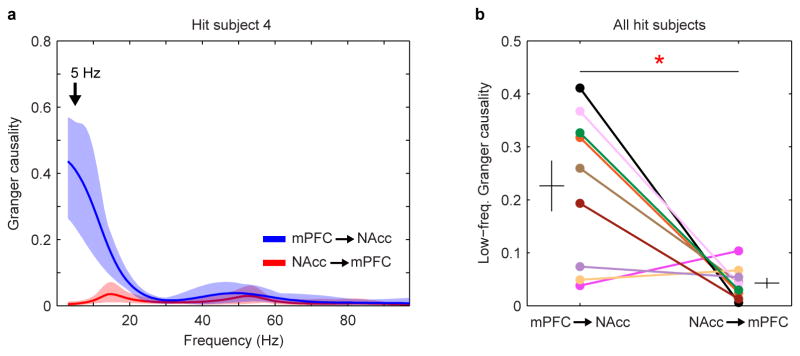
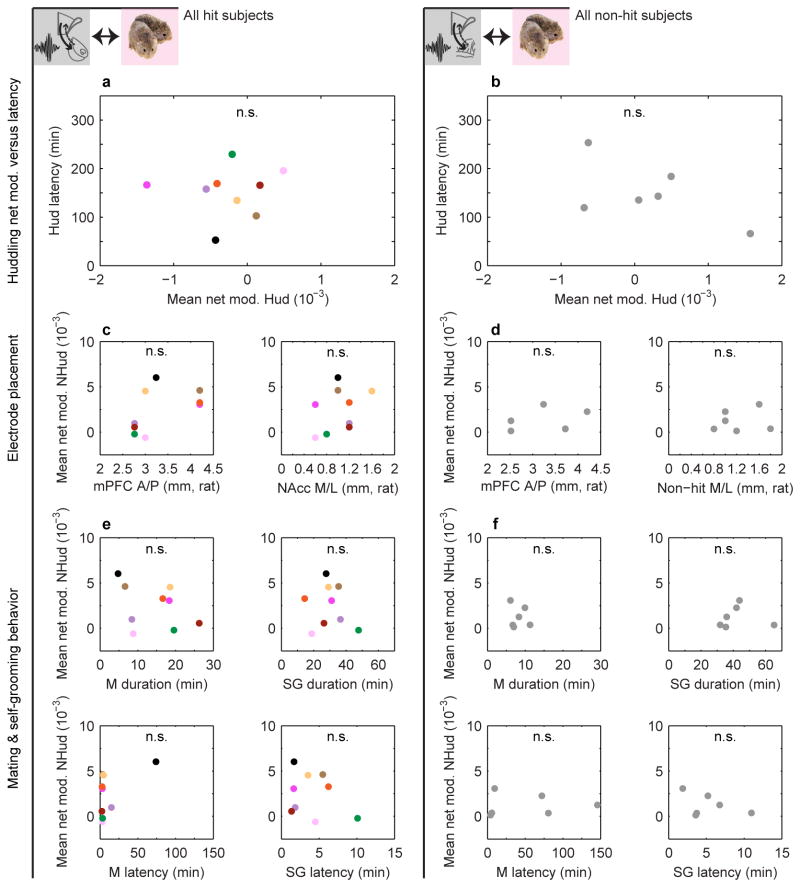
Net modulation during the cohabitation and a pre-cohabitation solo baseline period were dynamically modulated, most prominently in hit animals (Fig. 2d, g and Extended Data Fig. 4). Positive values were consistent with Granger causality estimates showing elevated low-frequency drive from mPFC to NAcc (versus the reverse) during mating (Extended Data Fig. 5). Net modulation varied significantly with behaviors in hit animals only (Fig. 2e, f). Net modulation during huddling was low and comparable to its level during baseline (Fig. 2e), implying that huddling does not elevate functional connectivity between mPFC and NAcc. Low net modulation was not likely from motionlessness, since animals were active and investigative when alone. In contrast, average net modulation during cohabitation outside of huddling (nonhuddling net modulation), while highly variable across animals, was significantly enhanced compared to both baseline and huddling. In the hit group only, individuals' nonhuddling net modulation over the full cohabitation significantly correlated with how quickly they began accumulating huddling (huddling latency, Fig. 3a, b), while huddling net modulation itself was uncorrelated with huddling latency (Extended Data Fig. 6a, b; no correlation between huddling and nonhuddling net modulations, Fig. 2h, i). Animals' nonhuddling net modulation was not explained by electrode placement (Extended Data Fig. 6c, d), nor the amount or timing of mating or self-grooming (Extended Data Fig. 6e, f). Therefore, mPFC's specific modulation of NAcc activity throughout the full cohabitation, with the exception of during huddling, explained how quickly individuals became affiliative.
Figure 3. mPFC-NAcc cross-frequency coupling correlates with huddling latency.
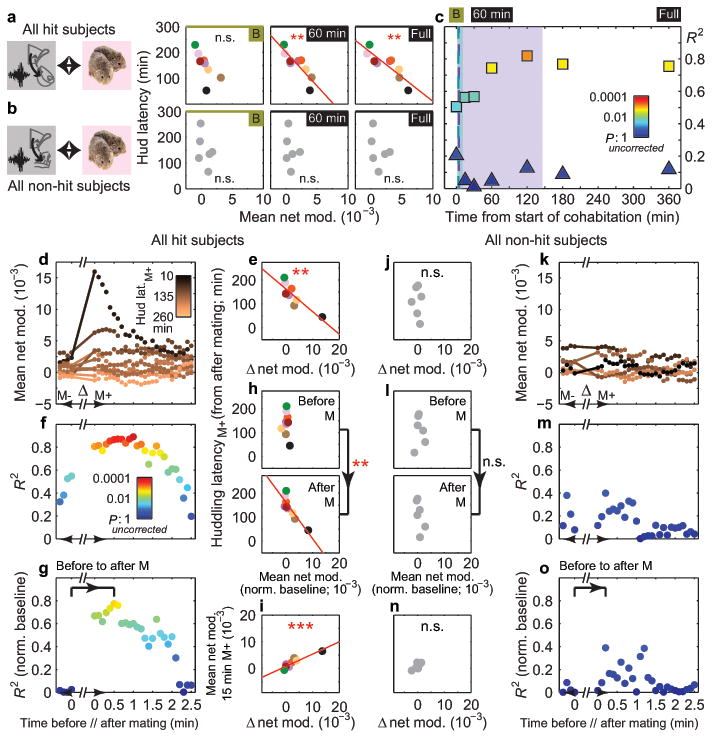
a, Correlations between huddling latency and mean nonhuddling (NHud) net modulation during baseline, first 60 minutes and full cohabitation in hits (R2 = 0.51, P = 0.096; R2= 0.74, P = 0.008; R2 = 0.76, P = 0.007, respectively) and (b) non-hits (R2 = 0.21, P > 0.99; R2 = 0.05, P > 0.99; R2 = 0.12, P > 0.99, respectively). Significant correlations occur for hits at 60 minutes and full cohabitation. c, Correlation strength (R2) between huddling latency and mean NHud net modulation increases for larger time windows from start of cohabitation in hits (squares) but not non-hits (triangles). Shaded regions and dashed bars indicate range and median of latencies to first mating (purple) and self-grooming (green) across all subjects (n = 15). d, Mean net modulation values within 1 min moving windows (stepped by 0.1 min) before (M-) and after (M+) the first mating bout of hits and (k) non-hits. Each subject's values are color-coded by that subject's latency to huddle from the end of the mating bout (latencyM+). e, Change in mean net modulation from immediately before to after the first mating bout (indicated by line segments in d) negatively correlates with huddling latencyM+ in hits (R2 = 0.72, P = 0.004) but not (j) non-hits (R2 = 0.02, P = 0.766; line segments in k). f, Strength of correlation between mean net modulation and huddling latencyM+ increases from before to after mating and is sustained for ∼2 min in hits but not (m) non-hits. g, h, This increase in hits is maintained, and significant (P = 0.002, permutation test on difference in R2 (0.75) between bracketed time points), when subtracting out the mean baseline net modulation from the local values around mating. (l, o) Non-hits show no significant increase in correlation strength (P = 0.233, observed R2 difference of 0.39). i, Change in mean net modulation from immediately before to after first mating bout correlates with mean NHud net modulation in the 15 min after mating in hits (R2 = 0.84, P < 0.001) but not (n) non-hits (R2 = 0.58, P = 0.080). All mating results in hit subjects (e, h, i) remain significant even without Subject 4 (black dot, n = 8). Reported P-values in a, b are Bonferroni-corrected for multiple comparisons (see Methods).
To determine the temporal emergence of this correlation, we next averaged net modulation over increasing time windows from the start of cohabitation. Baseline net modulation was moderately, albeit non-significantly, correlated with huddling latency in hit animals (Fig. 3a, left), potentially reflecting an individual's affiliative predisposition. No predisposition was found in non-hit animals where the correlation was low and non-significant, both at baseline and across time over cohabitation (Fig. 3b, c), where R2 values were non-overlapping with those of hit animals. In contrast, in hit animals, nonhuddling net modulation became increasingly correlated with huddling latency by 60 minutes into the cohabitation (Fig. 3a, c), before most animals began huddling, but after experiencing their first mating bout (Extended Data Fig. 3c). Hence, even if a weak affiliative predisposition was reflected in the mPFC-NAcc circuit's baseline activation, early cohabitation experience further strengthened this specific circuit's correlation with huddling.
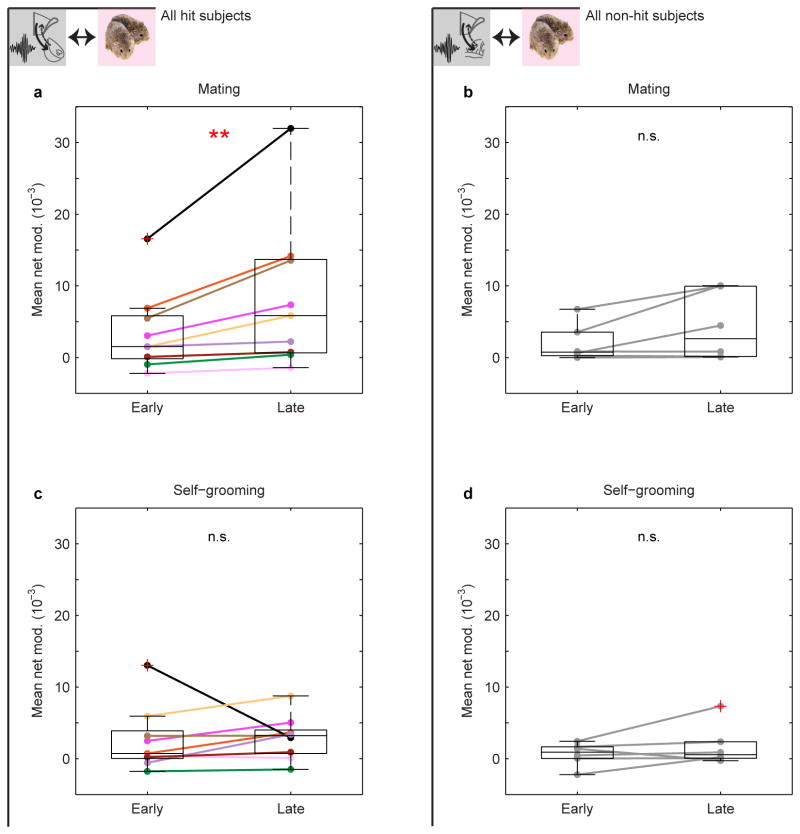
We next considered which early cohabitation behaviors could drive this strengthening. Mating typically occurred quickly (first bout range demarcated in Fig. 3c and Extended Data Fig. 3c), and its net modulation rose during cohabitation in hit animals, unlike self-grooming, another high net-modulation, early behavior (Extended Data Fig. 7). Given that mating promotes bond formation15, we tested whether early mating improved the circuit's correlation with huddling. In hit animals only, the change in net modulation from immediately before to after the first mating bout predicted the latency to huddle from the end of the bout. Animals with larger increases in net modulation around first mating, but not first self-grooming, more quickly began accumulating huddling (hits: Fig. 3d, e and Extended Data Fig. 8a, b, non-hits: Fig. 3j, k and Extended Data Fig. 8g, h). Animals' change in net modulation was not simply explained by behaviors during and around mating (Extended Data Fig. 8m, o), and it specifically correlated with the latency to subsequent huddling (as opposed to subsequent mating or self-grooming, Extended Data Fig. 8n, p).
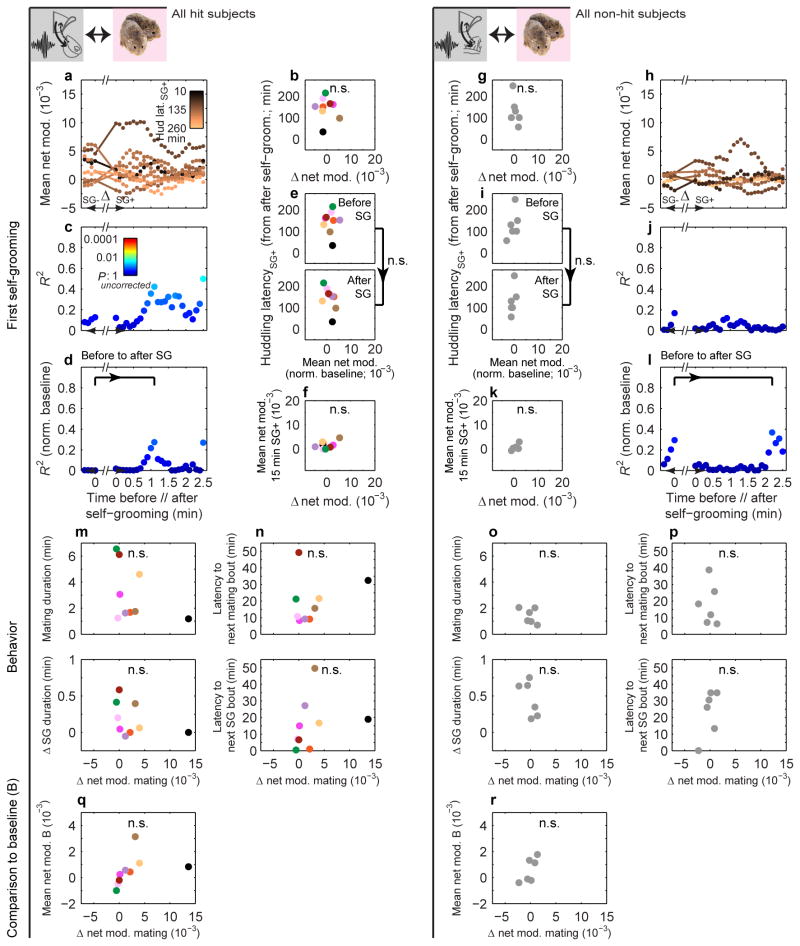
This mating-triggered change in net modulation augmented the circuit's correlation with huddling latency beyond predisposed levels. The magnitude of the change was not correlated with baseline levels (Extended Data Fig. 8q, r), suggesting a separate effect from any predisposition. Moreover, the correlation between local net modulation values (averaged over 1 minute) and huddling latency noticeably increased from the minute just before to up to ∼2 minutes after mating (Fig. 3f). Subtracting out individuals' baseline mean net modulation confirmed a significant augmentation (Fig. 3g, h). No improvement was observed around self-grooming (Extended Data Fig. 8c-e), nor in non-hit animals around either mating or self-grooming (Fig. 3l, m, o and Extended Data Fig. 8i, j, l). In hit animals only, net modulation changes around mating, but not self-grooming, correlated with the subsequent net modulation, averaged up to the shortest huddling latency (i.e. 15 minutes after behavior) (Fig. 3i, n and Extended Data Fig. 8f, k). Hence, mating specifically altered both the temporally local and more sustained post-mating mPFC-to-NAcc circuit activation in a way that predicted subsequent huddling behavior: animals whose mPFC's modulation of NAcc was more strongly boosted went on to huddle faster, thereby pointing to a new physiological source of individual variability in affiliative behavior.
To causally test the mPFC-NAcc circuit's sufficiency to accelerate huddling even without mating, we activated the circuit during a restricted cohabitation that prevented mating. This paradigm does not typically lead to pair bonding, as assessed in the laboratory by a later partner preference test (PPT)16. We virally expressed Channelrhodopsin-2 (ChR2) or a control fluorophore (EYFP) in mPFC projection neurons. During the cohabitation, when the female entered a “social zone” containing a caged male, we optically stimulated (up to 1 hour) the mPFC-NAcc pathway at 5 or 6 Hz (Fig. 4a-c and Extended Data Fig. 1d, e, 9-10), consistent with the frequency of peak mating coherence and net modulation. The ChR2 and EYFP groups showed comparable optical stimulation and time spent in each zone (Fig. 4d), indicating that ChR2 activation did not induce coarse behavioral differences during the restricted cohabitation. However, in the PPT the following day, the ChR2 group showed significantly greater preference for the partner compared to the stranger (Fig. 4e). Thus, low-frequency oscillatory drive from mPFC to NAcc was sufficient to bias the emergence of affiliative behavior.
Figure 4. Low-frequency stimulation of mPFC-to-NAcc projections biases behavioral preference towards a partner.
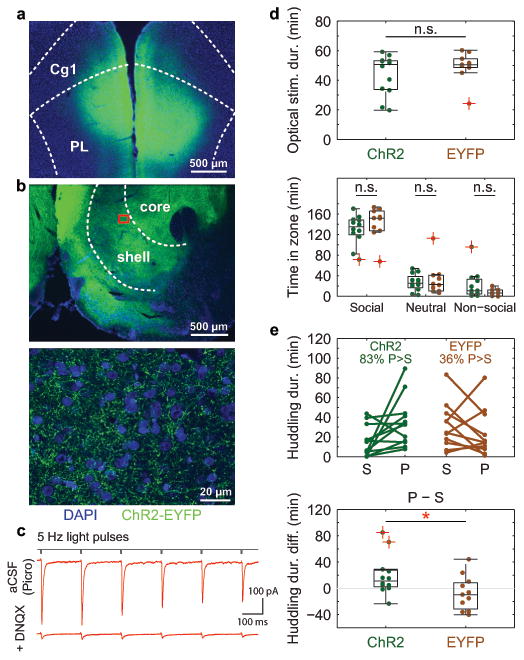
Example immunohistochemistry showing a, ChR2 expression in mPFC (injection site, top image) and b, fibers projecting to NAcc (stimulation site; middle and bottom images; bottom image is magnified view of boxed area). ChR2 tagged with enhanced yellow fluorescent protein (EYFP) for visualization. DAPI counterstain shows cell nuclei. c, Light-evoked excitatory post-synaptic currents in example putative NAcc medium spiny neuron during whole-cell patch recording in presence of Picrotoxin (Picro; top). Excitatory transmission confirmed using AMPA/kainate receptor antagonist 6,7-dinitroquinoxaline-2,3-dione (DNQX; bottom). Top and bottom traces each represent average response to n = 5 light-pulse trains at 5 Hz (see Methods). d, (Top) total optical stimulation and (bottom) time spent in each zone during cohabitation do not significantly differ between ChR2-expressing (n = 12) and control subjects (expressing EYFP only, n = 10; one subject missing due to data loss during cohabitation) (Stim, Cohen's d = 0.46, P = 0.298; Social, d = 0.41, P = 0.345; Neutral, d = 0.20, P = 0.698; Non-social, d = 0.68, P = 0.102). e, (Top) time spent with partner (P) versus stranger (S) during PPT for ChR2 (n = 12) and EYFP (n = 11) subjects. (Bottom) ChR2 subjects spent significantly greater relative time with the partner compared to stranger (d = 0.94, P = 0.034). Boxplots show median and interquartile range. Data points indicated by red cross refer to values whose distance from top or bottom of the box is greater than 1.5 times the interquartile range. Cg1: anterior cingulate cortex (area 1); PL: prelimbic cortex.
Our data demonstrate a previously unknown mechanism by which a corticostriatal circuit can shift female prairie voles towards increasing social affiliation (huddling). These brain areas play a role in non-social paradigms in which animals acquire new behavioral strategies to obtain reward13,26. We speculate that the rhythmic action of mPFC on NAcc, which is enhanced by mating, could engage oscillatory-based plasticity mechanisms27,28 to alter how NAcc responds to partner representations (e.g. transmitted from amygdala29 and hippocampus30). Future testing of this hypothesis, and whether the mPFC-NAcc circuit is not only sufficient but also necessary for increasing affiliative behavior, will further elucidate this circuit's endogenous contribution to bond formation. Neurochemicals (e.g. oxytocin, dopamine7) released by sociosexual interactions10 modulate these brain areas in both females and males3,4,6, raising the possibility that individual differences in neurochemical receptor densities4,5 could underlie how strongly this circuit is activated to promote an enduring bond.
Methods
Animals
All procedures were approved by the Emory University Institutional Animal Care and Use Committee. Experimental subjects (in in vivo electrophysiology, in vivo optogenetics, slice recording) were adult, sexually naive female prairie voles (Microtus ochrogaster) 76 to 154 days of age at the start of experiments. Animals were taken from our laboratory-bred colony derived from wild-caught Illinois stock. When possible, they were socially housed in same-sex duos or trios until implant surgeries (if performed), at which time they were separated and housed individually. Food (Lab Rabbit Diet HF #5326, LabDiet) and water were given ad libitum during a 14:10 hour light/dark cycle. Stimulus males used in behavioral experiments were adult, sexually experienced males under 1.5 years of age. Partners and strangers used in partner preference tests (PPTs; see below) were matched by age (within 61 days) and weight (within approximately 5 grams) for each female. Stimulus females used to prepare strangers were adult, sexually naive, socially housed females under 1 year of age.
Since this is the first study to our knowledge to apply in vivo electrophysiology and optogenetic approaches in behaving prairie voles, the target number of experimental subjects was chosen based on published studies in rodents using similar methods5,19,31.
Surgeries
All surgeries were done under isoflurane anesthesia. Anterior/posterior coordinates were referenced to Bregma, and dorsal/ventral coordinates were referenced to the top of the skull.
In in vivo electrophysiology experiments, females were ovariectomized to homogenize their hormonal state and chronically implanted with electrodes 10 to 20 days later. Electrodes were individual tungsten microelectrodes (1 MΩ, FHC) stereotaxically targeted to the left medial prefrontal cortex (mPFC, anterior 2.3 to 2.4 mm (median (M): 2.35 mm), lateral 0.2 to 0.5 (M: 0.3) mm, ventral 2.5 to 2.7 (M: 2.6) mm) and either nucleus accumbens (NAcc, anterior 1.8 to 2.0 (M: 1.9) mm, lateral 0.8 to 0.9 (M: 0.8) mm, ventral 4.6 to 4.8 (M: 4.6) mm) or bed nucleus of the stria terminalis (BNST, anterior 1.05 to 1.9 (M: 1.1) mm, lateral 0.8 to 1.0 (M: 0.95) mm, ventral 4.45 to 4.6 (M: 4.5)), which receives direct mPFC projections in rodents32,33. Electrodes were positioned in a fixed implant design (Extended Data Fig. 1a) that interfaced with a connector sitting on top of the skull. The connector in turn interfaced with the Neurologger recording device during experiments (see Experiments). A stainless steel ground screw (F000CE094, JI Morris) was placed in the right posterior cortex (anterior -2.6 mm, lateral -2.5 mm).
In in vivo optogenetics experiments, females underwent virus injection and optical fiber implant surgeries. Animals were bilaterally injected with an adeno-associated virus serotype 5 carrying either Channelrhodopsin-2 (ChR2) tagged with yellow fluorescent protein under the control of calmodulin-dependent protein kinase II alpha promoter (AAV5-CaMKIIa-hChR2(H134R)-EYFP-WPRE-PA, 4-8.5×10¹² viral molecules/mL, UNC Vector Core) or a control fluorophore lacking ChR2 (AAV5-CaMKIIa-EYFP, 4.4-5.2×10¹² viral molecules/mL, UNC Vector Core) to the mPFC (anterior 2.4 mm, medial ± 0.3 mm, ventral 2.7 mm). Injection parameters were 500 nL per side, 5 min injection time and 5 min wait time between the end of injection and retraction of the injector to allow the virus to sufficiently diffuse from the injector needle. Animals were assigned to the ChR2 and control groups by randomly selecting the number of animals in a given cage that would receive ChR2 (either 1 or 2 in cages of 3; cages of 2 had 1 animal in each group by constraint) and counterbalancing across cages to produce as equal number of animals in each group as possible.
Approximately five weeks after virus injection, animals were implanted with a bilateral optical cannula (200 μm core diameter, 240 μm outer diameter, 0.22 NA, 4.5 mm fiber length, 1.5 mm pitch, flat tip, Doric Lenses) targeting the medial NAcc (anterior 1.9 mm, medial ± 0.75 mm, ventral 4.5 mm). The light transmission efficiency of the optical cannula was measured prior to implantation (S140C or S121C, PM100D, ThorLabs). Experiments started 6 weeks (42.0 ± 1.9 days (mean ± st. deviation)) following virus injection to allow for virus expression in mPFC afferents at the NAcc.
In slice electrophysiology experiments, females underwent the same virus injection surgery as described above, but received only ChR2 virus. Recording experiments in the mPFC and NAcc started 15 and 40-43 days following virus injection, respectively. A longer waiting time was used for NAcc recordings to allow for virus expression in mPFC afferents at the NAcc.
Experiments
Prior to behavioral experiments, all females (experimental subjects, stimulus females) were primed with estradiol benzoate (17-β-Estradiol-3-Benzoate, Fisher Scientific, daily injections of 1-2 μg dissolved in sesame oil starting 3 to 4 days prior to experiments) to induce sociosexual interest in males34. The following experiments were performed once on independent experimental subjects.
1. Local field potential (LFP) recording in behaving females during cohabitation with a male
LFPs were recorded from the mPFC and NAcc of behaving females using a battery-powered Neurologger35 chip (1-GB model, New Behavior AG). The Neurologger has 8 channels (4 neural data, 2 reference, 1 accelerometer, 1 infrared synchronization) and samples up to 500 Hz. We chose this over a higher-sampling rate, multichannel, tethered system due to the social nature and long recording duration of our paradigm, and the need to minimize the chance that the partner would interfere with recordings.
Prior to experiments, the Neurologger was programmed with sampling rate and data storage parameters and secured onto the connector on top of the animal's skull (Extended Data Fig. 1a). The device recorded and stored data during the experiment. It was disconnected at the end of the experiment to download data onto a computer for analysis. The sampling rate was 199.805 Hz for all subjects except Subject 3 (489.075 Hz). Both sampling rates covered an adequate frequency range for data analysis. Subjects were habituated to the device for at least one hour on the day before experiments.
On the morning of experiments, the female was briefly anesthetized under isoflurane to secure the Neurologger and then transferred to a clean cage in the testing room to habituate for at least 10-15 minutes (up to 1 hour). A stimulus male was also brought in to the testing room to habituate. This solo habituation period is referred to as the baseline period. At the end of the baseline, the male was added to the female's cage and the animals were cohabitated for 6 hours. Neural and video recording were performed throughout the baseline and cohabitation and synchronized using periodic timestamps delivered every 100 frames (3.3 seconds) from a Cleversys Topscan system running on a 32-bit Dell Precision T3500 computer. These timestamps were transmitted as infrared and visible light (LED) pulses that were registered in the Neurologger synchronization channel (samples) and the video recording (frames). The sample and frame indexes of these timestamps were detected and matched using custom-written code in MATLAB (MathWorks). Experiments were performed under a Faraday cage to block 60-Hz electrical noise.
2. Optogenetic stimulation in behaving females during suboptimal cohabitation with a male
A combined video tracking and optical stimulation system was used to stimulate mPFC afferents in the NAcc of socially behaving female voles (Extended Data Fig. 1d, e). This consisted of a custom-designed, three-chambered Plexiglas arena divided into “social” (6” × 6”), “neutral” (center; 6” × 5.5”), and “non-social” (6” × 6”) zones. The social and non-social zones contained overturned perforated cups housing a male or remaining empty, respectively. A commutator (1×2 FC-FC, 0.22 NA, Doric Lenses) and video camera (Prosilica GC, Allied Vision Technologies) were positioned over the neutral zone. The commutator interfaced the laser (100 mW, 473 nm, fixed wavelength diode module, Cobolt) and a dual fiberoptic patch cable (200 μm core, 220 μm cladding, 900 μm jacket, Doric Lenses) that plugged into the optical cannula on the female, who had free access to the three zones. The female was tracked using an automated video tracking system (RV2 Video Processor, Tucker Davis Technologies) that detected a red marker positioned directly above her head on the patch cable. Optical stimulation was automatically triggered each time she entered the social zone (RV2 Video Processor and RZ5D Bioamp Processor, Tucker Davis Technologies, see Extended Data Fig. 1d, e) and occurred at a frequency of 5 or 6 Hz with pulse duration of 5 ms for as long as she remained in the social zone. Output from the optical cannula was approximately 30 mW (approximately 15 mW per implanted fiber) based on the output from the patch cable and the transmission efficiency of the optical cannula (measured prior to implantation). The tracking accuracy for time spent in the social zone (tracked time in social zone compared to human scoring) was at least 86.8% over subjects (tracking data for one subject excluded due brief power outage causing data loss during cohabitation, see also Statistics).
On the day of experiments, the female was briefly anesthetized under isoflurane to connect the patch cable. She was then transferred to the three-chambered arena in the testing room, connected to the commutator, and allowed to habituate for 1 hour. At the same time, a non-implanted stimulus female was placed in a second, identical three-chambered arena in the same room and allowed to habituate. Two stimulus males were also brought into the room to habituate. At the end of the habituation, one stimulus male (“partner”) was placed and contained in the social zone of the implanted female's cage, and the other male (“stranger”) was placed and contained in the social zone of the non-implanted female's cage. This procedure was performed to ensure that the partner and stranger stimulus males received the same experience prior to partner preference testing.
Animals were cohabitated for 2.5 to 3 hours total. Within that period, stimulation was available for 1 hour starting from the first entrance of the implanted female into the social zone (laser disconnected at the end of this period). All subjects could therefore receive up to 1 hour of light stimulation, although the majority of animals spent some time outside of the social zone during this period and thus were not stimulated for the full hour (see Fig. 4d, top). At the end of the cohabitation, the males and non-implanted stimulus female were removed and brought back to the colony. The implanted female was briefly anesthetized to disconnect the patch cable, placed in a clean cage, and returned to the colony. Because two cohabitation experiments were often run in a given day (typically starting in morning or early afternoon), the ordering of start times was counterbalanced within each experimental group to have similar number of animals starting in the morning and early afternoon.
The following day, the implanted female was tested in a 3-hour PPT with her partner from cohabitation and a stranger stimulus male. In this test, which was performed in a different room and cage from the cohabitation, the partner male was tethered with a plastic leash to one side of a three-chambered cage and the stranger male was tethered to the opposite side, as described previously16. The female, not connected to any optical cabling, was free to move around the cage and spend time with the partner and stranger. The amount of time the female spent in low-motion social contact (huddling) with the partner and stranger was measured with a Cleversys Topscan automated tracking system (movement criterion of < 0.0416 for all subjects) and used to assess the female's preference for the partner (see Statistics). The side of the PPT cage on which the partner was tethered was counterbalanced within each experimental group to control for the partner's location in the testing room. Fresh bedding (Bed-o'Cobs Laboratory Animal Bedding ⅛”, The Andersons) was used in each test.
3. Combined electrophysiological recording and optogenetic stimulation in slice preparations of mPFC and NAcc neurons of females
Fifteen to 43 days following ChR2 virus injection, brain slices containing mPFC and/or NAcc were prepared as previously described36. Briefly, animals were decapitated under isoflurane anesthesia and brains rapidly removed and immersed in ice cold cutting solution perfused with 95% oxygen-5% carbon dioxide. Two-hundred μm-thick coronal sections containing mPFC and/or NAcc were then cut using a VTS-1000 vibrating blade microtome (Leica Microsystems). Slices were kept in oxygenated cutting solution at 32° C for 1 hour before being transferred to a recording chamber with regular artificial cerebrospinal fluid (aCSF). Slices were imaged using a Leica DM-LFS microscope (Leica Microsystems) captured with SimplePCI software (Hamamatsu Corp.) for areas of strong fluorescence within the target region of interest (mPFC or NAcc), and recordings performed as follows:
3a. NAcc
Putative medium spiny neurons were visually identified, patched with a thin-walled borosilicate glass-patch electrode, and held at -70 mV with either DC current injection in current clamp (n = 4 cells) or voltage clamp (n = 3 cells) configuration. Recording techniques and equipment were as previously described36. Excitatory post-synaptic potentials (or currents) were then evoked with optical stimulation via an optical fiber connected to a solid-state laser (Shanghai Laser & Optics Century Co.) and oriented towards the cell (200 μm core, 488 nm, 0.9-3.4 mW measured at end of fiber). Stimulus trains were either 5 Hz (6 pulses at 5 Hz, 1 ms pulse duration, repeated every 4 seconds for a total of 5 pulse trains) or individual light pulses (1 ms pulse duration, repeated every 4 seconds for a total of 5 pulses) used to compute an average electrophysiological response.
Drugs were applied by gravity perfusion at the required concentration in the circulating aCSF. Drugs used were the GABAa receptor antagonist picrotoxin (Picro; 10 μM) and the AMPA/kainate receptor antagonist 6,7-dinitroquinoxaline-2,3-dione (DNQX; 20 μM). All drugs were acquired from Tocris and stored frozen as concentrated stock solutions in distilled water (dH2O) except DNQX, which was made in 50% dimethyl sulfoxide. In recordings in the NAcc, Picro and DNQX were added serially, in that order, with recordings between applications. Following experiments, mPFC slices from the same subjects were stored for histological verification of virus expression (see Histology).
3b. mPFC
Recordings in prelimbic mPFC were performed as described above, with the exception that the recorded cells were putative pyramidal neurons and maintained at a membrane potential of -60 mV. Cells were recorded from in the presence of tetrodotoxin (TTX; 1 μM). TTX was acquired from Tocris and stored frozen as a concentrated stock solution in dH2O.
Histology
1. In vivo electrophysiology
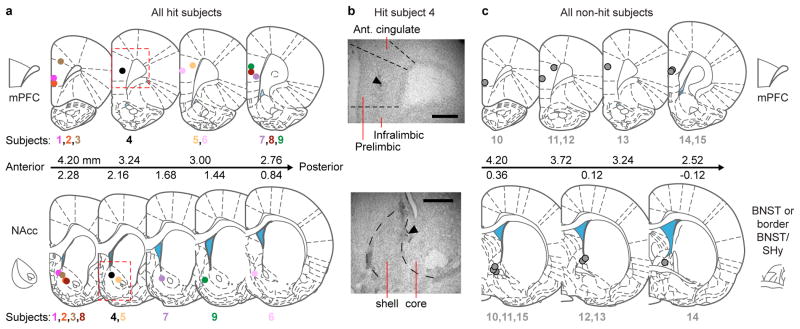
At the end of experiments, electrode-implanted females were deeply anesthetized under isoflurane and an electrolytic lesion performed at each electrode site (10 μA for 40-45 seconds, Midgard Precision Current Source, Stoelting Co.). The animals were then euthanized with carbon dioxide. The brain was removed, stored 1 to 2 days in 1× phosphate buffered saline (PBS) containing 4% paraformaldehyde (PFA) at 4° C, and transferred to 1× PBS containing 30% sucrose at 4° C until fully fixed. Forty μm-thick sections were prepared on a freezing sliding microtome (Microm). Sections were stored in cryoprotectant, mounted on slides and Cresyl Violet-stained. Slides were coverslipped and then imaged on an Eclipse E800 light microscope (Nikon Instruments). Lesion sites were identified and the section was matched to the most anatomically similar plate in the Paxinos and Watson Rat Brain Atlas14. Anatomical landmarks used to match the sections to the atlas included the morphology and position of the corpus callosum and anterior commissure. Subjects with electrodes within or on the medial border of the NAcc were included as hit subjects (n = 9; see Extended Data Fig. 2a). Subjects with electrodes posterior to the NAcc (within or bordering BNST) were included as non-hit subjects (n = 6; see Extended Data Fig. 2c).
2. In vivo optogenetics
Tissue processing: At the end of experiments, subjects were deeply anesthetized under isoflurane and transcardially perfused with 40 mL 1× PBS followed by 40 mL 4% PFA in 1× PBS at a rate of approximately 4 mL per minute. Following perfusion, brains were rapidly extracted and post-fixed overnight in 4% PFA in 1× PBS and were then transferred to 1× PBS containing 30% sucrose and 0.5% sodium azide. Forty μm-thick coronal sections were collected using a freezing sliding microtome (Microm) and were stored in 1× PBS containing 0.5% sodium azide until immunohistochemical staining.
Immunohistochemistry: All sections from both treatments were subjected to fluorescent immunohistochemical labeling for EYFP. Sections were washed in 1× PBS and blocked with 1× PBS containing 2% normal goat serum (NGS, Fitzgerald) for 1 hour before primary incubation with anti-GFP primary antibody (1:1,000, chicken polyclonal, Abcam ab13970) in 1× PBS containing 0.2% Triton-X (1× PBST) and 2% NGS for 48 hours at 4° C. Following primary incubation, sections were washed in 1× PBST and incubated in secondary antibody conjugated to a green fluorophore (1:1,000, goat polyclonal anti-chicken, Alexa Fluor 488, ab150169) for 4.5 hours in 1× PBST containing 2% NGS. Sections then underwent final washes in 1× PBS before being mounted onto slides. Slides were allowed to dry overnight and were then coverslipped with Vectashield Antifade Mounting Medium with DAPI (H-1200, Vector Labs).
Fluorescent Microscopy: Confocal images were collected using an Orca R2 cooled CCD camera (Hamamatsu Photonics) mounted on a Leica DM 5500B microscope (Leica Microsystems) equipped with a CSU10B Spinning Disk (Yokagawa Electronic Corp.) and captured with Simple PCI imaging software (Hamamatsu Photonics). Additional fluorescent images were captured using a QI Imaging Fast 1394 12-bit camera mounted on an Eclipse E800 fluorescent microscope (Nikon Instruments) and captured using MCID Imaging software.
3. Slice electrophysiology
Tissue processing: Following electrophysiological recordings in NAcc, 200 μm-thick coronal sections containing the recorded slice as well as sections from the same subject containing mPFC were stored 1 to 2 days in 1× PBS containing 4% PFA at 4° C, and transferred to 1× PBS containing 30% sucrose at 4° C until fully fixed. Immediately prior to mounting, sections were transferred into and washed in 0.1× PBS and were directly mounted onto slides. Mounted sections were allowed to dry overnight and were then coverslipped using Vectashield HardSet Antifade Mounting Medium with DAPI (Vector Labs; H-1500). Dense expression of the ChR2-EYFP transgene in both the mPFC and the NAcc was used as a criterion for inclusion and was confirmed at 60× magnification using an Eclipse E800 fluorescent microscope (Nikon Instruments) for all subjects. acquired from Tocris and stored frozen as a concentrated stock solution in dH2O.
Data Analysis
Following electrophysiology experiments, subject records (n = 15 total; 9 hit subjects, 6 non-hit subjects) were added to a custom relational database (Microsoft Excel) used to index animals during analysis. Cohabitation videos were then behaviorally scored and the corresponding neural data extracted and analyzed. Subjects were labeled as hits (1 through 9) or non-hits (10 through 15). They were ordered by the relative anterior/posterior position of their mPFC recording electrode, with “1” being the most anterior of the hit group, and “10” being the most anterior of the non-hit group.
1. Behavioral scoring
An ethogram was developed to define mating, self-grooming and huddling behaviors occurring in these experiments (see Extended Data Fig. 1c). These were then scored in experimental videos (Observer XT10) and matched to neural data using linear regression to the most adjacent timestamps (see synchronization procedure described above). For consistency and reliability in scoring, two individuals trained on a test video and scored the experimental videos blindly to each other. The percent agreement between the two scoring records of a given behavior, calculated as the percentage of total frames scored consistently for that behavior (i.e. occurring or not), was at least 97.9% for mating, 94.6% for self-grooming and 92.3% for huddling over all hit subjects and 99.5% for mating, 95.8% for self-grooming and 91.1% for huddling over all non-hit subjects. Therefore, we used the intersection of each behavior's scoring within the two records as the measure of that behavior. Contiguous segments of intersected scoring are referred to as “epochs” and are used in the following analyses of behavioral scoring.
1a. Trials
Trials were extracted from behavior epochs that were at least 5 seconds long and for which the individual scoring records started within 1 second of each other (with the exception of huddling, which used a criterion of starting within 5 seconds due to a slower onset of the behavior). Trials were defined as the first 5 seconds of the behavior epochs. Trials were further restricted to be within the 6-hr cohabitation. The number of 5-second trials of mating for all subjects were (ordered by ID) 46, 72, 22, 15, 55, 26, 12, 89, 21, 47, 23, 48, 21, 21 and 24. The number of 5-second trials of self-grooming were 47, 37, 59, 19, 21, 37, 57 ,17, 34, 49, 73, 58, 42, 42 and 11. The number of 5-second trials of huddling were 45, 24, 24, 37, 26, 48, 41, 13, 4, 51, 27, 57, 44, 14 and 25.
1b. Rasters
For cross-frequency coupling analyses, the cohabitation was broken into 2-s non-overlapping time segments. Time segments fully overlapping within an epoch of mating, self-grooming or huddling were labeled as that behavior. All remaining time segments were labeled as “other-cohab.” Time samples labeled as mating, self-grooming and other-cohab together made up “nonhuddling” time samples.
1c. Bouts
To capture sequences of a given behavior, the distances between adjacent behavior epochs were computed and pooled to create a distribution of distances. A single- or two-term natural exponential function was fit to this distribution. With a and b as the initial value and decay constant (- sign) of the first term, respectively, and c and d the initial value and decay constant of the second term, respectively, the fitted values for each behavior were as follows. The values of a for mating, self-grooming and huddling were 23320, 15222 and 5347 minutes, respectively. The values of b were 5.315, 3.089 and 3.481 minutes, respectively. The values of c were 0, 472.6 and 21.17 minutes, respectively. The values of d were 0, 0.433 and 0.133 minutes, respectively. For each behavior, the decay constant of the largest contributor to the fitted function (5.315, 3.089, 3.481 minutes for mating, self-grooming and huddling, respectively) was used as the threshold distance between epochs for inclusion within a given bout.
1d. Latency
Latency was calculated for each behavior as the delay from a given reference point within the experiment (e.g. start of cohabitation) to a later reference point within a behavior (e.g. bout start).
1e. Duration
For each behavior, epochs within a given time window (e.g. full cohabitation, smaller time windows) were pooled to compute the duration of that behavior.
2. Local field potential data
LFP data were extracted for trials of each behavior and inspected for data quality. We had previously observed in early testing of the Neurologger that, due to its fixed amplification settings, data traces could sometimes hit the upper or lower bounds of the visualization range and become clipped at these bounds. Therefore, as a pre-determined criterion for inclusion in LFP analyses using windowed data (i.e. trials in Granger causality and coherence analyses; moving windows in cross-frequency coupling analyses, as described below), only those windows whose values were contained within the visualization range were used. Further, subject 7 had a brief, 12.7-second disruption in data recording and so this data segment was excluded from LFP analyses. In coherence and Granger causality analyses, the total number of 5-second trials excluded for mating (ordered by ID) were 31, 16, 0, 4, 19, 6, 11, 10, 44, 4, 0, 16, 1, 4 and 17 (median of 18.8% of original number of mating trials). The total number of 5-second trials excluded for self-grooming were 19, 8, 35, 32, 39, 9, 21, 22, 23, 36, 41, 30, 70, 28 and 67 (median of 40.0% of original number of self-grooming trials). The total number of 5-second trials excluded for huddling were 2, 1, 4, 4, 6, 2, 0, 0, 2, 0, 5, 0, 0, 0 and 2 (median of 4.0% of original number of huddling trials). In cross-frequency coupling analyses, the percentage of 2-second windows excluded were 10.9, 9.9, 11.5, 24.4, 28.0, 15.4, 11.6, 15.5, 23.5, 20.1, 13.8, 9.0, 15.8, 12.0 and 27.7% (median of 15.4% of original number of windows). The original number of windows ranged from 11,176 to 12,642 (median of 12,613).
Coherence, Granger causality and cross-frequency coupling were computed between brain regions. All analyses were done in MATLAB unless otherwise noted.
2a. Coherence
Coherence analyses were performed using multitaper methods37 implemented in Chronux (http://chronux.org)38. This consisted of multiplying each data segment by a set of orthogonal Slepian tapers39 that specify a spectral concentration bandwidth ± W. W and the segment duration (T) constrain the maximum number of effectively-concentrating tapers to be less than or equal to 2TW-1. Parameters used here were W = 2 Hz, T = 1 second, and 3 tapers. Coherence was then calculated as the magnitude of the coherency40. Coherence ranges from 0 to 1, where a value of 1 represents a perfectly consistent phase and amplitude relationship across tapers and trials.
Coherence estimates were sampled at 1-Hz resolution from 3 Hz to 242 Hz (Subject 3) or 3 Hz to 97 Hz (remaining subjects). This range represents the nearest integer above W that is consistent across subjects to the nearest integer below the (Nyquist frequency - W).
Inter-behavior comparisons
Coherence was compared between 5-s trials of mating, self-grooming and huddling (number of trials listed in Data Analysis, 1a.). To address the possibility of non-stationarity in the data, each trial was split into 40, 1-second segments stepped by 0.1 seconds. Coherence was calculated across trials for each time segment, giving 40 estimates for a given behavior. These estimates were transformed and bias-corrected, as described in Statistics. They were then averaged to give full-trial estimates of a given behavior. Statistical testing was performed on these averages. In addition, the 2.5 to 97.5 percentile range of the 40 estimates was extracted as a measure of variability (prctile function in MATLAB).
2b. Cross-frequency coupling
Cross-frequency coupling was computed using the Modulation Index (MI)41 metric (code courtesy of Dr. Adriano Tort and Dr. Teresa Madsen). The MI quantifies the extent to which low-frequency phase of one signal modulates higher-frequency amplitude of another. Briefly, the two signals are filtered in low and high-frequency bands and then Hilbert transformed to obtain the phase and amplitude envelope, respectively. This gives matched phase and amplitude values that are then binned into 20° phase bins. Amplitudes are averaged within each phase bin, giving a distribution of amplitudes over phase bins. This distribution is normalized to the sum of averaged amplitudes. The MI is computed as the normalized Kullback-Leibler distance of this distribution from a uniform (flat/unmodulated) distribution.
The MI was computed over the course of the experiment for each subject (“MI raster”). The baseline and cohabitation periods were broken into 5-s or 2-s non-overlapping time segments. 5-s segments were used to analyze the spectrum of the MI, and 2-s segments were used to relate the MI to behavior (see below). The MI was computed on each segment in two directions: 1) mPFC low-frequency phase modulating NAcc (or off-target) gamma amplitude and 2) NAcc (or off-target) low-frequency phase modulating mPFC gamma amplitude. This consisted of switching which signals were low- or high-frequency filtered (filtering done using EEGLAB42 package for MATLAB, eegfilt function).
5-s time segments (MI spectrum)
MI was computed at multiple combinations of phase and amplitude frequencies. Phase frequencies ranged from 3 to 21 Hz, with integer spacing and bandwidth ± 0.5 Hz. Amplitude frequencies ranged from 32 to 84 Hz, with spacing of 4 Hz and bandwidth ± 2 Hz. To measure the relative strength of MI in the mPFC-to-NAcc direction (“net modulation”) at a given phase/amplitude frequency combination, the MI computed for the NAcc-to-mPFC direction was subtracted from that of the mPFC-to-NAcc direction. The net modulation was averaged across all time segments and hit animals to identify the frequency combination producing maximal net modulation. The same analysis was performed on non-hit animals.
2-s time segments (MI and behavior)
Net modulation was computed at a phase frequency of 5 Hz and amplitude frequency of 80 Hz. These time segments were matched to raster time samples coded as specific behaviors (see Data Analysis, 1b.) and averaged across values coded as the same behavior to estimate the net modulation during that behavior. Averages were taken over the full cohabitation as well as shorter time segments (e.g. within first or last mating bout).
2c. Granger causality
Granger causality was computed with parametric methods43,44 implemented in code by Dr. Stijn de Waele and Dr. Nathan J. Killian and adapted to use by V.S. and E.A.A. Granger causality tests the degree to which previous values of one time series improve the prediction of a different time series45 and was used here to assess the directional influence of one brain area over another's activity46 during mating. Granger causality can be formulated in the frequency domain by fitting and frequency-transforming a bivariate autoregressive model to the two time series43 (here, mPFC and NAcc LFPs during mating). The power of each time series can then be estimated and decomposed into an intrinsic component and a causal component contributed by the other time series. Granger causality is computed as the natural log of the ratio of the total power (intrinsic + causal) to the intrinsic power.
To fit the autoregressive model, the average values of the time series were subtracted out to produce means of 0 and model parameters estimated using the Nuttall-Strand method. The model order was selected using the Combined Information Criterion47.
Granger causality was compared in the mPFC-to-NAcc and NAcc-to-mPFC directions during mating (see Statistics). As in the coherence estimates, 5-second trials of mating were split into 40, 1-second segments shifted by 0.1 seconds. Granger causality was computed on each segment (see below) at integer frequencies from 0 Hz to 244 Hz (Subject 3) or to 99 Hz (all other subjects), and then averaged over segments to get a full-trial estimate. The 2.5 to 97.5 percentile range of the 40 estimates was extracted as a measure of variability. The upper bound of the frequency range represents the nearest integer below the Nyquist frequency.
Granger causality was calculated using a bootstrapping procedure. Briefly, for a subject with n trials of mating, n segments matched in time were extracted from the trials. 1000 artificial sets of n segments were generated by randomly selecting with replacement from possible segments. Autoregressive model parameters were averaged across segments in each set, and these average values used to compute Granger causality in the two directions. The actual Granger causality values were defined as the mean over all sets.
2d. Code availability
MATLAB code written to analyze local field potential data in this study is available from the corresponding author (R.C.L.) upon reasonable request.
Statistics
Statistical tests used a significance level α = 0.05 (* P < 0.05, ** P < 0.01, *** P < 0.001). Statistical analyses were performed separately on hit (n = 9) and non-hit (n = 6) groups.
Correlation analyses used the Pearson correlation (corr in MATLAB) and report R2 and P-values. Linear regression was performed using the polyfit function in MATLAB.
In tests of paired samples, a two-sided Lilliefors test (lillietest in MATLAB) was used to test the normality of the difference between samples. This test was also used to test the normality of individual groups for ANOVAs. Since this test is less sensitive to small sample sizes, data were also visually inspected for any obvious skew. Parametric (two-tailed t- and ANOVA) tests were used when justified by these analyses.
The Bonferroni method was used to correct for multiple comparisons. The number of corrections and other figure-specific statistical methods are described below. P-values are not corrected unless otherwise specified.
Fig. 1
To compare mPFC-NAcc coherence between mating, self-grooming and huddling, the 40 within-trial coherence estimates for each of these behaviors were first Fisher-transformed. They were then bias-corrected for different sample sizes (here: number of trials of each behavior), as described48. Upon averaging these 40 estimates to get a full-trial estimate, the peak frequency of mating coherence was determined for each subject (ranged from 4 to 6 Hz), and the mode of these frequencies across subjects (5 Hz) was used for inter-subject comparisons. The effect of behavior on coherence was tested using a one-way repeated measures ANOVA with behavior as the within-subject factor (SPSS). Sphericity was verified using Mauchly's Test (SPSS, W = 0.60, P = 0.167). The difference in coherence between 1) mating and self-grooming, 2) mating and huddling coherence and 3) self-grooming and huddling at 5 Hz was tested for significance using a post hoc two-tailed paired t-test (ttest in MATLAB), with correction for 3 comparisons.
The same analysis was performed on non-hit animals, with coherence evaluated at 5 Hz. Sphericity was verified using Mauchly's Test (W = 0.62, P = 0.380).
Fig. 2
The effect of behavior (huddling, baseline, nonhuddling) on mPFC-NAcc net modulation was tested using a one-way repeated measures ANOVA with behavior as the within-subject factor (SPSS). Sphericity was violated (Mauchly's Test; W = 0.36, P = 0.028) and so the Greenhouse-Geisser correction was applied. The difference in net modulation between 1) nonhuddling and huddling, 2) nonhuddling and baseline and 3) huddling and baseline was tested for significance using a post hoc two-tailed paired t-test (ttest in MATLAB), with correction for 3 comparisons. The same ANOVA analysis was performed on non-hit animals, with Greenhouse-Geisser correction applied due to violation of sphericity (Mauchly's Test; W = 0.05, P = 0.003).
Fig. 3
Correlations between huddling latency and nonhuddling net modulation during the baseline period, first 60 minutes of cohabitation and full cohabitation were corrected for 3 comparisons.
A permutation test was used to test whether the correlation between huddling latency and nonhuddling net modulation significantly improved from before to after mating. The before time point was that immediately before mating. The after time point was that which produced the highest correlation between net modulation and huddling latency within 3.5 min after mating (see Fig. 3g, o; bracket indicates before and after points). Briefly, at both before and after time points, net modulation values were randomized across subjects (using datasample in MATLAB; same randomized IDs used in before and after time points) and then correlated with the huddling latency (kept in subject order). The difference in R2 (abs. value) between these two correlations was then computed. This re-sampling procedure was repeated 1×10⁶ times to produce a permuted (null) distribution of R2 differences. A two-sided P-value was obtained as the proportion of shuffled R2 differences that were greater than the observed value.
Fig. 4
In optogenetics analyses, the relative time spent with the partner in the PPT (partner time minus stranger time) was compared between treatment (expressing ChR2) and control (expressing control fluorophore lacking ChR2) groups using a permutation test. This test was chosen due to normality violations in group and residual values (discouraging an ANOVA approach). The permutation test involved calculating the effect size (Cohen's d49 (abs. value)) of the difference between treatment and control groups in the relative time spent with the partner. This observed Cohen's d was then compared to a permuted distribution of Cohen's d values created by randomly assigning data values without replacement to treatment and control groups (using randperm in MATLAB). The re-sampling procedure was performed 1×10⁶ times. A two-sided P-value was obtained as the proportion of shuffled Cohen's d values that were greater than the observed value.
The same permutation approach was used to compare the total duration of optical stimulation as well as time spent in the social, neutral and non-social zones (see Extended Data Fig. 1d) during cohabitation between treatment and control groups. Due to a brief power outage after the optical stimulation period for one control animal, video and tracking data for that subject was lost even though it received normal stimulation. Therefore, the number of control subjects used in the optical stimulation and zone analyses is one less than that used in the PPT analyses described above (n = 10 as opposed to 11).
Extended Data Fig. 3
The number of bouts, duration and latency of mating, self-grooming and huddling were compared between hit and non-hit groups using Wilcoxon signed-rank tests (signrank in MATLAB). P-values were corrected for 9 comparisons.
Correlations between huddling latency and mating and self-grooming duration and latency parameters were corrected for 8 comparisons.
The effect of behavior on latency was tested using a Friedman Test due to violations of normality. The difference in latency between 1) mating and self-grooming, 2) mating and huddling and 3) self-grooming and huddling was tested for significance using a post hoc Wilcoxon signed-rank test, with correction for 3 comparisons.
Extended Data Fig. 5
To compare Granger causality in the mPFC-to-NAcc and NAcc-to-mPFC directions, Granger causality values in each direction were obtained for each subject at 5 Hz, the same frequency used in coherence comparisons. The difference of the two directions (mPFC-to-NAcc - NAcc-to-mPFC) across subjects was tested for significance using a two-tailed paired t-test.
Extended Data Fig. 7
To calculate the mean net modulation during early and late mating for each subject, net modulation values coded as mating were taken from that subject's first and last mating bouts, respectively, and then averaged. The number of values within the first bout were (in subject order): 19, 41, 38, 25, 62, 24, 22, 101, 84, 36, 20, 22, 10, 21 and 31. The number of values within the last bout were (in subject order): 48, 52, 24, 26, 70, 34, 35, 57, 38, 45, 33, 33, 20, 24 and 25. To calculate the mean net modulation during early and late self-grooming for each subject, net modulation values coded as self-grooming were taken from that subject's start (moving forward) or end (moving backward) of the cohabitation. The number of self-grooming values were matched to that subject's first and last mating bout (listed above), respectively. The difference of early and late mean net modulation for each behavior across subjects was performed using a Wilcoxon signed-rank test and Bonferroni-corrected for 2 comparisons.
Extended Data Fig. 8
The same permutation test described for Fig. 3 was used to test whether the correlation between huddling latency and nonhuddling net modulation significantly improved from before to after self-grooming (panels e, i).
Data Availability
The data that support the findings of this study are available from the corresponding author (R.C.L.) upon reasonable request. Source data for all figures with graphical representations are provided with the paper.
Extended Data
Extended Data Figure 1. Preparations for electrophysiological and optogenetic experiments.
a, Neurologger recording device secured to a female during cohabitation with a male. Neurologger interfaces with a chronic electrode implant targeting mPFC and NAcc. b, Schematic of experimental setup. Simultaneous video and neural recording is synchronized by periodic timestamps. c, Summarized ethogram definitions of mating, self-grooming and huddling used to score experimental videos. d, Arena used for cohabitation in optogenetics experiments. Arena is divided into social, neutral, and non-social zones. Food is placed in the center of the neutral zone. Male is contained under a cup in the social zone, and female, implanted with optical fibers, is allowed to freely explore the arena. Optical stimulation is triggered whenever she is in the social zone (green hatched area; red circle is visualization of tracking) for up to 1 hour within the cohabitation period. Social zone is defined as consistently as possible across experiments based on physical features of arena. e, Schematic of cohabitation setup, additionally showing how laser is controlled by video recording to automatically deliver optical stimulation when female is in the social zone.
Extended Data Figure 2. Placement of local field potential electrodes in all subjects.
a, Electrodes in hit subjects (n = 9) targeting mPFC and NAcc, b, verified with electrolytic lesions (scale bar, 500 μm). Anterior/posterior locations of brain sections (units of rat brain atlas; see Methods) are indicated. c, Electrodes in non-hit subjects (n = 6) targeting mPFC and posterior to NAcc (within/bordering BNST). SHy: septohypothalamic nucleus. The rat brain in this and other figures has been reproduced with permission from [14].
Extended Data Figure 3. Behavioral characterization of hit and non-hit subjects.
a, Number of bouts, total duration, and latency for mating, self-grooming and huddling in hit (n = 9) and non-hit (n = 6) subjects. No significant differences exist between subject groups (all P > 0.05). b, Measures of mating and self-grooming duration and latency do not correlate with huddling latency (n = 15; all P > 0.05). “Percent M [or SG] before Hud latency” refers to percentage of time each animal spent mating or self-grooming prior to reaching its huddling latency. c, Latency is modulated across behaviors (n = 15; χ2(2) = 18.53, P < 0.001, Friedman Test), with mating and self-grooming showing shorter latencies compared to huddling but similar latencies to each other (SG vs. Hud, P < 0.001; M vs. Hud, P = 0.001; M vs. SG, P = 0.454, Wilcoxon signed-rank). Reported P-values in a-c are Bonferroni-corrected for multiple comparisons (see Methods). Boxplots show median and interquartile range.
Extended Data Figure 4. Net modulation data for all subjects.
Net modulation values (2-s, non-overlapping windows) sampled over a baseline solo period (gold points) and 6-hr cohabitation for all hit (#1-9) and non-hit (#10-15) subjects. Values that temporally overlap with mating, self-grooming and huddling behaviors (top hashes) are color-coded accordingly. All non-scored values are indicated as “other-cohab,” which together with mating and self-grooming represent “nonhuddling” values. Cumulative distributions of net modulation values coded by behavior are shown in right panel for each subject.
Extended Data Figure 5. Granger causality in mPFC-NAcc circuit during mating.
a, Granger causality spectra in the mPFC-to-NAcc and NAcc-to-mPFC directions for example subject. Solid lines and shaded regions show mean and mid-95 percentile range, respectively, of the n = 40 Granger causality estimates for a given brain-area direction (see Methods). b, Comparison of Granger causality at 5 Hz in the two directions across hit subjects (n = 9). Granger causality is significantly higher in the mPFC-to-NAcc direction (t8 = 3.29, P = 0.011). Error bars show mean ± s.e.m.
Extended Data Figure 6. Specificity of correlation between nonhuddling net modulation and huddling latency.
a, Mean huddling net modulation is uncorrelated with huddling latency in hits and (b) non-hits (all P > 0.05). c, Mean nonhuddling net modulation is uncorrelated with electrode placement (mPFC anterior (A)-posterior (P) location or NAcc/non-hit medial (M)-lateral (L) location; units of rat brain atlas) in both hits (n = 9) and (d) non-hits (n = 6) (all P > 0.05). e, Mean nonhuddling net modulation is uncorrelated with mating and self-grooming latency and total duration in hits and (f) non-hits (all P > 0.05).
Extended Data Figure 7. Net modulation during early and late mating and self-grooming.
a, Mean net modulation during mating increases over time in hits (n = 9, P = 0.008) but not (b) non-hits (n = 6, P = 0.438). c, Mean net modulation during self-grooming shows no significant change in either hits (P = 0.406) or (d) non-hits (P = 0.438). P-values in a-d are Bonferroni-corrected for multiple comparisons (see Methods). Mean early and late values for mating are derived from the first and last mating bouts. Mean values for self-grooming are derived from early and late self-grooming samples matched in number to the first and last mating bouts (see Methods). Boxplots show median and interquartile range.
Extended Data Figure 8. Behavioral specificity of correlation between local change in net modulation around mating and huddling latency.
a, Mean nonhuddling (NHud) net modulation values within 1 min moving windows (stepped by 0.1 min) before (SG-) and after (SG+) the first self-grooming bout of hits (n = 9) and (h) non-hits (n = 6). Each subject's values are color-coded by that subject's latency to huddle from the end of the self-grooming bout (latencySG+). b, Change in mean net modulation from immediately before to after the first self-grooming bout (indicated by line segments in a) is uncorrelated with huddling latencySG+ in hits (R2 = 0.01, P = 0.787) and (g) non-hits (R2 = 0.27, P = 0.290; line segments in h). c, Strength of correlation between mean net modulation and huddling latencySG+ shows no consistent increase in either hits or (j) non-hits. d, e, Subtracting out the mean baseline net modulation from the local values around self-grooming confirms no significant increase in correlation strength in either hits (P = 0.164; permutation test on difference in R2 (0.27) between bracketed time points) or (i, l) non-hits (P = 0.655, observed R2 difference of 0.07). f, Change in mean net modulation from immediately before to after first self-grooming bout is uncorrelated with mean NHud net modulation in the 15 min after self-grooming in hits (R2 = 0.24, P = 0.180) and (k) non-hits (R2 = 0.55, P = 0.090). m, Change in net modulation around first mating bout (Fig. 3e, j x-axis) is uncorrelated with local behavioral parameters (change in self-grooming duration around bout and mating duration within bout) in hits and (o) non-hits (all P > 0.05). It is further uncorrelated with the latency to next mating or self-grooming bouts (n, p) and the mean net modulation during the baseline solo period (q, r) in hits and non-hits (all P > 0.05).
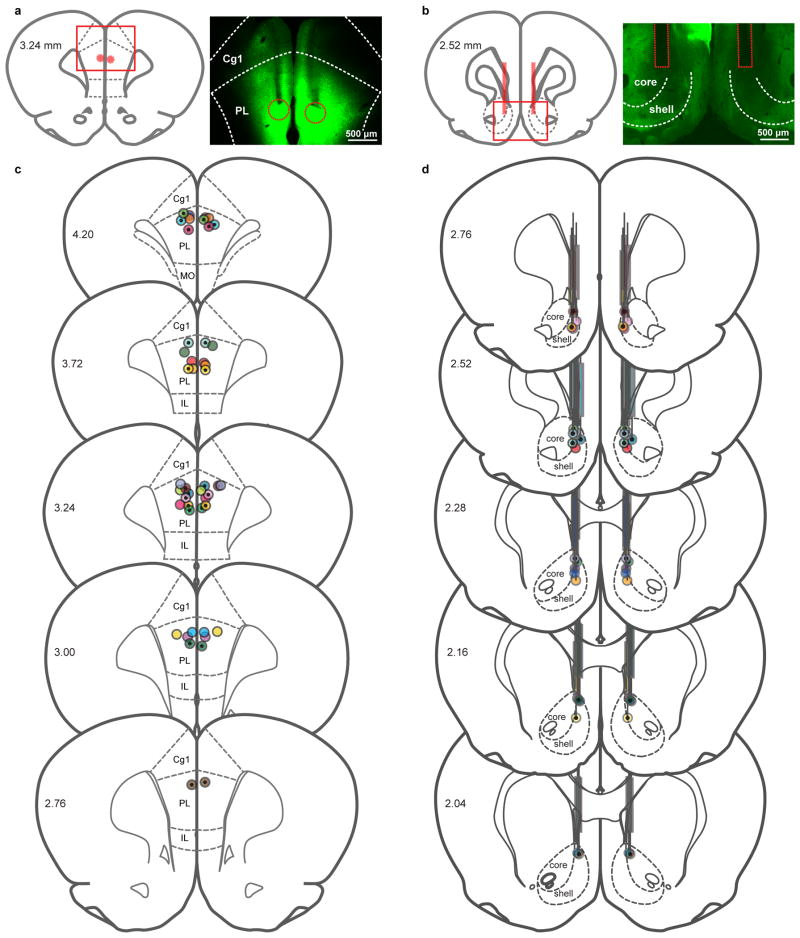
Extended Data Figure 9. Validation of virus injection and optical implant locations.
a, Representative coronal sections showing estimated centers of bilateral virus injection and (b) optical implant placement for in vivo optogenetics subjects. Virus injection localization was based on minor tissue damage at dorsal-most surface of the coronal section where injection syringe initially entered the brain, the densest concentration of fluorescence and physical tracts of damage left by injection syringe. Optical implant localization was based on physical tracts of damage left by optical implant. Morphology of corpus callosum was used to determine anterior/posterior position of injections and implants. c, Virus injection and (d) optical implant locations for all in vivo optogenetics subjects. ChR2-expressing subjects (n = 12) are indicated by circles with dotted centers. Control subjects (n = 11) are indicated by circles with empty centers. Each color is a separate subject, with two circles per subject (bilateral injection and optical implant). All injection center locations fall within the prelimbic cortex and all optical implant locations fall within the medial NAcc. In a-d, the anterior/posterior location of each section (units of rat brain atlas) is indicated on left-hand side of section. IL: infralimbic cortex; MO: medial orbital cortex.
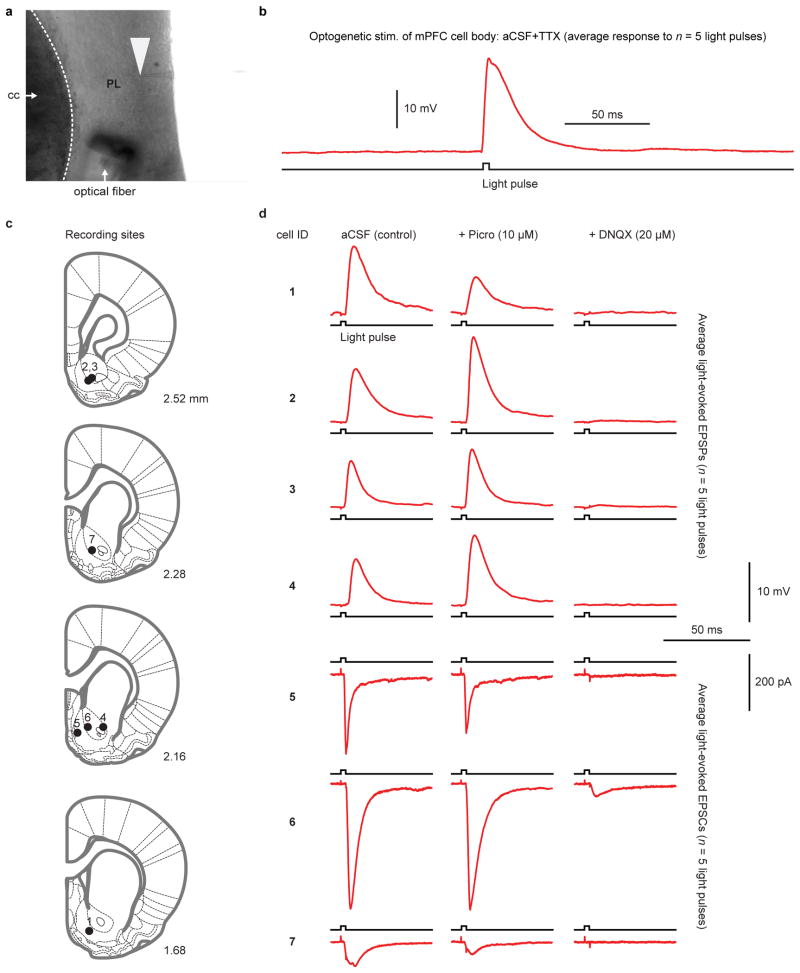
Extended Data Figure 10. Validation of light-induced electrophysiological responses in mPFC and NAcc.
a, Representative image of whole-cell patch clamp recording from a prelimbic mPFC neuron cell body in slice preparation. Recording electrode (tip denoted with white arrowhead) is patched onto a cell, and an optical fiber is oriented towards the cell for optogenetic stimulation. b, Example light-evoked potential (average response to 5, 1 ms light pulses; see Methods) in a prelimbic mPFC neuron in the presence of tetrodotoxin (TTX; 1 μM) to show a direct effect of light stimulation. c, Whole-cell patch clamp recordings were obtained from n= 7 putative medium spiny neurons (from 4 subjects) in NAcc. Anterior/posterior location of each section (units of rat brain atlas) indicated on bottom-right of section. d, Average electrophysiological responses (excitatory post-synaptic potentials (EPSPs; cells 1-4) or currents (EPSCs; cells 5-7)) to 5, 1 ms light pulses delivered onto the cell. Application of Picro (second column) had no consistent effect on electrophysiological responses, whereas DNQX (third column) disrupted them, indicating that electrophysiological responses were due to glutamatergic transmission. cc: corpus callosum.
Acknowledgments
We thank Dr. Hans-Peter Lipp for Neurologgers; Dr. Frank Lin for initial testing of Neurologgers; Dr. Joseph Manns, Dr. Gordon Berman and Dr. Teresa Madsen for methodological feedback and fruitful discussions on the manuscript; Gerald Wong for behavioral scoring; Mengqi Zhang, Rasika Tangutoori and Rachel Stanford for assistance with implant design and construction; the Liu, Young and Rainnie laboratories for training, manuscript feedback and helpful discussions; Lorra Matthews and the Yerkes animal care and veterinary staff for vole husbandry and care; Garrett Feldpausch for custom cage design and machining; and Dr. Jamie LaPrairie and Li-Ling Shen for their assistance. This work was funded by an Emory Neuroscience Initiative grant (R.C.L., L.J.Y.), NIMH R21MH97187 (R.C.L.), NIMH P50MH100023 (L.J.Y., R.C.L.), NINDS R90DA033462 (V.S.), Emory University Biology Graduate Student Award (E.A.A.) and Office of Research Infrastructure Programs' Primate centers P51OD11132 (YNPRC).
Footnotes
Author Contributions: E.A.A. adapted the Neurologger to a vole preparation and designed and performed in vivo electrophysiology experiments, which motivated an optogenetics approach; Optogenetics experiments were designed and performed by E.A.A. and Z.V.J., assisted by Y.K.; Z.V.J. validated viral techniques and performed optogenetics surgeries and histology; S.J.R. and E.A.A. designed slice electrophysiology experiments; Z.V.J. performed all surgeries and histology for slice electrophysiology experiments; S.J.R. performed slice electrophysiology experiments, assisted and supervised by E.A.A and D.G.R, respectively. E.A.A., Z.V.J., Y.K., S.J.R., H.W., A.C.S., V.S. and W.D.M. analyzed data; E.A.A. drafted the manuscript; Z.V.J., A.C.S., Y.K., S.J.R., H.W. and V.S. contributed to the writing; R.C.L. and L.J.Y. edited the manuscript and supervised all aspects of the study.
Reprints and permissions information is available at www.nature.com/reprints.
The authors declare no competing financial interests.
References
- 1.Hazan C, Shaver P. Romantic love conceptualized as an attachment process. J Pers Soc Psychol. 1987;52:511–524. doi: 10.1037//0022-3514.52.3.511. [DOI] [PubMed] [Google Scholar]
- 2.Bartels A, Zeki S. The neural basis of romantic love. Neuroreport. 2000;11:3829–3834. doi: 10.1097/00001756-200011270-00046. [DOI] [PubMed] [Google Scholar]
- 3.Young LJ, Lim MM, Gingrich B, Insel TR. Cellular mechanisms of social attachment. Horm Behav. 2001;40:133–138. doi: 10.1006/hbeh.2001.1691. [DOI] [PubMed] [Google Scholar]
- 4.Aragona BJ, et al. Nucleus accumbens dopamine differentially mediates the formation and maintenance of monogamous pair bonds. Nat Neurosci. 2006;9:133–139. doi: 10.1038/nn1613. [DOI] [PubMed] [Google Scholar]
- 5.Ross HE, et al. Variation in oxytocin receptor density in the nucleus accumbens has differential effects on affiliative behaviors in monogamous and polygamous voles. J Neurosci. 2009;29:1312–1318. doi: 10.1523/JNEUROSCI.5039-08.2009. [DOI] [PMC free article] [PubMed] [Google Scholar]
- 6.Johnson ZV, et al. Central oxytocin receptors mediate mating-induced partner preferences and enhance correlated activation across forebrain nuclei in male prairie voles. Horm Behav. 2016;79:8–17. doi: 10.1016/j.yhbeh.2015.11.011. [DOI] [PMC free article] [PubMed] [Google Scholar]
- 7.Young LJ, Wang Z. The neurobiology of pair bonding. Nat Neurosci. 2004;7:1048–1054. doi: 10.1038/nn1327. [DOI] [PubMed] [Google Scholar]
- 8.Kleiman DG. Monogamy in mammals. Q Rev Biol. 1977;52:39–69. doi: 10.1086/409721. [DOI] [PubMed] [Google Scholar]
- 9.Christie MJ, Summers RJ, Stephenson JA, Cook CJ, Beart PM. Excitatory amino acid projections to the nucleus accumbens septi in the rat: a retrograde transport study utilizing D[3H]aspartate and [3H]GABA. Neuroscience. 1987;22:425–439. doi: 10.1016/0306-4522(87)90345-9. [DOI] [PubMed] [Google Scholar]
- 10.Ross HE, et al. Characterization of the oxytocin system regulating affiliative behavior in female prairie voles. Neuroscience. 2009;162:892–903. doi: 10.1016/j.neuroscience.2009.05.055. [DOI] [PMC free article] [PubMed] [Google Scholar]
- 11.Nicola SM. The nucleus accumbens as part of a basal ganglia action selection circuit. Psychopharmacology. 2007;191:521–550. doi: 10.1007/s00213-006-0510-4. [DOI] [PubMed] [Google Scholar]
- 12.Floresco SB. The nucleus accumbens: an interface between cognition, emotion, and action. Annu Rev Psychol. 2015;66:25–52. doi: 10.1146/annurev-psych-010213-115159. [DOI] [PubMed] [Google Scholar]
- 13.Block AE, Dhanji H, Thompson-Tardif SF, Floresco SB. Thalamic–prefrontal cortical–ventral striatal circuitry mediates dissociable components of strategy set shifting. Cereb Cortex. 2007;17:1625–1636. doi: 10.1093/cercor/bhl073. [DOI] [PubMed] [Google Scholar]
- 14.Paxinos G, Watson C. The Rat Brain in Stereotaxic Coordinates. Compact 6th. Academic Press; 2009. [Google Scholar]
- 15.Williams JR, Catania KC, Carter CS. Development of partner preference in female prairie voles: the role of social and sexual experience. Horm Behav. 1992;26:339–349. doi: 10.1016/0018-506x(92)90004-f. [DOI] [PubMed] [Google Scholar]
- 16.Ahern TH, Modi ME, Burkett JP, Young LJ. Evaluation of two automated metrics for analyzing partner preference tests. J Neurosci Methods. 2009;182:180–188. doi: 10.1016/j.jneumeth.2009.06.010. [DOI] [PMC free article] [PubMed] [Google Scholar]
- 17.Lim MM, et al. Enhanced partner preference in a promiscuous species by manipulating the expression of a single gene. Nature. 2004;429:754–757. doi: 10.1038/nature02539. [DOI] [PubMed] [Google Scholar]
- 18.Bagot RC, et al. Ventral hippocampal afferents to the nucleus accumbens regulate susceptibility to depression. Nat Commun. 2015;6:7062. doi: 10.1038/ncomms8062. [DOI] [PMC free article] [PubMed] [Google Scholar]
- 19.Britt JP, et al. Synaptic and behavioral profile of multiple glutamatergic inputs to the nucleus accumbens. Neuron. 2012;76:790–803. doi: 10.1016/j.neuron.2012.09.040. [DOI] [PMC free article] [PubMed] [Google Scholar]
- 20.Buzsáki G, Wang XJ. Mechanisms of gamma oscillations. Annu Rev Neurosci. 2012;35:203–225. doi: 10.1146/annurev-neuro-062111-150444. [DOI] [PMC free article] [PubMed] [Google Scholar]
- 21.Kalenscher T, Lansink CS, Lankelma JV, Pennartz CMA. Reward-associated gamma oscillations in ventral striatum are regionally differentiated and modulate local firing activity. J Neurophysiol. 2010;103:1658–1672. doi: 10.1152/jn.00432.2009. [DOI] [PubMed] [Google Scholar]
- 22.van der Meer MA, Redish AD. Low and high gamma oscillations in rat ventral striatum have distinct relationships to behavior, reward, and spiking activity on a learned spatial decision task. Front Integr Neurosci. 2009;3:9. doi: 10.3389/neuro.07.009.2009. [DOI] [PMC free article] [PubMed] [Google Scholar]
- 23.Berke JD. Fast oscillations in cortical-striatal networks switch frequency following rewarding events and stimulant drugs. Eur J Neurosci. 2009;30:848–859. doi: 10.1111/j.1460-9568.2009.06843.x. [DOI] [PMC free article] [PubMed] [Google Scholar]
- 24.Lakatos P, et al. An oscillatory hierarchy controlling neuronal excitability and stimulus processing in the auditory cortex. J Neurophysiol. 2005;94:1904–1911. doi: 10.1152/jn.00263.2005. [DOI] [PubMed] [Google Scholar]
- 25.Tort AB, et al. Dynamic cross-frequency couplings of local field potential oscillations in rat striatum and hippocampus during performance of a T-maze task. Proc Natl Acad Sci USA. 2008;105:20517–20522. doi: 10.1073/pnas.0810524105. [DOI] [PMC free article] [PubMed] [Google Scholar]
- 26.Ragozzino ME, Kim J, Hassert D, Minniti N, Kiang C. The contribution of the rat prelimbic-infralimbic areas to different forms of task switching. Behav Neurosci. 2003;117:1054–1065. doi: 10.1037/0735-7044.117.5.1054. [DOI] [PubMed] [Google Scholar]
- 27.Jutras MJ, Buffalo EA. Synchronous neural activity and memory formation. Curr Opin Neurobiol. 2010;20:150–155. doi: 10.1016/j.conb.2010.02.006. [DOI] [PMC free article] [PubMed] [Google Scholar]
- 28.Trimper JB, Stefanescu RA, Manns JR. Recognition memory and theta–gamma interactions in the hippocampus. Hippocampus. 2014;24:341–353. doi: 10.1002/hipo.22228. [DOI] [PMC free article] [PubMed] [Google Scholar]
- 29.Stuber GD, et al. Excitatory transmission from the amygdala to nucleus accumbens facilitates reward seeking. Nature. 2011;475:377–380. doi: 10.1038/nature10194. [DOI] [PMC free article] [PubMed] [Google Scholar]
- 30.Okuyama T, Kitamura T, Roy DS, Itohara S, Tonegawa S. Ventral CA1 neurons store social memory. Science. 2016;353:1536. doi: 10.1126/science.aaf7003. [DOI] [PMC free article] [PubMed] [Google Scholar]
- 31.Gruber AJ, Hussain RJ, O'Donnell P. The nucleus accumbens: a switchboard for goal-directed behaviors. PLoS ONE. 2009;4:e5062. doi: 10.1371/journal.pone.0005062. [DOI] [PMC free article] [PubMed] [Google Scholar]
- 32.Vertes RP. Differential projections of the infralimbic and prelimbic cortex in the rat. Synapse. 2004;51:32–58. doi: 10.1002/syn.10279. [DOI] [PubMed] [Google Scholar]
- 33.Gutman DA, et al. A DTI tractography analysis of infralimbic and prelimbic connectivity in the mouse using high-throughput MRI. NeuroImage. 2012;63:800–811. doi: 10.1016/j.neuroimage.2012.07.014. [DOI] [PMC free article] [PubMed] [Google Scholar]
- 34.Donaldson ZR, Spiegel L, Young LJ. Central vasopressin V1a receptor activation is independently necessary for both partner preference formation and expression in socially monogamous male prairie voles. Behav Neurosci. 2010;124:159–163. doi: 10.1037/a0018094. [DOI] [PMC free article] [PubMed] [Google Scholar]
- 35.Etholm L, Arabadzisz D, Lipp HP, Heggelund P. Seizure logging: a new approach to synchronized cable-free EEG and video recordings of seizure activity in mice. J Neurosci Methods. 2010;192:254–260. doi: 10.1016/j.jneumeth.2010.08.003. [DOI] [PubMed] [Google Scholar]
- 36.Ryan SJ, et al. Spike-timing precision and neuronal synchrony are enhanced by an interaction between synaptic inhibition and membrane oscillations in the amygdala. PLoS ONE. 2012;7:e35320. doi: 10.1371/journal.pone.0035320. [DOI] [PMC free article] [PubMed] [Google Scholar]
- 37.Mitra PP, Pesaran B. Analysis of dynamic brain imaging data. Biophys J. 1999;76:691–708. doi: 10.1016/S0006-3495(99)77236-X. [DOI] [PMC free article] [PubMed] [Google Scholar]
- 38.Mitra P, Bokil H. Observed Brain Dynamics. Oxford Univ. Press; 2008. [Google Scholar]
- 39.Slepian D, Pollack HO. Prolate spheroidal wave functions, Fourier analysis and uncertainty - I. Bell Syst Tech J. 1961;40:43–63. [Google Scholar]
- 40.Jutras MJ, Fries P, Buffalo EA. Gamma-band synchronization in the macaque hippocampus and memory formation. J Neurosci. 2009;29:12521–12531. doi: 10.1523/JNEUROSCI.0640-09.2009. [DOI] [PMC free article] [PubMed] [Google Scholar]
- 41.Tort AB, Komorowski R, Eichenbaum H, Kopell N. Measuring phase-amplitude coupling between neuronal oscillations of different frequencies. J Neurophysiol. 2010;104:1195–1210. doi: 10.1152/jn.00106.2010. [DOI] [PMC free article] [PubMed] [Google Scholar]
- 42.Delorme A, Makeig S. EEGLAB: an open source toolbox for analysis of single-trial EEG dynamics including independent component analysis. J Neurosci Methods. 2004;134:9–21. doi: 10.1016/j.jneumeth.2003.10.009. [DOI] [PubMed] [Google Scholar]
- 43.Brovelli A, et al. Beta oscillations in a large-scale sensorimotor cortical network: Directional influences revealed by Granger causality. Proc Natl Acad Sci USA. 2004;101:9849–9854. doi: 10.1073/pnas.0308538101. [DOI] [PMC free article] [PubMed] [Google Scholar]
- 44.Dhamala M. In: Encyclopedia of Computational Neuroscience. Jaeger D, Jung R, editors. Springer; 2014. pp. 2789–2793. [Google Scholar]
- 45.Granger CWJ. Investigating causal relations by econometric models and cross-spectral methods. Econometrica. 1969;37:424–438. [Google Scholar]
- 46.Gregoriou GG, Gotts SJ, Zhou H, Desimone R. High-frequency, long-range coupling between prefrontal and visual cortex during attention. Science. 2009;324:1207–1210. doi: 10.1126/science.1171402. [DOI] [PMC free article] [PubMed] [Google Scholar]
- 47.de Waele S, Broersen MT. Order selection for vector autoregressive models. IEEE T Signal Proces. 2003;51:427–433. [Google Scholar]
- 48.Bokil H, Purpura K, Schoffelen JM, Thomson D, Mitra P. Comparing spectra and coherences for groups of unequal size. J Neurosci Methods. 2007;159:337–345. doi: 10.1016/j.jneumeth.2006.07.011. [DOI] [PubMed] [Google Scholar]
- 49.Cohen J. A power primer. Psychol Bull. 1992;112:155–159. doi: 10.1037//0033-2909.112.1.155. [DOI] [PubMed] [Google Scholar]
Associated Data
This section collects any data citations, data availability statements, or supplementary materials included in this article.
Data Availability Statement
The data that support the findings of this study are available from the corresponding author (R.C.L.) upon reasonable request. Source data for all figures with graphical representations are provided with the paper.


