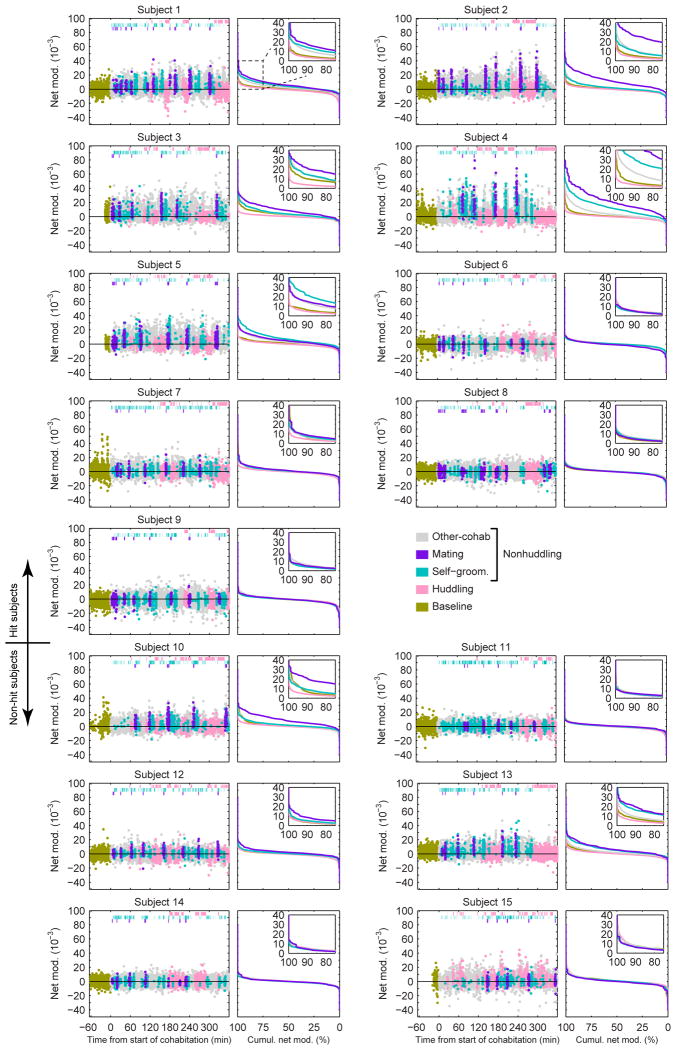
Extended Data Figure 4. Net modulation data for all subjects.
Net modulation values (2-s, non-overlapping windows) sampled over a baseline solo period (gold points) and 6-hr cohabitation for all hit (#1-9) and non-hit (#10-15) subjects. Values that temporally overlap with mating, self-grooming and huddling behaviors (top hashes) are color-coded accordingly. All non-scored values are indicated as “other-cohab,” which together with mating and self-grooming represent “nonhuddling” values. Cumulative distributions of net modulation values coded by behavior are shown in right panel for each subject.

