Abstract
This study was to investigate the clinical outcomes between radiation dose and pretreatment metabolic tumor volume (MTV) in patients with head and neck cancer treated with definitive chemoradiotherapy.
Thirty-four patients received pretreatment 18F-fluorodeoxyglucose (18F-FDG) positron emission tomography-computed tomography (PET/CT) were recruited for this study. The CT-based volume (gross tumor volume of the primary [GTVp]) and 4 types of MTVs were measured on the basis of either a maximal standardized uptake value (SUVmax) of 2.5 (MTV2.5), 3.0 (MTV3.0), or a fixed threshold of 40% (MTV40%), 50% (MTV50%). 18F-FDG PET-CT images before treatment, and data including response to treatment, local recurrence, death due to the cancer, disease-free survival (DFS) and primary relapse-free survival (PRFS), were collected for analysis.
The Wilcoxon rank test showed that all values determined by the different delineation techniques were significantly different from the GTVp (P < .05). Tumor volume and the homogeneity of target dose of MTV2.5, MTV3.0, MTV40%, and MTV50% were significantly different between the 2 groups of patients through treatment outcomes (P < .05).
The survival curves for DFS and PRFS demonstrated that the homogeneity of the target dose in MTVs was a good indicator. The homogeneity of target dose in the tumor is a potential indicator of DSF and PRFS in patients with head and neck cancer who underwent radiotherapy.
Keywords: head and neck cancer, metabolic tumor volume, radiotherapy
1. Introduction
Patients with oropharyngeal cancer and hypopharyngeal cancer are usually treated with radiotherapy or chemoradiotherapy (concurrent chemotherapy and radiotherapy). Modern cancer treatment, such as intensity-modulated radiotherapy (IMRT), can deliver precise doses of radiation to regions within the malignant tumor while minimizing damage to the surrounding normal critical tissues, which can reduce radiotherapy-induced complications, maintain the patient's quality of life, and improve treatment outcome. The prognosis of patients receiving radiotherapy is, however, affected by many factors, such as tumor volume, stage, grade, lymph node involvement, and biological characteristics of the tumor.[1] Based on the tumor-node-metastasis (TNM) system developed by the Union for International Cancer Control/American Joint Committee on Cancer, TNM classification alone can be a predictor of treatment outcome. When it is used with structural imaging data from computed tomography (CT) and/or magnetic resonance imaging (MRI), prognostic prediction can be significantly enhanced. This has become an increasingly important method for the prediction of treatment outcome, and has emerged as a potential diagnosis standard in many types of cancer. However, the use of gross tumor volume (GTV) as a predictor for patients with head and neck cancer is still limited by the heterogeneity of the tumor, and therefore the prognosis of this type of patients is still difficult to predict.[2,3]
Positron emission tomography-CT (PET-CT) is an imaging technique that possesses the advantages of both structural and functional features, and has been widely used for tumor staging and follow-up in patients with head and neck cancer. Metabolic tumor volume (MTV) is a commonly used index incorporating dual characteristics of tumors, including tumor metabolic activity and 3-dimensional tumor volumetric data. The standardized uptake value (SUV) measures variations in metabolic activity via 18F-fluorodeoxyglucose (18F-FDG) uptake in the tumor. MTV is defined as the volume of tumor tissue with an increased FDG uptake. In recent years, many studies have attempted to demonstrate the MTV to be a reliable prognostic marker for patients with head and neck cancer[4]; however, because of the heterogeneity of the patient population and the fundamental variability in calculation of the MTV, different thresholds of MTV have been reported in different studies.[5–15] For example, La and colleagues assigned a 50% threshold of the maximum SUV for calculation of the MTV. In their study of 85 patients who received chemoradiotherapy for head and neck cancer, an increase in the MTV of greater than 17.4 mL was significantly associated with an increased risk of local relapse and an increased mortality rate.[12] Kao et al[14] used an SUV of 2.5 to define the MTV, and found that patients with tumors with an MTV of >13.6 mL had significantly poorer disease-free survival (DFS) and primary relapse-free survival (PRFS) than patients whose MTV was lower. In addition, a study by Schinagl et al[16] used 5 segmentation tools for target-volume definition in PET imaging, which included visual interpretation, applying an isocontour of an SUV of 2.5, using fixed thresholds of 40% and 50% of the maximum signal intensity, and applying an adaptive threshold based on the signal-to-background ratio. They found that visual interpretation still resulted in the best performance in assisting tumor delineation and might be used to predict the risk of local relapse.[17]
However, there remains significant controversy in the use of PET scanning as a predictor of chemoradiotherapy outcome in head and neck cancer.[16] Most previous studies only investigated the effect of MTV on the prognosis of patients with head and neck cancer after radiotherapy. Yet, the actual region that received radiation and the dose distribution are also important factors that can fundamentally affect the treatment outcome. A study of tumor boundary delineation using PET by Ford et al[18] indicated that the choice of threshold level has a strong effect on tumor volume, a 5% change in the threshold contour level resulting in a 200% increase in tumor volume. This can have a dramatic impact on the accuracy of dosage administration for radiotherapy. Therefore, in this study, we used different SUV cutoff values (2.5 or 3.0) and percentages of the maximum SUV (SUVmax ≥40% or 50%) to calculate the MTV of tumors from PET imaging, and compared the results with those obtained from CT imaging alone. This study aimed to investigate the degree of intersection of the tumor volumes defined by the MTV- and CT-based regions, radiation mean dose, dose conformity, uniformity, and coverage to analyze the dose distribution in tumors under radiotherapy treatment. Patients’ responses to treatment, tumor relapse, and mortality were also investigated. The results provide useful information regarding determining factors associated with the DFS and PRFS for patients with head and neck cancer who underwent radiotherapy treatment, and can be used to further develop tools for prognosis prediction.
2. Materials and methods
2.1. Patients and treatment
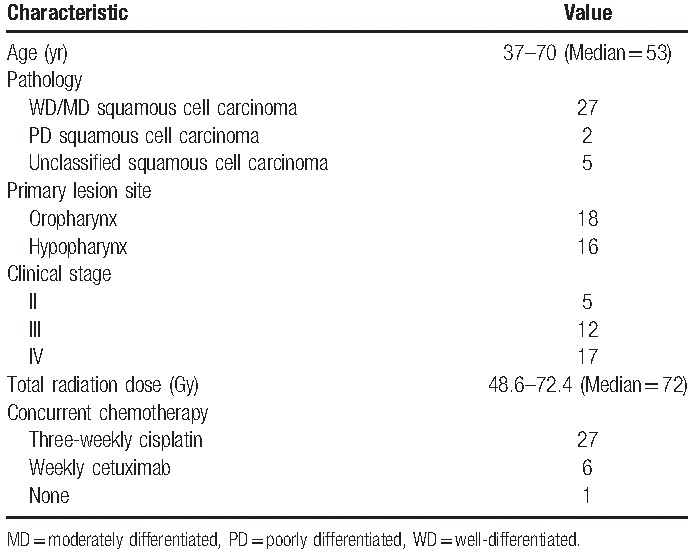
This was a retrospective study that collected data from 34 patients with oropharyngeal and hypopharyngeal cancers who underwent radiotherapy alone or concurrent chemotherapy at China Medical University Hospital between January 2007 and December 2013. PET-CT images before treatment, and data including response to treatment, local recurrence, death due to the cancer, DFS, and PRFS were also collected for analysis. The 34 patients were all men, and their age ranged from 37 to 70 years, with a median age of 53 years. Primary lesions of the cancers were located in the oropharynx (n = 18) and hypopharynx (n = 16), and were staged from II to IV. The detailed characteristics of the patients are listed in Table 1. PET-CT examination was performed for all patients, and the results were used as the basis of tumor staging. Radiotherapy was performed using IMRT with a prescribed dose of 1.8 Gy/fraction, and the total dose between 48.6 and 72.4 Gy (with a median dose of 72 Gy). Of the patients who received concurrent chemotherapy, 27 patients received cisplatin every 3 weeks and 6 patients were administered cetuximab every week. Within 2 years after treatment, the patients were followed up every 1 to 2 months; 3 to 4 years after the treatment, every 3 to 4 months. The data used for this study were anonymously collected, and this study was approved by the Institutional Review Board of China Medical University Hospital before the start of the study (DMR99-IRB-010-1).
Table 1.
Patient characteristics.
Clinical pathology and laryngoscopy examinations were performed during the follow-up period, and CT imaging was conducted every 4 to 6 months during the follow-up period. Patients’ responses to treatment were analyzed based on the results of physical examination within 1 to 2 months after treatment. Complete response and partial response were defined by tumor removal and 30% shrink of tumor size according to Response Evaluation Criteria in Solid Tumors criterion.
2.2. Delineation of tumor volume
Radiation oncologists defined the GTV of the primary (GTVp) and the involvement of regional lymph nodes based on simulation CT imaging alone. Decay-corrected FDG PET images were analyzed using thresholds at different cutoff values (SUV 2.5 and 3.0; the MTV values obtained being denoted as MTV2.5 and MTV3.0). In addition, different fixed percentages of the SUVmax were used (40% and 50%; the MTV being denoted as MTV40% and MTV50%). Figure 1 shows an example case displayed in the axial, coronal, and sagittal planes with various threshold techniques.
Figure 1.
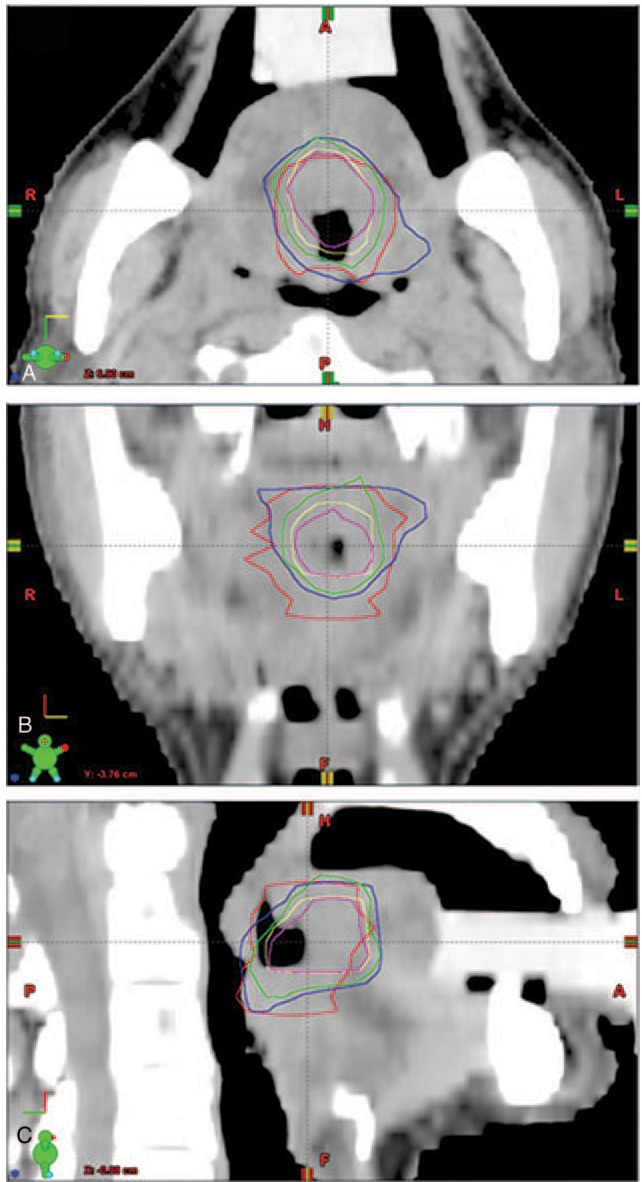
Axial (A), coronal (B), and sagittal (C) views of a tumor. The gross tumor volume of the primary (GTVp) is shown by the red line. The MTV of the tumor was determined using thresholds at different cutoff values, MTV2.5 (blue), MTV3.0 (green), MTV40% (yellow), and MTV50% (pink).
2.3. Dosimetry analysis
Eclipse Cone Planning version 11.0.47 (Varian Medical Systems Inc, Palo Alto, CA) was used in this study for dosimetry analysis in radiotherapy planning. The MTV values obtained using different delineation techniques were input into the radiotherapy planning software, and several outcome values were obtained, including the intersection between the MTV and GTVp, conformity index (CI), homogeneity index (HI), coverage index, and mean dosage under various delineation techniques. The intersection between MTV and GTVp was defined as
 |
which indicates the percentage of the GTV region that intersects with the MTV region.
The definition of CI was
 |
where V100% represents the volume receiving 100% of the prescribed dose for the planning target volume. The ideal value of CI is 1; CI <1 indicates that only part of the target volume received 100% of the prescribed dose, and CI >1 indicates that the area receiving 100% of the prescribed dose is larger than the target volume.
The dose HI was defined as:
 |
where D1% and D98% are the doses delivered to 1% and 98% of the planning target volume, respectively (i.e., D1% and D98% are the maximum and minimum doses in the planning target volume, respectively). Dp represents the prescription dose. HI allows evaluation of the difference between the maximum and minimum dose distributed in a tumor. A smaller HI value indicates a higher homogeneity of the target dose in the tumor.
The coverage was calculated by
 |
where Dmin is the minimum dose given to the planning target volume and Dp is the prescription dose. Coverage = 1 indicates that the minimum dose that covers the target volume is close to the prescription dose.[19,20]
2.4. Statistical analysis
SPSS version 22 (SPSS Inc, Chicago, IL) was used for statistical analysis in this study. Three categories were included in the outcome analysis: “patient's response to treatment (complete response/partial response),” “local recurrence (yes/no),” and “death due to the cancer.” Patients were divided into 2 groups in each category based on the follow-up data. The differences in various parameters (such as the intersection level of the GTVp and MTV, dose CI, dose HI, and coverage) between the 2 groups were calculated. Because of the limited sample size in our study, the Mann-Whitney U test was used to analyze whether these parameters were associated with any of the 3 categories. If an association existed, receiver-operating characteristic (ROC) analysis was used to find the optimal cutoff point. The cutoff point was then used as the prediction value for prognostic survival analysis using the Kaplan-Meier method and the Log-rank test to calculate the DFS and PRFS. Two-tailed t tests were used, and a P value <.05 was considered statistically significant.
3. Results
The mean GTVp was 50.5 ± 69.46 cm3 (range, 2.6–384.2 cm3) and the mean MTV (mean ± SD) determined by MTV2.5, MTV3.0, MTV40%, and MTV50% were 36.9 ± 35.59 cm3 (range, 2.6–152.2 cm3), 27.4 ± 27.80 cm3 (range, 1.7–118 cm3), 13.9 ± 15.26 cm3 (range, 1.3–57.8 cm3), and 8.5 ± 9.37 cm3 (range, 0.6–33.7 cm3), respectively. The Wilcoxon rank test showed that all values determined by the different delineation techniques were significantly different from the GTVp (all P values <.05).
The intersection of GTVp and MTV, dose CI, HI, coverage, and mean dosage of the 2 groups of patients in each category were compared (Table 2). The results showed that dose HI values of MTV2.5, MTV3.0, MTV40%, and MTV50% were significantly different (all P values <.05) between the 2 groups of patients in all 3 categories. Only the dose coverage of GTVp, MTV2.5, and MTV3.0 were significantly different in the 2 categories of “patient's response to treatment” and “death due to the cancer.” The mean dosages of GTVp, MTV2.5, MTV3.0, MTV40%, and MTV50% were significantly different in the category of “local recurrence.” No difference was seen for the intersection and dose CI values under different delineation methods between the 2 groups in all categories. The optimal cutoff values for the items that have statistically different P values in various categories were determined by ROC analysis. The cutoff points were applied for the prediction of DFS and PRFS of patients after treatment. As shown in Table 3, MTV2.5 and MTV3.0 indicated a lower 1-year DFS and 1-year PRFS for patients with HI ≥4.5% than those with HI <4.5%; MTV40% had similar trends for patients with HI cutoff value of 0.035: 1-year PRFS of patients with HI ≥3.5% (27.3%) much lower than those with HI <3.5% (66.7%). The survival curves for DFS and PRFS are shown in Figures 2–4.
Table 2.
Differences in intersection, dose conformity index, dose homogeneity index, dose coverage, and mean dosage between the 2 groups in 3 categories: “patient's response,” “local recurrence,” and “death due to the cancer”.
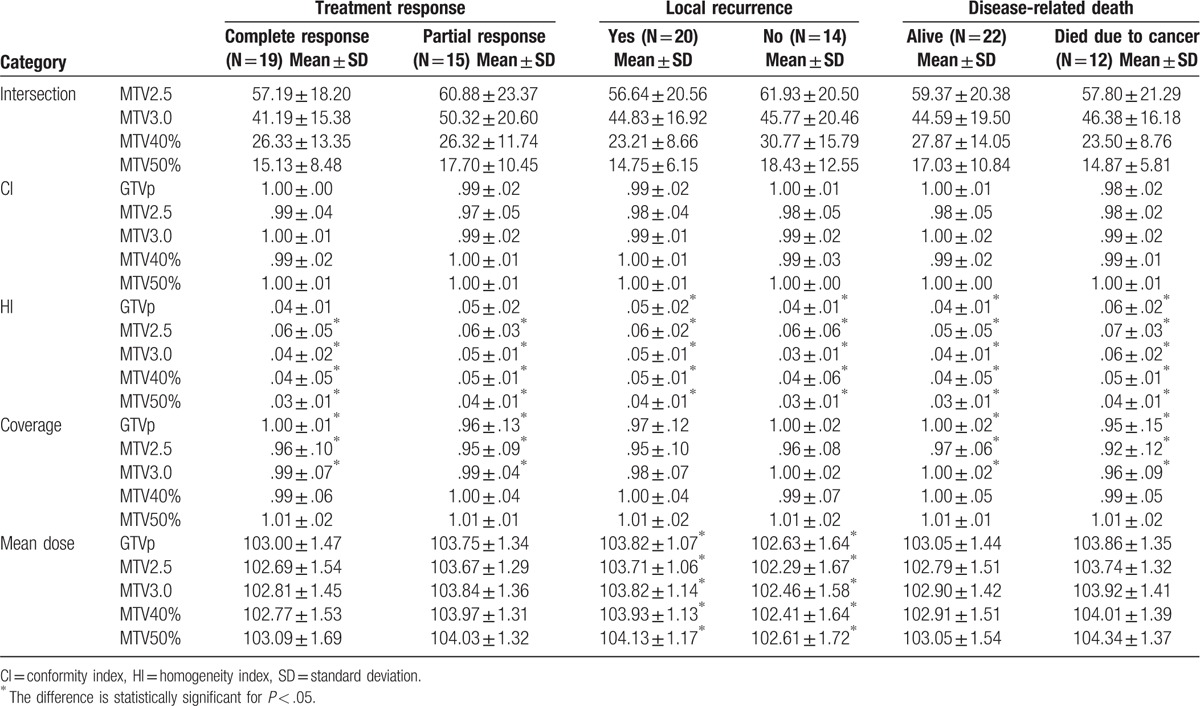
Table 3.
Disease-free survival and primary relapse-free survival analyses for optimal cutoff points of homogeneity index.
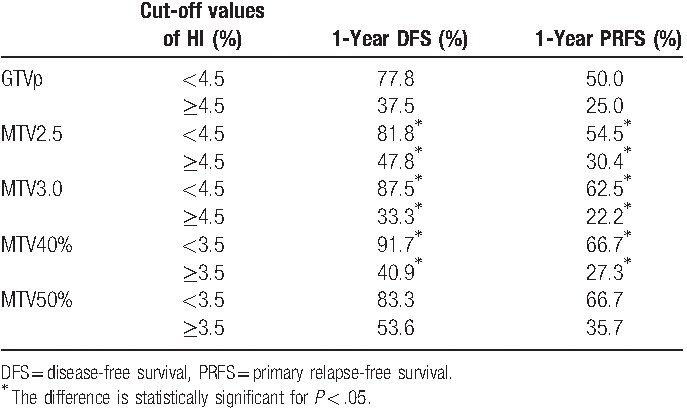
Figure 2.
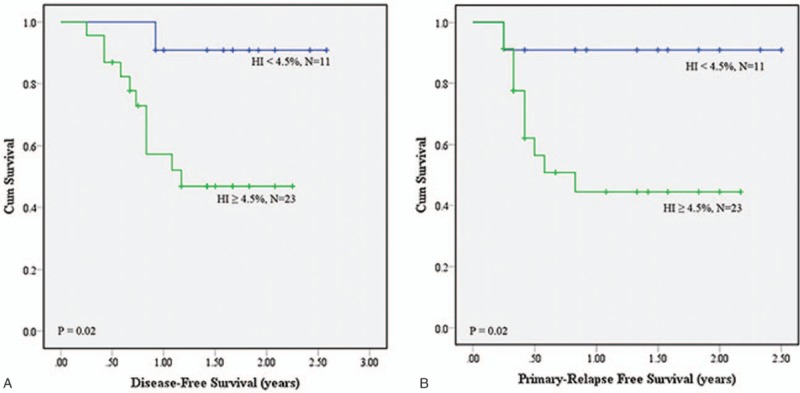
(A) Disease-free survival (DFS) and (B) primary relapse-free survival (PRFS) analyses using homogeneity index (HI) of .045 as the cutoff value on MTV2.5.
Figure 4.
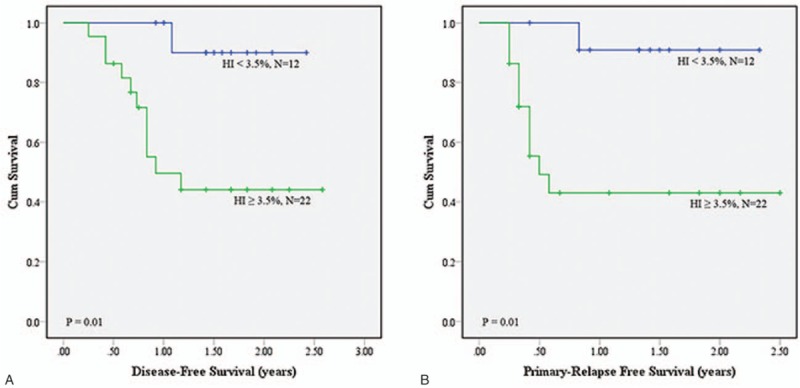
(A) Disease-free survival (DFS) and (B) primary relapse-free survival (PRFS) analyses using homogeneity index (HI) of .035 as the cutoff value on MTV40%.
Figure 3.
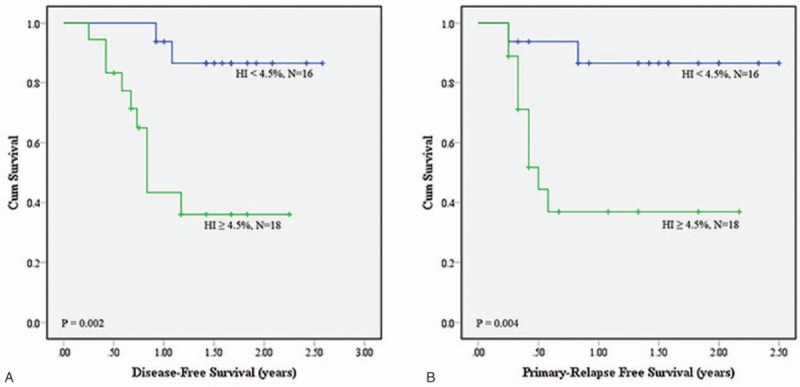
(A) Disease-free survival (DFS) and (B) primary relapse-free survival (PRFS) analyses using homogeneity index (HI) of .045 as the cutoff value on MTV3.0.
4. Discussion
In this study, the intersection of MTV and GTVp, dose CI, dose HI, dose coverage, and mean dosage were used to evaluate the dose distribution in radiotherapy treatment planning using different delineation methods. In addition, the correlation between the radiation that the tumor MTV received and patient outcome was analyzed. Our results demonstrated that when patients were divided into 2 groups according to their clinical outcome in 3 individual categories (“patient's response,” “local recurrence,” and “death due to the cancer”), there were no significant differences in the intersection between MTV and GTVp. In our study, the mean MTV was significant smaller than the GTVp, which was in agreement with previous studies by others.[21,22] Daisne et al[21] investigated 29 patients with pharyngolaryngeal carcinoma using CT, MRI, and PET to compare the differences in delineation of tumor volume, and found that the average target tumor volume defined by FDG-PET was smaller (oropharyngeal tumors: 20.3 cm3; laryngeal or hypopharyngeal tumors: 13.4 cm3) than that defined by CT (oropharyngeal tumors: 32.0 cm3; laryngeal or hypopharyngeal tumors: 21.4 cm3). In addition, another study by the same group of researchers also found that the average target volume based on FDG-PET was smaller than that based on pretreatment CT (17.5 ± 4.6 and 28.5 ± 6.2 cm3, respectively; P < .01).[22] Although significant differences existed in tumor volume between delineation by FDG-PET and CT, we found that most tumors had a similar range of MTV to that of the GTVp. In addition, some tumors had an MTV range within the range of the GTVp, which might be the reason for which there were no significant differences in the intersection between the 2 groups of patients within the 3 different categories.
Our results indicated that only the GTVp, MTV2.5, and MTV3.0 resulted in significant differences in dose coverage between the 2 groups within the categories of “patient's response” and “death due to the cancer.” As the target tumor volumes delineated using GTVp, MTV2.5, MTV3.0, MTV40%, and MTV50% in our study were all located in the high radiation dose region of radiotherapy planning, the dose CI and coverage exhibited little difference, which might result in there being no significant differences between groups. Interestingly, when the patients were divided into 2 groups based on whether local relapse had occurred, our results showed that there was a significant difference in the mean dosage between the patients who experienced local relapse and those who did not; that is, patients with local relapse had a higher mean dosage than those without local relapse. We therefore further investigated the possible causes, and found that this might be due to patients with local relapse having a larger average tumor volume than patients without local relapse. Larger tumors often require higher radiation doses during treatment to achieve a uniform dose distribution in the tumor, and therefore several more parameters are normally taken into consideration, which lead to an increased radiation dose in the clinical treatment planning.
Our results also demonstrated that the MTV2.5, MTV3.0, MTV40%, and MTV50% delineation methods identified significant differences in dose HI between the 2 groups within the different categories. Using HI as the parameter to perform survival analysis, we found that patients with a lower-dose HI had a >1-year DFS and 1-year PRFS, which might be related to tumor shape. Usually, abnormal shape gets higher HI compared to spherical shape. Shape features including convexity, sphericity, eccentricity, etc may be highly correlated to HI, and thus may be also better predictors as well. This study was the first to perform analysis of the relationship between radiation dose distribution in the MTV and DFS/PRFS in patients with oropharyngeal and hypopharyngeal cancer. The findings of our study showed that the dose HI obtained by MTV2.5, MTV3.0, and MTV40% was associated with the DSF and PRFS of the patients. We therefore suggest that when designing radiotherapy treatment plans for patients with oropharyngeal and hypopharyngeal cancer, doctors should evaluate the dose HI of the MTV. When the dose HI values using MTV2.5 and MTV3.0 are both higher than 0.045, and the dose HI using MTV40% is >0.035, the risk of cancer relapse is likely increased, which could lead to a poorer DFS and PRFS in the patient.
Paulino et al[23] compared the GTV based on the PET scan and CT simulation, and determined the differences in tumor volume and dose coverage from these 2 different methods. In a total of 40 patients with head and neck cancer, they found that in 75% of patients the PET-based GTV was smaller and in 18% it was larger than the CT-based GTV, and only in 8% of cases it was the same size. In addition, in patients in whom the PET-based GTV was larger than the CT-based GTV, they found that the PET-based GTV was not covered completely by the high-dose volume as seen in the CT-based GTV. Furthermore, in some cases in which the PET-based GTV was smaller than the CT-based GTV, the patient's PET-based GTV was not necessarily completely within the CT-based GTV. Hence, only in 25% of cases did the PET-based GTV volume receive at least 95% of the prescribed dose.[22] In our study, the tumor volumes as defined by MTV2.5, MTV3.0, and MTV40% that were smaller than the GTVp were 68%, 91%, and 97%, respectively, and the tumor volumes defined by MTV50% were all smaller than the GTVp. In terms of the dose coverage in our study, in 76% of the patients, the MTV2.5 volume received at least 95% of the prescribed dose; in 91% of the patients, the MTV3.0 and MTV40% volumes received at least 95% of the prescribed dose; and in all patients, the MTV50% volume received at least 95% of the prescribed dose. Because most of our studied cases had an MTV similar to the GTVp, the ratio of tumors receiving at least 95% of the prescribed dose was higher than that reported in the study of Paulino et al.
Some studies have pointed out that there may be a higher risk of recurrence within the tumor volume defined by PET imaging. For example, in a study that included 85 patients with head and neck cancer by La et al,[12] 7 locoregional relapses occurred, 6 of which occurred within the original MTV; in addition, Soto et al[24] analyzed 84 patients, and showed that 8 of 9 locoregional relapses had a recurrence volume within the FDG-PET-defined target volume. It is reported that the most local relapse occurred within the 95% high-dose regions, which were inside GTV.[25,26] This may be an indication that in addition to accurately defining the target volume, it is important to make sure the dose delivered to the target volume is homogeneous.
The major limitation of the current retrospective study was the small sample size. Between January 2007 and December 2013, there are only 34 cases satisfying the criteria of this study. In these patients, only the oropharyngeal and hypopharyngeal cancer cases that were treated with radiotherapy alone or with concurrent chemotherapy and had pretreatment PET/CT image data and post-treatment follow-up data were recruited. Because of the retrospective nature, the cases that met the conditions happened to be all men. However, previous studies have shown that neither sex nor age was not significantly related to survival or locoregional control.[12,27] In the future, with a larger sample size, further analysis on different groups, such as age, sex, stage, location, and chemotherapy type will be performed. In the present study, no investigation of the relationship between the tumor relapse region and the location of the original MTV was performed. We, however, analyzed the association between the dose distribution in the MTV and tumor relapse, and found that the mean dose HI values of the GTVp and MTV of patients with local relapse were higher than the values of patients without local relapse. The results suggested that dose homogeneity is a key factor influencing tumor relapse. Other limitations in data collection existed due to the nature of this retrospective research, such as information regarding the position of the patient during PET-CT imaging, which might differ from that in the stimulation CT. Therefore, during delineation of the tumor and comparison of the 2 types of image, a difference in position between PET-CT and stimulation CT might cause an error that could affect the results of this study. In addition, this study only evaluated the dose distribution in the GTVp and MTV and analyzed its effect on treatment outcome. The region that actually received the prescribed dose, the dose distribution in planning target volume, and other factors that may affect the treatment outcome (e.g., tumor stage, patient's health habits [e.g., tobacco smoking, alcohol drinking and betel quid chewing], and past illness or other diseases) were not taken into consideration. Furthermore, due to the small sample size and short follow-up period, as well as the inclusion of patients with advanced stages of cancer only, the results of this study cannot be taken to represent the majority of cases of a similar type. Thus, in a future study, a greater sample number, including patients with different tumor stages, will be used, and other factors that affect the treatment outcome (such as dose distribution in planning target volume, tumor size, and patient's health habits) will be assessed, which will enable a more comprehensive study.
5. Conclusion
In this study, the intersection of MTV and GTVp, mean dosage, dose CI, dose HI, and dose coverage were evaluated in terms of their correlation with treatment outcome, local relapse, and death in radiotherapy treatment planning for patients with head and neck cancer. The results of our study indicated that the intersection of MTV and GTVp, dose CI, and dose coverage were not significantly different between groups subclassified by treatment outcome. The mean dosages of the GTVp and MTV only showed significant differences between patients with and without local relapse. The dose HI differed significantly in terms of treatment response, local relapse, and death due to the cancer. Our findings indicated that patients with HI values of MTV2.5 and MTV3.0 < 0.045, and HI of MTV40% < 0.035, were likely to have higher DSF and PRFS. This suggests that HI is good indicator of treatment outcome, including DSF and PRFS, in patients with head and neck cancer who underwent radiotherapy or concurrent chemotherapy.
Footnotes
Abbreviations: CI = conformity index, CT = computed tomography, DFS = disease-free survival, 18F-FDG = 18F-fluorodeoxyglucose, GTV = gross tumor volume, GTVp = gross tumor volume of the primary, HI = homogeneity index, IMRT = intensity-modulated radiotherapy, MRI = magnetic resonance imaging, MTV = metabolic tumor volume, PET-CT = positron emission tomography-computed tomography, PRFS = primary relapse-free survival, ROC = receiver-operating characteristic, SUV = standardized uptake value, SUVmax = maximal standardized uptake value, TNM = tumor-node-metastasis.
This study was financially supported by Ministry of Science and Technology (MOST 105-2221-E-039-007-) and Taiwan and China Medical University Hospital (DMR105-045). The funder had no role in study design, data collection and analysis, decision to publish, or preparation of the manuscript.
The authors have no conflicts of interest to disclose.
References
- [1].Akagunduz OO, Savas R, Yalman D, et al. Can adaptive threshold-based metabolic tumor volume (MTV) and lean body mass corrected standard uptake value (SUL) predict prognosis in head and neck cancer patients treated with definitive radiotherapy/chemoradiotherapy? Nucl Med Biol 2015;42:899–904. [DOI] [PubMed] [Google Scholar]
- [2].Garden AS, Asper JA, Morrison WH, et al. Is concurrent chemoradiation the treatment of choice for all patients with stage III or IV head and neck carcinoma? Cancer 2004;100:1171–8. [DOI] [PubMed] [Google Scholar]
- [3].Lydiatt WM, Shah JP, Hoffman HT. AJCC stage groupings for head and neck cancer: should we look at alternatives? A report of the Head and Neck Sites Task Force. Head Neck 2001;23:607–12. [DOI] [PubMed] [Google Scholar]
- [4].Schwartz DL, Harris J, Yao M, et al. Metabolic tumor volume as a prognostic imaging-based biomarker for head-and-neck cancer: pilot results from Radiation Therapy Oncology Group protocol 0522. Int J Radiat Oncol Biol Phys 2015;91:721–9. [DOI] [PMC free article] [PubMed] [Google Scholar]
- [5].Allal AS, Slosman DO, Kebdani T, et al. Prediction of outcome in head-and-neck cancer patients using the standardized uptake value of 2-[18F]fluoro-2-deoxy-D-glucose. Int J Radiat Oncol Biol Phys 2004;59:1295–300. [DOI] [PubMed] [Google Scholar]
- [6].Minn H, Lapela M, Klemi PJ, et al. Prediction of survival with fluorine-18-fluoro-deoxyglucose and PET in head and neck cancer. J Nucl Med 1997;38:1907–11. [PubMed] [Google Scholar]
- [7].Halfpenny W, Hain SF, Biassoni L, et al. FDG-PET: a possible prognostic factor in head and neck cancer. Br J Cancer 2002;86:512–6. [DOI] [PMC free article] [PubMed] [Google Scholar]
- [8].Allal AS, Dulguerov P, Allaoua M, et al. Standardized uptake value of 2-[(18)F]fluoro-2-deoxy-D-glucose in predicting outcome in head and neck carcinomas treated by radiotherapy with or without chemotherapy. J Clin Oncol 2002;20:1398–404. [DOI] [PubMed] [Google Scholar]
- [9].Kitagawa Y, Sadato N, Azuma H, et al. FDG PET to evaluate combined intra-arterial chemotherapy and radiotherapy of head and neck neoplasms. J Nucl Med 1999;40:1132–7. [PubMed] [Google Scholar]
- [10].Brun E, Kjellen E, Tennvall J, et al. FDG PET studies during treatment: prediction of therapy outcome in head and neck squamous cell carcinoma. Head Neck 2002;24:127–35. [DOI] [PubMed] [Google Scholar]
- [11].Schwartz DL, Rajendran J, Yueh B, et al. FDG-PET prediction of head and neck squamous cell cancer outcomes. Arch Otolaryngol Head Neck Surg 2004;130:1361–7. [DOI] [PubMed] [Google Scholar]
- [12].La TH, Filion EJ, Turnbull BB, et al. Metabolic tumor volume predicts for recurrence and death in head-and-neck cancer. Int J Radiat Oncol Biol Phys 2009;74:1335–41. [DOI] [PMC free article] [PubMed] [Google Scholar]
- [13].Seol YM, Kwon BR, Song MK, et al. Measurement of tumor volume by PET to evaluate prognosis in patients with head and neck cancer treated by chemo-radiation therapy. Acta Oncol 2010;49:201–8. [DOI] [PubMed] [Google Scholar]
- [14].Kao CH, Lin SC, Hsieh TC, et al. Use of pretreatment metabolic tumor volumes to predict the outcome of pharyngeal cancer treated by definitive radiotherapy. Eur J Nucl Med Mol Imaging 2012;39:1297–305. [DOI] [PubMed] [Google Scholar]
- [15].Chung MK, Jeong HS, Park SG, et al. Metabolic tumor volume of [18F]-fluorodeoxyglucose positron emission tomography/computed tomography predicts short-term outcome to radiotherapy with or without chemotherapy in pharyngeal cancer. Clin Cancer Res 2009;15:5861–8. [DOI] [PubMed] [Google Scholar]
- [16].Schinagl DA, Vogel WV, Hoffmann AL, et al. Comparison of five segmentation tools for 18F-fluoro-deoxy-glucose-positron emission tomography-based target volume definition in head and neck cancer. Int J Radiat Oncol Biol Phys 2007;69:1282–9. [DOI] [PubMed] [Google Scholar]
- [17].Schinagl DA, Span PN, Oyen WJ, et al. Can FDG PET predict radiation treatment outcome in head and neck cancer? Results of a prospective study. Eur J Nucl Med Mol Imaging 2011;38:1449–58. [DOI] [PMC free article] [PubMed] [Google Scholar]
- [18].Ford EC, Kinahan PE, Hanlon L, et al. Tumor delineation using PET in head and neck cancers: threshold contouring and lesion volumes. Med Phys 2006;33:4280–8. [DOI] [PubMed] [Google Scholar]
- [19].Feuvret L, Noel G, Mazeron JJ, et al. Conformity index: a review. Int J Radiation Oncol Biol Phys 2006;64:333–42. [DOI] [PubMed] [Google Scholar]
- [20].Haverkamp U, Norkus D, Kriz J, et al. Optimization by visualization of indices. Strahlenther Onkol 2014;190:1053–9. [DOI] [PubMed] [Google Scholar]
- [21].Daisne JF, Duprez T, Weynand B, et al. Tumor volume in pharyngolaryngeal squamous cell carcinoma: comparison at CT, MR imaging, and FDG PET and validation with surgical specimen. Radiology 2004;233:93–100. [DOI] [PubMed] [Google Scholar]
- [22].Geets X, Daisne JF, Tomsej M, et al. Impact of the type of imaging modality on target volumes delineation and dose distribution in pharyngo-laryngeal squamous cell carcinoma: comparison between pre- and per-treatment studies. Radiother Oncol 2006;78:291–7. [DOI] [PubMed] [Google Scholar]
- [23].Paulino AC, Koshy M, Howell R, et al. Comparison of CT- and FDG-PET-defined gross tumor volume in intensity-modulated radiotherapy for head-and-neck cancer. Int J Radiat Oncol Biol Phys 2005;61:1385–92. [DOI] [PubMed] [Google Scholar]
- [24].Soto DE, Kessler ML, Piert M, et al. Correlation between pretreatment FDG-PET biological target volume and anatomical location of failure after radiation therapy for head and neck cancers. Radiother Oncol 2008;89:13–8. [DOI] [PMC free article] [PubMed] [Google Scholar]
- [25].Leclerc M, Lartigau E, Lacornerie T, et al. Primary tumor delineation based on (18)FDG PET for locally advanced head and neck cancer treated by chemo-radiotherapy. Radiother Oncol 2015;116:87–93. [DOI] [PubMed] [Google Scholar]
- [26].De Felice F, Thomas C, Barrington S, et al. Analysis of loco-regional failures in head and neck cancer after radical radiation therapy. Oral Oncol 2015;51:1051–5. [DOI] [PubMed] [Google Scholar]
- [27].Denis F, Garaud P, Bardet E, et al. Final results of the 94-01 French Head and Neck Oncology and Radiotherapy Group randomized trial comparing radiotherapy alone with concomitant radiochemotherapy in advanced-stage oropharynx carcinoma. J Clin Oncol 2004;22:69–76. [DOI] [PubMed] [Google Scholar]


