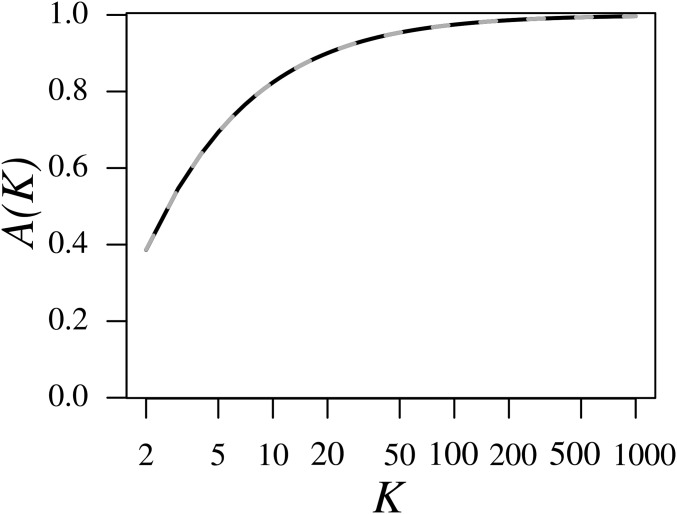
Figure 2.
The mean of the upper bound on over the interval as a function of the number of subpopulations K. is computed from Equation 8 (black line). The approximation is computed from Equation 9 (gray dashed line). A numerical computation of the relative error of the approximation as a function of K, finds that the maximal error for is 0.00174, achieved when The x-axis is plotted on a logarithmic scale.

