Abstract
Methodologies to image and quantify the activity of proteolytic enzymes have been developed in an effort to identify protease-related druggable pathways that are involved in malignant progression of cancer. Our laboratory has pioneered techniques for functional live-cell imaging of protease activity in pathomimetic avatars for breast cancer. We analyze proteolysis in the context of proliferation and formation of structures by tumor cells in 3-D cultures over time (4D). In order to recapitulate the cellular composition and architecture of tumors in the pathomimetic avatars, we include other tumor-associated cells (e.g., fibroblasts, myoepithelial cells, microvascular endothelial cells). We also model noncellular aspects of the tumor micro-environment such as acidic pericellular pH. Use of pathomimetic avatars in concert with various types of imaging probes has allowed us to image, quantify, and follow the dynamics of proteolysis in the tumor microenvironment and to test interventions that impact directly or indirectly on proteolytic pathways. To facilitate use of the pathomimetic avatars for screening of therapeutic modalities, we have designed and fabricated custom 3D culture chambers with multiple wells that are either individual or connected by a channel to allow cells to migrate between wells. Optical glass microscope slides underneath an acrylic plate allow the cultures to be imaged with an inverted microscope. Fluid ports in the acrylic plate are at a level above the 3D cultures to allow introduction of culture media and test agents such as drugs into the wells and the harvesting of media conditioned by the cultures for immunochemical and biochemical analyses. We are using the pathomimetic avatars to identify druggable pathways, screen drug and natural product libraries and accelerate entry of validated drugs or natural products into clinical trials.
Keywords: Proteolysis, Fluorescent imaging, Confocal microscopy, High-content imaging, Screening assays
1 Introduction
Proteases are critical for many aspects of normal physiology. Changes in expression of proteases have been correlated with progression or suppression of a variety of cancers (for reviews, see [1–3]). The source of those proteases includes cells of the tumor microenvironment as well as the tumor cells. Proteases and the pathways they mediate are complex as >500 human proteases of five classes have been identified [4]. There are tools such as Hu/Mu ProtIn [5] and CLIP-CHIP [6] microarrays to analyze changes in expression of protease mRNAs. The inclusion of both human and mouse probes on the Hu/Mu ProtIn chip allows one to distinguish changes in expression of proteases and protease inhibitors in human versus mouse cells and thereby distinguish effects on the tumor from those on the microenvironment. Using the Hu/Mu ProtIn chip for analysis of human lung tumor cells growing as xenograft models in a mouse host, matrix metalloproteinase 12 in the murine stroma was found to suppress growth of the human lung tumor cells [7]. Changes in expression of proteases do not, however, necessarily alter protease activity as proteases are synthesized as proenzymes that require processing for activation and changes in levels of proteases may be compensated for by changes in levels of endogenous inhibitors.
Therefore, to evaluate protease activity that is associated with the malignant phenotype of tumor cells, we have developed a method to study proteolysis by live cells as they are growing over extended periods of time in 3D cultures. Furthermore, we analyze and quantify live-cell proteolysis in co-culture models or pathomimetic avatars that consist of tumor cells interacting with both cellular and noncellular aspects of the tumor microenvironment. The ability to monitor protease activity in live-cell models is providing us with a better understanding of how proteolytic networks contribute to the malignancy of many cancers.
2 Materials
2.1 Cell Lines
All cell lines in use in our laboratories are authenticated through the genotyping service available in the Biobanking and Correlative Sciences Core of the Karmanos Cancer Institute (KCI). In addition, routine testing in our laboratories by both staining and RT-PCR ensures that they remain free of mycoplasma contamination.
Human breast epithelial cell lines used include MCF.10 breast epithelial variants spanning the progression from normal (10A) to cancer (CA1d), myoepithelial, and breast cancer subtypes. MDA-MB-231 breast carcinoma cells were obtained from ATCC and the MCF10 variants from KCI.
Human breast fibroblasts (normal or cancer-associated) are isolated and characterized at KCI or were generated and characterized by colleagues (Dr. S. Hayward, NorthShore University Health System; Dr. F. Behbod, KUMC).
2.2 Fluorescent Proteins/Probes
Dye quenched (DQ)—collagens IV or I (ThermoFisher Scientific).
Lentiviral particles for fluorescent cell labeling (Clontech in partnership with Vectalys).
CellTracker or CellTrace dyes (ThermoFisher Scientific).
Hoechst 33342 or Draq5 (ThermoFisher Scientific).
2.3 Matrices
Reconstituted basement membrane (rBM; Cultrex 3-D culture matrix reduced growth factor basement membrane extract, PathClear, Trevigen).
Collagen I (Advanced BioMatrix).
2.4 Culture Media and Supplements (See Note 1)
Regular culture medium: DMEM + 10% FBS + 4 mM glutamine + antibiotics.
MEBM: Mammary epithelial cell basal medium without phenol red (Lonza).
MEGM: Mammary epithelial cell growth medium SingleQuot kit suppl & growth factors (Lonza).
2.5 Substrates for Live-Cell Proteolysis Assay: Dye-Quenched (DQ) Collagens
Allow lyophilized DQ-collagen (I or IV) to warm to room temperature before opening vials, prepare stock solution of 1 mg/mL of DQ-collagen in deionized water, divide into 50 μL aliquots, and store at 4 °C (see Note 2).
Thaw rBM on ice overnight at 4 °C; rBM should be handled on ice at all times (see Note 3).
DQ-collagen IV:rBM matrix—prepare by diluting DQ-collagen IV in rBM in a prechilled tube to a final concentration of 25 μg/mL and 12–15 mg/mL, respectively. Mix on ice using gentle pipetting to avoid creating bubbles.
DQ-collagen I:collagen I matrix—prepare by diluting DQ-collagen I in collagen I solution in a prechilled tube to a final concentration of 25 μg/mL and 2.4 mg/mL, respectively.
Prepare collagen I solution on ice: 8 parts of collagen I to 1 part of 10× phosphate buffered saline (PBS). Using sterile 0.1 M NaOH and pH strips, adjust pH of mixture to 7.2–7.6. Adjust the final volume to 10 parts with sterile water.
10× PBS: dissolve 80 g NaCl (1.37 M), 2 g KCl (0.027 M), 14.4 g Na2HPO4 (1 M), and 2.4 g KH2PO4 (0.02 M) in 800 mL ultrapure water. Adjust pH of PBS buffer solution to 7.4 with 1.0 M HCl. Bring volume to 1 L, sterilize by filtration.
2.6 Culture Platforms
12 mm diameter glass coverslips.
22 mm diameter plastic coverslips.
35 mm tissue culture dishes—plastic bottom for cell maintenance (Corning) and WillCo-dish glass bottom dishes for imaging on inverted microscope (WillCo Wells BV).
Custom 3D culture chambers.
2.7 Confocal Microscopes (See Note 4)
Zeiss laser scanning confocal microscopes.
Molecular Devices ImageXpress Micro Confocal High-Content Imaging System.
2.8 Image Processing Software
Volocity software (Perkin–Elmer).
Image J.
3 Methods
3.1 Labeling of Cells and Nuclei
Cells and nuclei are differentially labeled with fluorescent proteins/dyes according to our published procedures [8, 9].
If cells are grown as monocultures and the length of time that the cells will be cultured is less than a week, then they can be labeled with cytoplasmic dyes like CellTracker. As an example of cytoplasmic labeling—after washing with PBS, monocultures can be incubated with 5 μM CellTracker Orange in MEGM for 45 min in a cell culture incubator, washed again with PBS, and incubated with pre-warmed MEGM for 30 min in a cell culture incubator before imaging.
If cells will be grown in monocultures for times greater than a week or grown in co-cultures in which cells need to be distinguished from one another, cytoplasmic labeling will be done by using CellTrace dyes (following manufacturer’s instructions; see Note 5) or by lentiviral transduction with fluorescent proteins such as TdTomato, mCherry, AmCyan1, etc.
In order to count cells, nuclei can be labeled just prior to imaging with Hoechst 33342 or Draq5 [8]. Add Hoechst 33342 or Draq5 at the concentration suggested by the manufacturer, and incubate for 5–10 min at room temperature.
3.2 Pathomimetic Avatars (See Note 6)
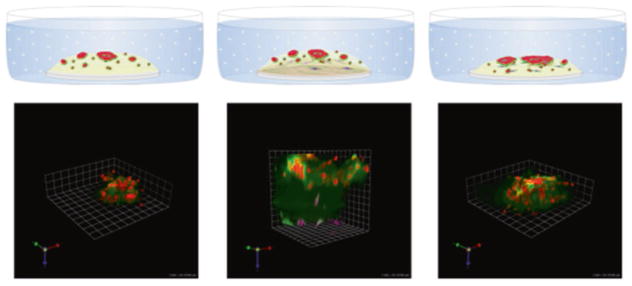
To evaluate the contributions of proteases to the development and progression of tumors, we have optimized a series of models in which we grow tumor cells in 3D and study them over time (4D). In some of our models the cells are grown alone in monoculture. In others we co-culture cells with others that are part of the tumor microenvironment in vivo. Models of mixed and layered cultures are shown in Fig. 1. Our layered cultures are comprised of two different extracellular matrices, a lower layer of stromal collagen or collagen I in which we embed fibroblasts and an upper layer of basement membrane or rBM that incorporates other cells.
-
Protocol for monoculture of MDA-MB-231 cells in 3D on glass coverslips
Trypsinize cells and add regular culture medium to fully neutralize trypsin. Spin down cells at 700–800 rpm for 5 min and resuspend pellet with 1–2 mL of MEGM depending on the size of the pellet.
Count cells using a hemocytometer. Prepare the cell suspension at a desired density (for MDA-MB-231 cells, 8 × 10³ cells per coverslip) in 50 μL of MEGM per coverslip and set aside.
Coat entire surface of glass coverslips evenly with 50 μL of rBM, avoiding generation of air bubbles. Place two coverslips per 35 mm culture dish. Coverslips and rBM should be kept on ice to prevent gelling.
Place dishes with coverslips at 37 °C in a cell culture incubator to allow the rBM to gel completely (~15–20 min). Do not disturb the dishes during this step.
Plate 50 μL of cell suspension per coverslip on the top of the solidified rBM, and allow the cells to attach for ~30–40 min in a cell culture incubator.
Add 2 mL of 2% overlay (2% rBM in MEGM) very gently to each culture dish, place dishes in a cell culture incubator, and culture for desired time periods.
Cells should be fed with fresh 2% overlay every 4 days.
-
Protocol for co-culture of MDA-MB-231 cells and fibroblasts in 3D in layered cultures on plastic coverslips (see Note 7)
Mix desired number of fibroblasts with collagen I matrix. We use 500 fibroblasts in 10 μL of media plus 60 μL of collagen I matrix.
Carefully pipette and spread 70 μL of fibroblast:collagen I mixture over the entire surface of each coverslip and leave at 37 °C in a cell culture incubator without CO2 for 30 min to solidify.
Transfer 35-mm dishes containing coverslips to a cell culture incubator with 5% CO2 for 10 min to equilibrate. Remove from cell culture incubator and leave under the hood until they come to room temperature.
Add 60 μL of rBM on the top of the solidified collagen I with embedded fibroblasts. With pipette tip, carefully spread rBM evenly, avoiding scratching the fibroblast:collagen I mixture.
Transfer 35-mm dishes containing coverslips to a cell culture incubator with 5% CO2 for 15–20 min to solidify. While the rBM is solidifying, trypsinize, and count tumor cells.
Place 60 μL of tumor cell suspension onto coverslips coated with rBM. Place 35-mm dishes containing the coverslips into a cell culture incubator. Allow 40–60 min for the cells to attach to rBM. We use 2500 tumor cells, i.e., a ratio of five tumor cells to one fibroblast.
Incubate for desired period of time before imaging. Media should be changed every 3–4 days. Also see Note 8.
-
Protocol for monoculture of MDA-MB-231 cells for short-term cultures (<15 days) in custom 3D culture chambers (see Note 9)
Trypsinize cells and add regular culture medium to fully neutralize trypsin. Spin down cells at 700–800 rpm for 5 min and resuspend pellet with 1–2 mL of MEGM depending on the size of the pellet.
Count cells using a hemocytometer. Prepare cell suspension at the desired density in 250 μL of MEGM per well of the chamber and set aside.
Coat entire surface of each well in the chamber evenly with 120 μL of rBM, avoiding generation of air bubbles. Chambers and rBM should be kept on ice to prevent gelling.
Place chambers in a cell culture incubator to allow the rBM to gel completely (~15–20 min). Do not disturb chambers during this step.
Plate 250 μL of cell suspension in each well on the top of the solidified rBM, and allow the cells to attach for ~30–40 min in a cell culture incubator.
Add 250 μL of 4% overlay (the final concentration of overlay will be 2%) very gently to each well, place chamber into the cell culture incubator, and culture for the desired time periods.
Cells should be fed with fresh 2% overlay every 4 days.
-
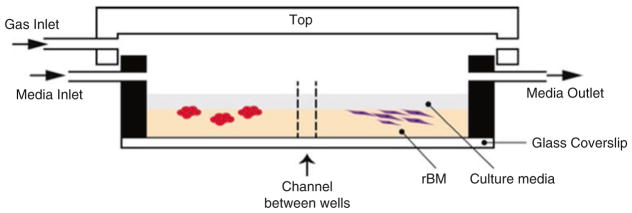
Protocol for parallel long-term (≤60 days) co-culture of MDA-MB-231 cells and fibroblasts in custom 3D culture chambers with linked wells (Fig. 2)
Trypsinize cells and add regular culture medium to fully neutralize trypsin. Spin down cells at 700–800 rpm for 5 min and resuspend pellet with 1–2 mL of regular culture medium depending on the size of the pellet.
Count cells using a hemocytometer. Prepare cell suspension at a desired density (for MDA-MB-231 cells, 8 × 10³ cells per well; for fibroblasts, 1.6 × 10³ cells per well) in 15 μL of regular culture medium per chamber and set aside.
Coat entire surface of each well, and channels connecting wells, evenly with 500 μL of rBM, avoiding generation of air bubbles. Chambers and rBM should be kept on ice to prevent gelling.
Place chambers in a cell culture incubator to allow the rBM to gel completely (~15–20 min). Do not disturb chambers during this step.
Spread 15 μL of cell suspension in the center of each well on the top of the solidified rBM, and allow the cells to attach for ~30–40 min in a cell culture incubator.
Add 1 mL of 2% overlay (2% rBM in MEGM) very gently to each well of the chamber, place the chamber into a cell culture incubator, and culture for the desired time.
Cells should be fed with fresh 2% overlay every 4 days.
Fig. 1.
Pathomimetic avatars: schematic diagrams and representative images of 8-day cultures. Left: MDA-MB-231 human breast carcinoma cells in reconstituted basement membrane (rBM) + 2% rBM overlay. Middle: 231 cells in a top layer of reconstituted basement membrane (rBM) overlaid with 2% rBM and WS12Ti human breast carcinoma-associated fibroblasts embedded in a lower layer of collagen I. Right: tumor cells and fibroblasts mixed and plated together in rBM and overlaid with 2% rBM. Quenched fluorescent protein substrates (DQ-collagens IV and I) are mixed with rBM and collagen I, respectively. Note the more extensive degradation and increased size of 231 structures in the presence of fibroblasts. Red, magenta, and green represent 231 tumor cells, fibroblasts, and fluorescent cleavage products of the substrates, respectively
Fig. 2.
Schematic cross-sectional view of custom chambers for 3D growth and live-cell imaging of pathomimetic avatars. In this chamber design, each two wells are linked by an open channel to allow cell migration and sharing of factors secreted into culture media by cells in each well
3.3 Perform 4D (3D + Time) Imaging of Live 3D Cultures/Co-cultures by Confocal Microscopy
Cultures/co-cultures are imaged live on confocal microscopes (see Note 4).
Optical sections are captured at intervals throughout the entire depth of the structures. The intervals used depend on the depth of the structures.
Optical sections are used to reconstruct images in 3D using Volocity software.
3.4 Quantification of Proteolysis in Live 3D Cultures/Co-cultures
Methods for quantification have been published in detail in Current Protocols in Cell Biology [8].
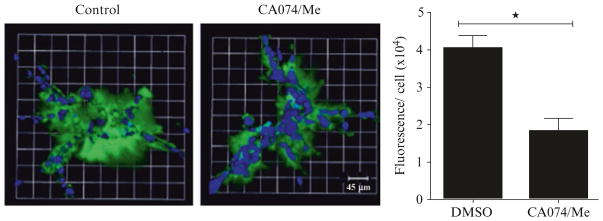
In Fig. 3, we show images of degradation fragments of DQ-collagen IV in 4 day-cultures of MDA-MB-231 cells in the presence and absence of protease inhibitors and quantification of the volume of degradation fragments on a per cell basis.
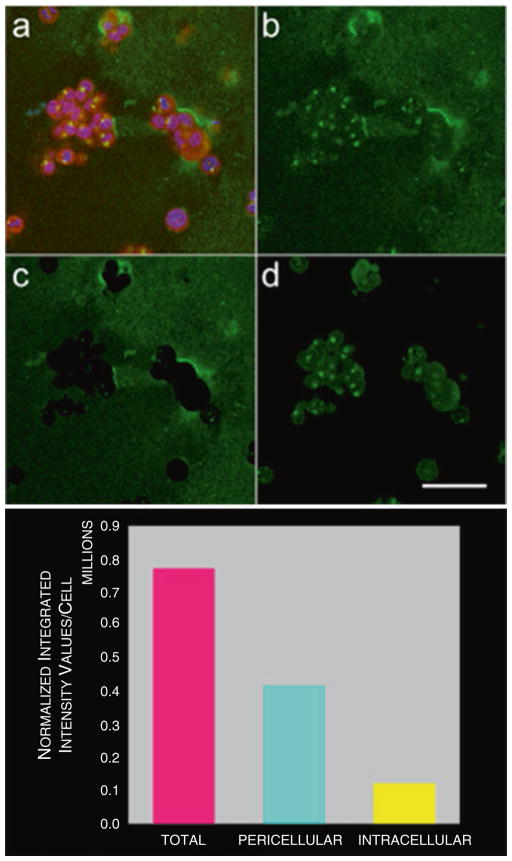
In Fig. 4, we show an example of how total proteolysis is quantified and separated into the proteolysis present in the cytoplasm and that present extracellularly.
Fig. 3.
Degradation of DQ-collagen IV by pathomimetic avatars of MDA-MB-231 human breast carcinoma cells. Top view of representative 3D reconstruction of 16 contiguous fields of MDA-MB-231 breast carcinoma structures (nuclei, blue) and associated degradation fragments of DQ-collagen IV (green) at 4 days of culture. Left panel is DMSO control and middle panel is a mixture of cathepsin B cysteine protease inhibitors (5 μM each of CA074 + CA074Me). Bar graph is quantification of degraded DQ-collagen IV per cell in MDA-MB-231 structures exposed to DMSO (negative control) and CA074/CA074Me (5 μM each). Data shown are from three independent experiments (48 fields); * ≤0.05; mean ± SD. Adapted from Ramalho et al. [10]
Fig. 4.
Quantification of degradation of DQ-collagen IV by pathomimetic avatars of HCT116 human colon carcinoma cells. (a) Single optical section of 3D pathomimetic avatar at equatorial plane showing fluorescence of cells (magenta) used for cytoplasmic binarized mask, nuclei (blue) used for counting cells, and degraded DQ-collagen IV (green). (b) Total degraded DQ-collagen IV in this optical section. (c) Pericellular degraded DQ-collagen IV in this section. (d) Intracellular degraded DQ-collagen IV in this section. Quantification of degraded DQ-collagen IV is done in each optical section of 3D volume, totaled and normalized to the number of cells. Image arithmetic is used to separate total proteolysis (magenta bar) into intracellular (yellow bar) and pericellular (cyan bar) components
Acknowledgments
We would like to thank members of the Sloane laboratory for their discussions and contributions to the development of pathomimetic avatars and Dr. Yong Xu’s lab for fabrication of TAME chambers. This work was supported in part by R01 CA131990 and R21 CA175931 from the National Institutes of Health to Dr. Sloane and an award from the President’s Research Enhancement Program of Wayne State University to Drs. Sloane and Xu. Imaging was performed in the Microscopy, Imaging and Cytometry Resources Core, which is supported, in part, by NIH Center grant P30 CA022453 to the Karmanos Cancer Institute at Wayne State University, and the Perinatology Research Branch of the National Institutes of Child Health and Development at Wayne State University.
Footnotes
Culture media (basal and growth) and supplements are ones that are optimal for breast epithelial/myoepithelial cells.
It may be necessary to agitate DQ-collagen substrates in an ultrasonic water bath for ~5 min and heat to 50 °C to facilitate dispersion.
Each series of experiments should be conducted with the same lot of rBM, in our case we use Cultrex; we reserve lots from the supplier for this purpose and before purchasing a new lot, we evaluate for its ability to support formation and growth of 3D structures.
For our studies, we have primarily used Zeiss laser scanning confocal microscopes (upright or inverted) and have also tested our custom 3D chambers in a confocal high-content imaging system.
CellTrace dyes are needed as CellTracker dyes can only be used to distinguish cells if the experiments are of short duration (preferably less than a week).
Volumes of matrices used, numbers of cells embedded or plated, and methodologies/media used may need to be modified depending on the culture platform used and growth patterns of cells being analyzed.
Plastic coverslips are used for layered cultures in which the bottom matrix is collagen I as the collagen does not adhere well to glass coverslips.
For pathomimetic avatars that mimic infiltration of fibroblasts into a tumor, we eliminate the layer of collagen I and plate rBM that contains a cell mixture of a ratio of one fibroblast to five tumor cells. See Fig. 2 for examples of both types of avatars.
Wells in our custom 3D culture chambers are the same size as in a 24-well plate.
References
- 1.Edwards D, Høyer-Hansen G, Blasi F, Sloane BF. The cancer degradome: proteases and cancer biology. Springer-Verlag; New York: 2008. [Google Scholar]
- 2.Sloane BF, List K, Fingleton B, Matrisian L. Proteases in cancer—significance for invasion and metastasis. In: Brix K, Stoecker W, editors. Proteases—structure and function. Springer-Verlag Wien; Vienna: 2013. pp. 491–550. [Google Scholar]
- 3.Lopez-Otin C, Matrisian LM. Emerging roles of proteases in tumour suppression. Nat Rev Cancer. 2007;7(10):800–808. doi: 10.1038/nrc2228. [DOI] [PubMed] [Google Scholar]
- 4.Lopez-Otin C, Bond JS. Proteases: multifunctional enzymes in life and disease. J Biol Chem. 2008;283(45):30433–30437. doi: 10.1074/jbc.R800035200. [DOI] [PMC free article] [PubMed] [Google Scholar]
- 5.Schwartz DR, Moin K, Yao B, Matrisian LM, Coussens LM, Bugge TH, Fingleton B, Acuff HB, Sinnamon M, Nassar H, Platts AE, Krawetz SA, Linebaugh BE, Sloane BF. Hu/Mu ProtIn oligonucleotide microarray: dual-species array for profiling protease and protease inhibitor gene expression in tumors and their microenvironment. Mol Cancer Res. 2007;5(5):443–454. doi: 10.1158/1541-7786.MCR-06-0337. [DOI] [PubMed] [Google Scholar]
- 6.Kappelhoff R, Auf dem Keller U, Overall CM. Analysis of the degradome with the CLIP-CHIP microarray. Methods Mol Biol. 2010;622:175–193. doi: 10.1007/978-1-60327-299-5_10. [DOI] [PubMed] [Google Scholar]
- 7.Acuff HB, Sinnamon M, Fingleton B, Boone B, Levy SE, Chen X, Pozzi A, Carbone DP, Schwartz DR, Moin K, Sloane BF, Matrisian LM. Analysis of host- and tumor-derived proteinases using a custom dual species microarray reveals a protective role for stromal matrix metalloproteinase-12 in non-small cell lung cancer. Cancer Res. 2006;66(16):7968–7975. doi: 10.1158/0008-5472.CAN-05-4279. [DOI] [PubMed] [Google Scholar]
- 8.Jedeszko C, Sameni M, Olive MB, Moin K, Sloane BF. Visualizing protease activity in living cells: from two dimensions to four dimensions. Curr Protoc Cell Biol. 2008;Chapter 4(Unit 4.20) doi: 10.1002/0471143030.cb0420s39. [DOI] [PMC free article] [PubMed] [Google Scholar]
- 9.Sameni M, Tovar EA, Essenburg CJ, Chalasani A, Linklater ES, Borgman A, Cherba DM, Anbalagan A, Winn ME, Graveel CR, Sloane BF. Cabozantinib (XL184) inhibits growth and invasion of preclinical TNBC models. Clin Cancer Res. 2016;22(4):923–934. doi: 10.1158/1078-0432.CCR-15-0187. [DOI] [PMC free article] [PubMed] [Google Scholar]
- 10.Ramalho SD, Sharma R, White JK, Aggarwal N, Chalasani A, Sameni M, Moin K, Vieira PC, Turro C, Kodanko JJ, Sloane BF. Imaging sites of inhibition of proteolysis in pathomimetic human breast cancer cultures by light-activated ruthenium compound. PLoS One. 2015;10(11):e0142527. doi: 10.1371/journal.pone.0142527. [DOI] [PMC free article] [PubMed] [Google Scholar]


