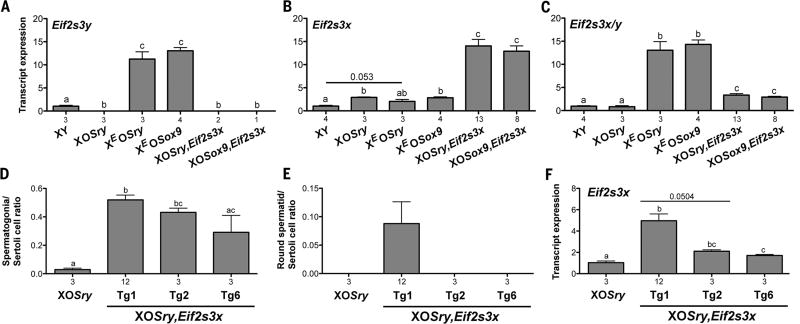
Fig. 2. Relation between Eif2s3x/y expression and spermatogenesis progression.
(A to C) Transcript levels of endogenous and transgenic spermatogonial proliferation factors quantified by real-time polymerase chain reaction with Actb as a loading control and XY serving as reference control. (D to F) Analysis of spermatogenesis progression (D and E) and Eif2s3x expression (F) in XOSry,Eif2s3x males with 4 (Tg1) and 1 (Tg2 and Tg6) Eif2s3x transgene copies. Means ± SEM, with n under the x axis; bars with different letters are statistically different (t test, P < 0.05).

