

Abstract
The traumatic biomechanical forces associated with mild traumatic brain injury (mTBI) typically impart diffuse, as opposed to focal, brain injury potentially disrupting the structural connectivity between neural networks. Graph theoretical analysis using diffusion tensor imaging was used to assess injury‐related differences in structural connectivity between 23 children (age 11–16 years) with mTBI and 20 age‐matched children with isolated orthopedic injuries (OI) scanned within 96 h postinjury. The distribution of hub regions and the associations between alterations in regional network measures and symptom burden, as assessed by the postconcussion symptom scale score (PCSS), were also examined. In comparison to the OI group, the mTBI group was found to have significantly higher small‐worldness (P < 0.0001), higher normalized clustering coefficients (P < 0.0001), higher normalized characteristic path length (P = 0.007), higher modularity (P = 0.0005), and lower global efficiency (P < 0.0001). A series of hub regions in the mTBI group were found to have significant alterations in regional network measures including nodal degree, nodal clustering coefficient, and nodal between‐ness centrality. Correlation analysis showed that PCSS total score acquired at the time of imaging was significantly associated with the nodal degree of two hubs, the superior frontal gyrus at orbital section and the middle frontal gyrus. These findings provide new evidence of acute white matter alteration at both global and regional network level following mTBI in children furthering our understanding of underlying mechanisms of acute neurological insult associated with mTBI. Hum Brain Mapp 36:779–792, 2015. © 2014 Wiley Periodicals, Inc.
Keywords: acute, mTBI, structural connectivity, graph theoretical analysis, DTI, small‐worldness, network
INTRODUCTION
Annually in the United States, over 650,000 children are evaluated acutely following a traumatic force to the brain that imparts an impairment of neurologic function commonly classified as mild traumatic brain injury (mTBI) [Faul et al., 2010; Langlois et al., 2004]. Findings from conventional computed tomography or magnetic resonance imaging are typically normal following mTBI. However, these children have a variety of somatic, cognitive, and behavioral symptoms suggestive of underlying neurologic injury. In part due to the diffuse and subtle nature of mTBI, reliable and valid indices of acute injury that elucidate underlying neuroanatomical injury mechanisms or predict longer‐term outcomes are lacking. The absence of valid markers of acute mTBI has limited our ability to establish prognostic models, develop focused treatments, and stratify patients for interventional trials.
In recent years, graph theory emerged as a promising tool that allows for characterizing the brain connectivity in a complex network, structurally or functionally, at both global and regional levels [Bullmore and Sporns, 2009; Rubinov and Sporns, 2010]. In this approach, the brain is modeled as a network composed of a number of nodes and edges connecting these nodes. The nodes and edges, respectively represent individual cortical and subcortical regions responsible for various brain functions and whiter matter fibers responsible for transferring information among these regions. Based on graph theoretical analysis, the integrity of the structural connectivity of the brain can be represented by a series of network measures that quantify the segregation and/or the integration features of the network topology [Sporns 2013]. Small‐worldness, a global network measure that quantifies the balance between integration and segregation among all the nodes in the network, is arguably the most often used topological feature reported in the literature. The concept of small‐worldness originated in investigations of social network connectivity. When applied in neuroscience, the small‐worldness and other measures based on graph theory analysis have shown to be sensitive to development [Bassett et al., 2011; Dennis et al., 2013; Hagmann et al. 2010], cognitive ability [Ajilore et al., 2014; Reijmer et al., 2013; Vaessen et al., 2012; Vecchio et al., 2014] and impaired structural connectivity in various patient populations and conditions such as schizophrenia, Alzheimer's disease, Parkinson's disease, epilepsy, stroke, aging, and drug abuse [Bassett et al., 2008; Bernhardt et al., 2011; Daianu et al., 2013; Kim et al., 2011; Lo et al., 2010; Liu et al., 2008; Onoda and Yamaguchi, 2013; Shi et al., 2012; van Meer et al., 2012; Zalesky et al., 2011].
Damage to white matter integrity following TBI can potentially disrupt connections in a widely distributed network. Consequently, graph theory analysis may provide a logical tool for elucidating underlying changes in the network connectivity in children after TBI. This approach based on graph theory has been adopted in a few recent TBI studies using either functional MRI for functional connectivity analysis or diffusion tensor imaging (DTI) for structural connectivity analysis [Caeyenberghs et al., 2012a, b, c, 2013; Messé et al., 2013; Nakamura et al., 2009; Pandit et al., 2013]. However, most of these studies involved patients with moderate to severe TBI, and all the studies that investigated structural connectivity were conducted during the chronic stage of recovery [Caeyenberghs et al., 2012b, c, 2013]. A single study has investigated connectivity based on graph theory following mTBI but it was in adults and was during the subacute and chronic stage using resting state functional MRI [Messé et al., 2013]. In this study, adults with mTBI and evidence of postconcussion syndrome based on later evaluation were found to have significant abnormality in various network measures in comparison to the controls in the temporal region and thalamus at the subacute stage (1–3 weeks postconcussion). The network measures from these patients were also found to differ significantly from the control group in the frontal regions at the chronic stage (6 months postconcussion). To our knowledge, no studies have reported findings of structural connectivity based on graph theory analysis in children with mTBI acutely following injury.
In the present study, we used DTI fiber tracking and graph theory analysis to investigate the integrity of structural connectivity in the brain networks of children within 96 h of mTBI. We tested the hypothesis that the small‐worldness in the brain networks of children with mTBI is significantly lower in comparison to those of orthopedically injured controls (OI group). In general, we hypothesized that both global and local topological features would differ significantly between the two groups. Additionally, we also investigated whether the network measures in children with mTBI were correlated with total symptom burden as measured by the postconcussion symptom scale (PCSS). We anticipated that disruptions in white matter connectivity would be associated with symptom severity with children with greater disruption reporting higher levels of PCS symptoms.
METHODS
Participants
Two groups of children were prospectively enrolled from the emergency department within 96 h of injury. The first group included 23 children (age between 11.0 and 16.7 years) who sustained either a blow to the head or an injury with acceleration/deceleration movement to the head, a Glasgow coma scale (GCS) score of 14–15 on presentation to the emergency department (ED), and any one of the following: (i) loss of consciousness <30 min, (ii) amnesia, (iii) any alteration in mental state at the time of the injury. The second group included 20 children (age between 11.1 and 16.6 years) with isolated extremity orthopedic injury (OI) with an Abbreviated Injury Severity Score of less than 4, for whom an X‐ray was obtained. Any findings suggestive of brain injury (e.g., loss of consciousness or symptoms of brain concussion) would exclude a participant with OI from the present study.
Children with any pre‐existing neurological condition, learning disabilities, behavioral disorders, or prior concussions were excluded from either group. Baseline behavioral, emotional and social capacity was assessed by the child behavior checklist [CBCL, Achenbach and Edelbrock, 1983]. Children who received a T‐score of 65 or greater were excluded due to likelihood of pre‐existing problems. The CBCL scores of the two study groups were 45.0 ± 11.6 in mTBI and 43.0 ± 12.9 in the OI group.
The study was approved by the Institutional Review Board at the participating institution. Families of participants gave written informed consent and children provided written assent.
MRI/DTI data acquisition
MR imaging data were obtained within 96 h of injury. Among the 43 participants, 42 participants were scanned within 72 h postinjury. One patient with mTBI was scanned after 72 h but before 96 h postinjury. DTI data were acquired on a 3 Tesla Phillips scanner with a single‐shot echo planar imaging sequence. The acquisition parameters were as follows: TR/TE = 9000/84 ms; field of view (FOV) = 256 × 256 mm2; acquisition matrix = 128×128; in‐plan resolution = 2 × 2 mm2; number of slices = 76; slice thickness = 2 mm; 61 noncolinear diffusion‐weighted directions (b = 1000 s/mm2); One volume of images with no diffusion sensitization; sensitivity encoding factor 2. High resolution 3D T1‐weighted anatomical images were acquired with a magnetization prepared rapid gradient echo sequence with the following specifications: TR/TE = 8.1/3.7 ms; FOV = 256 × 256; acquisition matrix = 256×256; sagittal in‐plan resolution: 1 × 1 mm2; slice thickness = 1mm; number of slices = 180.
MRI/DTI Data Processing and Tractography
The overall imaging data processing and graph theory analysis workflow are illustrated in Figure 1. Subject head motion and eddy current artifact were corrected by aligning all 61 noncolinear diffusion‐weighted images with the b0 image using an affine transformation (Functional MRI of The Brain's (FMRIB's) linear image registration tool) implemented in FMRIB's Diffusion Toolbox in FSL Software (FMRIB, Oxford, UK). The high resolution T1‐weighted images were down‐sampled and registered to the 2 mm‐iso T1 brain template in Montreal Neurological Institute (MNI) space (Montreal Neurological Institute 152). The inverse transformation was then calculated and used to transform the parcelated regions of interest (ROI) from the MNI space back to subject's native space (to b0). In this study, the Automated Anatomical Labeling Atlas (AAL atlas) was used to parcellate the brain structures into 116 regions.
Figure 1.
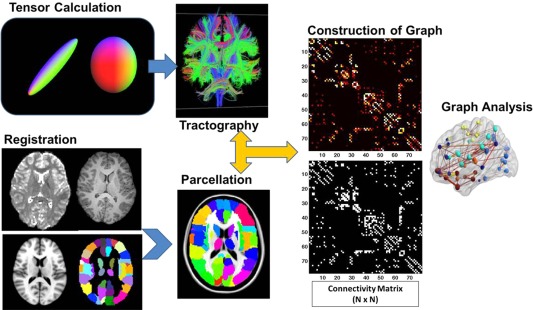
Data processing workflow for structural connectivity analysis using DTI and graph theoretical analysis.
In subject's native space, diffusion tensor reconstruction and whole brain fiber tracking were conducted using Diffusion Toolkit/TrackVis [Hess et al., 2006; Wang 2007]. Diffusion tensor calculation was based on a linear least‐square fitting algorithm [Wang 2007]. Tractography was performed based on a deterministic tracking algorithm (FACT: Fiber Assignment by Continuous Tracking). An angular threshold of 70° was used to exclude high curvature streamlines. A fiber length threshold of 20 mm was used to avoid spurious results from fiber tracking.
Construction of Connectivity Matrix
The UCLA Multimodal Connectivity Package (Bassett et al., 2011) was used to construct a connectivity matrix for graph analysis. In preliminary analyses, some of the vermis regions of cerebellum were found to be isolated (i.e., no streamlines generated from the region based on the fiber tracking) in both study groups due perhaps to the compromised signal to noise ratio level in cerebellum. To exclude the potential confounding effect, the 26 subdivisions in cerebellum were not included in the construction of connectivity matrix for the brain network. The 90 cortical and subcortical brain regions (Table 1) initially parcellated in MNI space based on the AAL atlas were inversely warped back to subjects' native space. These 90 regions were used as masks to guide the counting of white matter streamlines. A 90×90 square connectivity matrix was thus constructed with the value in each entry equal to the number of streamlines connecting the corresponding pair of brain regions.
Table 1.
Cortical and subcortical brain regions defined in the AAL atlas. 45 regions for each hemisphere
| Region name | Abbreviation | Region name | Abbreviation |
|---|---|---|---|
| PrecCentral Gyrus | PreCG | Lingual Gyrus | LG |
| Superior Frontal Gyrus | SFG | Superior Occipital Gyrus | SOG |
| Superior Frontal Gyrus – orbital | SFGorb | Middle Occipital Gyrus | MOG |
| Middle Frontal Gyrus | MFG | Inferior Occipital Gyrus | ICG |
| Middle Frontal Gyrus – orbital | MFGorb | Fusiform Gyrus | FG |
| Inferior Frontal Gyrus – opercular | IFGop | Postcentral_L | PostCG |
| Inferior Frontal Gyrus – triangular | IFGtri | Superior Parietal Gyrus | SPG |
| Inferior Frontal Gyrus – orbital | IFGorb | Inferior Parietal Gyrus | IPG |
| Rolandic Operculum | ROL | SupraMarginal Gyrus | SMG |
| Supplementary Motor area | SMA | Angular Gyrus | AG |
| Olfactory Cortex | OLFC | Precuneus | PCUN |
| Superior Frontal Gyrus, Medial | SFGmed | Paracentral Lobule | PCL |
| Superior Frontal Gyrus – Medial orbital | SFGmorb | Caudate | CAU |
| Rectus gyrus | RG | Putamen | PUT |
| Insula | INS | Pallidum | PAL |
| Anterior Cingulate Gyrus | ACG | Thalamus | THAL |
| Medial Cingululate Gyrus | MCG | Heschl Gyrus | HG |
| Posterior Cingulate Gyrus | PCG | Superior Temporal Gyrus | STG |
| Hippocampus | HCP | Superior Temporal_Gyrus – temporal pole | STGtp |
| ParaHippocampal Gyrus | PHG | Middle Temporal Gyrus | MTG |
| Amygdala | AMG | Middle Temporal Gyrus – temporal pole | MTGtp |
| Calcarine and surrounding cortex | CAL | Inferior Temporal Gyrus | IFG |
| Cuneus | CUN |
Graph Theoretical Analysis and Network Variables
Graph theoretical analysis was performed using Brain Connectivity Toolbox [Rubinov and Sporns, 2010]. Additional in‐house Matlab scripts were used to calculate different variables for network connectivity measures.
In graph theory, a network G is defined by the nodes and the connections (edges) that link these nodes. Mathematically, a graph, or equivalently an adjacency matrix, is used to represent the network. The topological features and the behavior of the brain network, or the so‐called structural connectivity, can be characterized via a series of global and local network measures. In the present study, the global network measures analyzed included normalized clustering coefficient (gamma, γ), normalized characteristic path length (lambda, λ), small‐worldness (sigma, σ), global efficiency (Eglob), average local efficiency (Eloc), and modularity (MOD). We also analyzed regional network measures in hub nodes including nodal degree (Ki), nodal clustering coefficient (Ci), and nodal between‐ness centrality (bi). As the graph theory has been applied extensively in neuroscience research [example of review papers: Bassett and Bullmore 2009; Bullmore and Bassett, 2011; Bullmore and Sporns 2009; He and Evans, 2010; Zuo et al., 2012], only a brief description is provided as shown in Table 2. All the network variables calculations were based on the definitions of Rubinov and Sporns [2010].
Table 2.
Network measures used in the study
| Regional (nodal) network measures | |
|---|---|
| Degree (Ki) | Ki is the total number of connections linking the node with all other nodes |
| Clustering Coefficient (Ci) | Ci is the ratio between the existing number of edges among the neighbors of the node and the maximum possible number of connections among these neighbors. It quantifies the cliquishness and reflects the regional efficiency |
| Betweenness Centrality (bi) | bi is the fraction of shortest path between all other pair of nodes in the network that actually pass through the node of interest, which is a variable that reflect the importance of the node in information transferring with other nodes. |
| Global network measures | |
| Network clustering coefficient (C) | C is the network average of nodal clustering coefficient. It is a measure of the level of segregation in the entire system. |
| Characteristic path length (Lp) | Lp is the network average of shortest path lengths. The shortest path length between two nodes is the geodesic distance, i.e., the smallest number of edges between these two nodes. Lp is an indirect quantification of possible long fiber connections acting as short‐cuts (in the sense of topological distance, not the physical proximity) in the network. It is a global property that quantifies the level of integration in the network. |
| Normalized clustering coefficient (γ) | γ = C/Crand. Crand is the clustering coefficient calculated from a null random network constructed with the degree and degree distribution preserved to reflect the real brain network under investigation |
| Normalized characteristic path length (λ) | λ = Lp/Lrand. Lrand is the characteristic path length calculated from a null random network constructed with the degree and degree distribution preserved to reflect the real brain network under investigation |
| Small‐worldness (σ) | σ = γ/λ. σ reflects the balance between integration and segregation among all the nodes in the network. |
| Global efficiency (Eglob) | Eglob is defined as the inverse of average shortest path length. It reflects the network efficiency in transferring information. |
| Average local efficiency (Eloc) | Eloc is defined as the average of local efficiency of all individual nodes. It reflects system redundancy and tolerance to attack |
| Modularity (MOD) | MOD quantifies the level of partitioning of network into nonoverlapping modules in which nodes within the same module are densely interconnected but they only have sparse connections with nodes from other modules. |
In the present study, the definition of hub was based on the ranking of three nodal network measures: degree, betweeness centrality, and clustering coefficient. A node was first ranked separately for each measure with a score between 1 and 90, with 90 as the highest possible score for each category if a node has highest nodal degree or highest betweeness centrality or lowest clustering coefficient. The nodes with the top 20% of the rank sum score (18 of 90 total nodes) were classified as hub nodes, representing the brain regions that were most highly connected, most central, and least clustered [Ottet et al. 2013].
Postconcussion Symptom Scale
Participants in both groups were asked to complete the PCSS at presentation in the ED and repeated at the time of imaging. PCSS is a 22‐item inventory of symptoms associated with concussion and is graded on 7‐point Likert scale with ratings of 0 and 6 corresponding to none and severe respectively [Lovell et al., 2006]. The total score of PCSS was used in the present study.
Statistical Analysis
Group differences in the global network connectivity variables as defined above were tested with two tailed t‐test at significance level of P < 0.05. The comparison was first made at a commonly used network cost threshold of 0.2. We also repeated the test over a large range of cost threshold (between 0.1 and 0.3) to ensure the findings remained independent of threshold selection. At each threshold level, multiple comparisons were corrected using false discovery rate (FDR) method.
Network hubs were identified based on the combined index of three local network measures as described above (nodal degree Ki, nodal clustering coefficient Ci, and nodal betweeness centrality bi). Group differences of these three local network measures were tested with t‐test for the hub areas at network cost threshold of 0.2. Multiple comparison effect for local network variables was also corrected using FDR method. In those hubs that were found to differ significantly between groups, we examined the correlation between the local network connectivity variables and the PCSS score at the time of scan within the mTBI group.
RESULTS
Forty‐three participants were included in this study. The participants were 23 children with mTBI (Mean age ± STD = 13.7 ± 1.8 years; F/M= 2/21) and 20 children with an OI (Mean age ± STD = 13.2 ± 1.4 years; F/M = 4/16). No statistically significant difference was found in age or sex between the two study groups at P‐level of 0.05 (t‐test for age; Fisher's exact test for sex). Sports injury was the most frequent mechanism of injury for both groups (17/23 for mTBI vs. 16/20 for OI) and neither group was injured by motor vehicle collisions. Children with mTBI presented the following features: GCS of 14 (1/23), level of consciousness (LOC) (8/23), amnesia (12/23), and other changes in mental status (12/23). Children with mTBI had greater symptom burdens as measured by the total PCSS at presentation in the ED and at the time of the scan than children with OI (Total PCSS ± STD = 37.8 ± 19.6 vs. 18.3 ± 15.2 in the ED, P = 0.0009; and 25.5 ± 21.7 vs. 9.9 ± 10.2 at the scan, P = 0.005). The CBCL scores of the two study groups were 45.0 ± 11.6 in mTBI and 43.0 ± 12.9 in the OI group. There was no statistical difference in time from injury to scan between the mTBI and OI group (Mean ± STD = 45 ± 17.6 vs. 48.2 ± 21.1 h, respectively, P = 0.59).
Initial linear regression analysis showed that there was no association between age and any of the global network parameters examined in either the mTBI group or the OI group. Therefore, the group comparisons were made using two‐tailed t‐test for independent samples.
Group Difference in Global Network Variables
At a fixed wiring cost 0.2, our data showed that the brain networks in both the mTBI and OI groups preserved small‐world characteristics [γ >> 1, λ ≈ 1, and σ >> 1 as described Watts and Strogatz, 1998; Table 3]. The mTBI group was found to have significantly higher γ (P < 0.0001), higher λ (P = 0.007), and higher σ (P < 0.0001) when compared to the OI group. (Table 3; Fig. 2A–C). The mTBI group was also found to have significantly lower global efficiency (Eglob, P < 0.0001) and higher modularity (MOD, P = 0.0005) when compared to the OI group (Table 3, Fig. 2D,F). No significant difference was found in mean local efficiency (Eloc) between the two groups (Table 3, Fig. 2E).
Table 3.
Global network measures at network cost of 0.2. P values are corrected with FDR methods
| Global network measures | CTL n = 20 (Mean ± Std) | TBI n = 23(Mean ± Std) | P (corrected) |
|---|---|---|---|
| γ | 2.094 ± 0.052 | 2.215 ± 0.059 | <0.0001 |
| λ | 1.090 ± 0.010 | 1.099 ± 0.010 | 0.007 |
| σ | 1.920 ± 0.045 | 2.014 ± 0.052 | <0.0001 |
| Eglob | 0.563 ± 0.004 | 0.556 ± 0.003 | <0.0001 |
| Mean Eloc | 0.763 ± 0.008 | 0.764 ± 0.008 | NS |
| MOD | 0.372 ± 0.017 | 0.391 ± 0.011 | 0.0005 |
γ = normalized clustering coefficient; λ = normalized characteristic path length; σ = small‐worldness; Eglob = global efficiency; Eloc = local efficiency; MOD = modularity.
Figure 2.
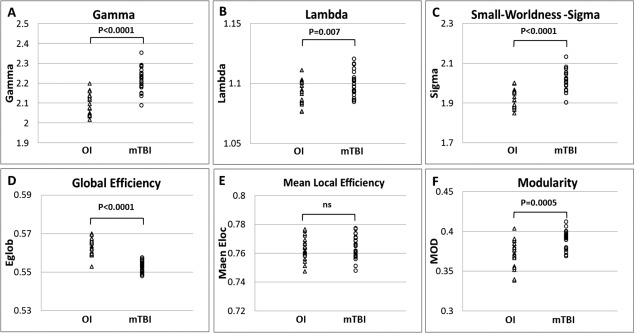
Comparison of global network measures at wiring cost 0.2.(A) Normalized Clustering Coefficient, Gamma; (B) Normalized Characteristic Path Length, Lambda; (C) Small‐worldness, Sigma; (D) Global Efficiency, Eg; (E) Mean Local Efficiency; (F) Modularity, MOD.
As the values of all the network measures are known to be sensitive to the network wiring cost (i.e., how densely the network is connected among the nodes) threshold, the group comparison was repeated over the range of wiring cost between 0.1 and 0.3 with an interval of 0.01. As shown in Figure 3, the statistical significance of the intergroup contrast observed at cost level of 0.2 as described above was preserved over the whole range between 0.1 and 0.3 for γ, σ, and Eglob. The intergroup contrast also remained statistically significant for λ and MOD for most of the threshold levels tested in the comparisons. The group difference was not significant between cost 0.1 and 0.13 for λ and at cost level of 0.29 for MOD. The group difference in Eloc was statistically significant only at cost level of 0.1–0.13 but not at other threshold levels examined.
Figure 3.
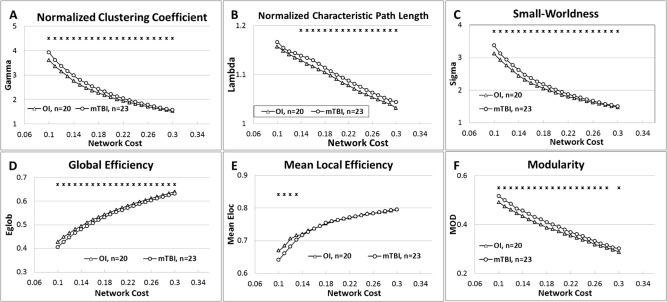
Comparison of Global Network Measures across different network cost from 0.1 to 0.3. (A) Normalized Clustering Coefficient; (B) Normalized Characteristic Path Length; (C) Small‐worldness; (D) Global Efficiency; (E) Mean Local Efficiency; and (F) Modularity.
Similar Network Hub Regions in the Two Study Groups
Based on the approach as described in Method section, 18 nodes (20% of the total 90 nodes) were identified as hubs for both study groups. Figure 4 shows the ranking scores of the three local network variables, with the overall bar height representing the sum ranking scores. The brain regions were sorted by the sum ranking score in descending order in the OI network (Fig. 4A) and mTBI network (Fig. 4B), respectively.
Figure 4.
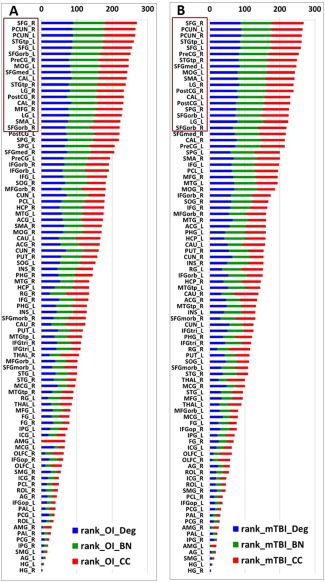
Final ranking of the 90 gray matter areas in the OI group (A) and mTBI group (B). The nodes are listed in the order of rank sum score with nodal degree, betweeness centrality, and clustering coefficient in blue, green, and red, respectively. The nodes with top 20% highest rank sum scores (n = 18 in each group) are highlighted in brown. OI: orthopedic injury control group; TBI: mTBI patient group; BN: normalized betweeness centrality; Deg: degree; CC; clustering coefficient. Abbreviations for node names can be found in Table 1.
As shown in Figure 4 and Table 4, the hubs identified in the two groups were similar. Sixteen network nodes, including bilateral superior frontal gyrus, bilateral superior frontal gyrus orbital part, bilateral lingual gyrus, bilateral precuneus gyrus, bilateral superior temporal gyrus temporal pole, right precentral gyrus, left supplementary motor area, left calcarine, and surrounding cortex, left middle occipital gyrus, right post central gyrus, and left medial superior frontal gyrus were identified as hubs for both groups. In addition, two brain regions, right middle frontal gyrus and right calcarine and surrounding cortex, were identified as hubs for the OI but not the mTBI group. Two other areas, right superior parietal gyrus and left post central gyrus, were identified as hubs for the mTBI but not the OI group.
Table 4.
Group comparison of regional network measures (Ki, Ci, and bi) between mTBI and OI controls
| Region | OI Hub | mTBI Hub | Ki | Ci | bi | ||||||
|---|---|---|---|---|---|---|---|---|---|---|---|
| OI n = 2 0 Mean ± STD | mTBI n = 23 Mean ± STD | P | OI n = 20 Mean ± STD | mTBI n = 2 Mean ± STD 3 | P | OI n = 20 Mean ± STD | mTBI n = 23 Mean ± STD | P | |||
| SFG_R | hub | hub | 35.2 ± 6.0 | 30.8 ± 5.2 | 0.0159 | 0.320 ± 0.034 | 0.337 ± 0.040 | ns | 0.066 ± 0.031 | 0.056 ± 0.026 | ns |
| PCUN_R | hub | hub | 34.8 ± 5.9 | 31.7 ± 5.5 | 0.0887 | 0.365 ± 0.048 | 0.368 ± 0.045 | ns | 0.048 ± 0.023 | 0.042 ± 0.023 | ns |
| PCUN_L | hub | hub | 35.0 ± 5.9 | 31.7 ± 3.6 | 0.0434 | 0.369 ± 0.047 | 0.362 ± 0.041 | ns | 0.046 ± 0.026 | 0.041 ± 0.015 | ns |
| STGtp_L | hub | hub | 28.6 ± 4.5 | 28.0 ± 3.2 | ns | 0.385 ± 0.064 | 0.368 ± 0.045 | ns | 0.038 ± 0.019 | 0.042 ± 0.017 | ns |
| SFG_L | hub | hub | 28.3 ± 6.5 | 29.5 ± 6.1 | ns | 0.419 ± 0.095 | 0.397 ± 0.097 | ns | 0.036 ± 0.029 | 0.043 ± 0.025 | ns |
| SFGorb_L | hub | hub | 26.0 ± 6.3 | 21.5 ± 5.8 | 0.0195 | 0.393 ± 0.067 | 0.429 ± 0.089 | ns | 0.028 ± 0.018 | 0.020 ± 0.014 | ns |
| PreCG_R | hub | hub | 24.8 ± 3.2 | 25.3 ± 4.3 | ns | 0.400 ± 0.051 | 0.388 ± 0.050 | ns | 0.029 ± 0.017 | 0.037 ± 0.016 | ns |
| MOG_L | hub | hub | 25.8 ± 5.7 | 24.1 ± 5.3 | ns | 0.424 ± 0.076 | 0.413 ± 0.073 | ns | 0.031 ± 0.021 | 0.031 ± 0.016 | ns |
| SFGmed_L | hub | hub | 25.9 ± 4.0 | 26.3 ± 6.5 | ns | 0.422 ± 0.056 | 0.405 ± 0.066 | ns | 0.022 ± 0.012 | 0.029 ± 0.020 | ns |
| CAL_L | hub | hub | 27.1 ± 3.3 | 24.3 ± 4.8 | 0.0346 | 0.436 ± 0.044 | 0.451 ± 0.087 | ns | 0.021 ± 0.009 | 0.022 ± 0.013 | ns |
| STGtp_R | hub | hub | 24.8 ± 5.4 | 25.1 ± 4.8 | ns | 0.433 ± 0.052 | 0.395 ± 0.056 | 0.0262 | 0.024 ± 0.016 | 0.030 ± 0.014 | ns |
| LG_R | hub | hub | 25.6 ± 4.4 | 25.7 ± 4.8 | ns | 0.439 ± 0.049 | 0.433 ± 0.077 | ns | 0.021 ± 0.013 | 0.026 ± 0.018 | ns |
| PostCG_R | hub | hub | 23.2 ± 4.3 | 22.9 ± 3.7 | ns | 0.438 ± 0.060 | 0.417 ± 0.060 | ns | 0.028 ± 0.014 | 0.030 ± 0.015 | ns |
| CAL_R | hub | Non‐hub | 26.2 ± 4.0 | 22.8 ± 3.9 | 0.0079 | 0.451 ± 0.050 | 0.470 ± 0.066 | ns | 0.021 ± 0.010 | 0.017 ± 0.011 | ns |
| MFG_R | hub | Non‐hub | 23.3 ± 5.7 | 20.2 ± 5.2 | 0.0711 | 0.450 ± 0.103 | 0.483 ± 0.085 | ns | 0.022 ± 0.016 | 0.014 ± 0.015 | 0.0973 |
| LG_L | hub | hub | 25.1 ± 4.7 | 23.0 ± 4.8 | ns | 0.451 ± 0.062 | 0.458 ± 0.084 | ns | 0.020 ± 0.012 | 0.021 ± 0.014 | ns |
| SMA_L | hub | hub | 23.3 ± 4.9 | 24.1 ± 4.3 | ns | 0.446 ± 0.066 | 0.404 ± 0.046 | 0.0221 | 0.019 ± 0.013 | 0.028 ± 0.019 | 0.0639 |
| SFGorb_R | hub | hub | 21.2 ± 5.1 | 20.0 ± 5.6 | ns | 0.419 ± 0.074 | 0.405 ± 0.062 | ns | 0.018 ± 0.011 | 0.019 ± 0.013 | ns |
| PostCG_L | non‐hub | hub | 21.6 ± 4.2 | 22.3 ± 4.7 | ns | 0.464 ± 0.070 | 0.435 ± 0.062 | ns | 0.022 ± 0.014 | 0.029 ± 0.016 | ns |
| SPG_R | non‐hub | hub | 23.3 ± 5.2 | 22.5 ± 4.3 | ns | 0.453 ± 0.067 | 0.437 ± 0.066 | ns | 0.020 ± 0.012 | 0.022 ± 0.011 | ns |
ns: not significant; bi: normalized nodal betweeness centrality; Ki: nodal degree; Ci: nodal clustering coefficient. Abbreviation of regions can be found in Table I.
Group Difference in Local Network Measures in Hub Regions
Group comparisons were made for each one of the 20 regions that was classified as hub in either one or both study groups. Among them, 7 hubs in the mTBI group, including right frontal gyrus (SFG_R), left superior frontal gyrus orbital part (SFGorb_L), right middle frontal gyrus (MFG_R), bilateral calcarine and surrounding cortex (CAL), and bilateral precuneus, were found to have significantly decreased nodal degree (P < 0.05), or at least at trend level (0.05 < P < 0.1), when compared to the control group (all P values corrected for multiple comparison, Table 4). Two mTBI hubs, left supplementary motor area (SMA_L) and right superior temporal gyrus temporal pole (STGtp_R) were found to have significantly lower clustering coefficients (P < 0.05). No statistically significant difference was found in the normalized betweeness‐centrality in any of these hub regions.
Correlation between Network Variables and PCSS Scores in mTBI Group
The total PCSS score at the time of the scan was significantly higher in children in the mTBI group as compared to the OI group (Mean ± STD = 25.5 ± 21.7 and 9.9 ± 10.2, respectively, P < 0.005). No statistically significant correlation was found between PCSS score at the time of scan and values of any of the global network measures in children with mTBI. Among the hub regions that were found to have significant group differences in local network measures, significant correlations between total PCSS score and nodal degree were found for two hubs, the SFGorb_L and MFG_R (P < 0.05, not corrected, Fig. 5). Among those hub regions that did not have significant group differences, the total PCSS scores in patients at time of scan were positively correlated with nodal clustering coefficient in LG_R (P = 0.018, not corrected) and normalized betweeness centrality in SFGorb_L, SFGorb_R, and CAL_L (P = 0.0178, 0.0173, 0.0017, respectively, not corrected). No other significant correlation was found in any other hubs in any of the three local network measures under investigation.
Figure 5.
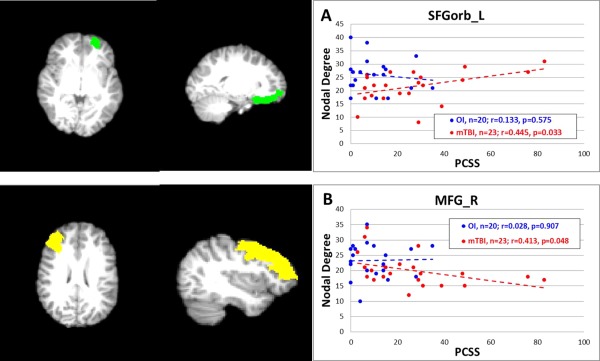
Correlation between PCSS total scores and nodal degree. (A) PCSS versus degree in SFGorb_L; (B) PCSS versus degree in MFG_R. Note: P‐value not corrected for multiple testing in the correlation analysis.
DISCUSSION
To the best of our knowledge, this is the first study that has applied graph theoretical analysis to investigate structural connectivity in children with acute mTBI. Abnormalities in functional connectivity using either resting state fMRI or task related fMRI have been reported in patients with TBI [Nakamura et al., 2009; Caeyenberghs et al., 2012a, 2013; Pandit et al., 2013; Messé et al., 2013]. To date, structural connectivity changes based on DTI using graph theoretical analysis have also been reported in adults in the chronic phase following moderate and severe TBI. [Caeyenberghs et al., 2012b, c, 2013]. Only a single published study [Messé et al., 2013] examined network connectivity based on graph theory analysis in adults with mTBI during the subacute or even later phase following mTBI (1–3 weeks and 6 months postinjury). Thus, the current findings address a significant gap in the knowledge base regarding network characteristics following mTBI in children during the acute stage when neurophysiology undergoes rapid changes.
Small‐worldness (σ) quantifies the balance between segregation and integration of information processing and communication in the system. According to the criteria by Watts and Strogatz [1998] as well as others [Achard et al., 2006; Humphries et al., 2006], a network is considered to have small world features if it has comparable characteristic path length (some long connections) relative to an equivalent random network but with a much higher network clustering coefficient (many short connections). A small‐world network is thus considered to be an optimal balance between the competing demand for over‐all efficiency and regional redundancy. Our data showed that, while the brain networks in the mTBI group preserved small‐world characteristics (γ >> 1, λ ≈ 1, and σ >> 1), both the γ and λ were significantly greater among those with mTBI than those in the OI group. The increase of λ has been found previously in both adults and children with TBI during the chronic stage of recovery [Pandit et al., 2013; Caeyenberghs et al., 2012b, c]. A longer path length at a global level means that information has to cross more nodes to reach its final destination [Rubinov and Sporns 2010], suggesting a decrease of efficiency in integrating the anatomically segregated brain structures. Conversely, an increased γ implies that brain regions are more connected at local level across the entire network, suggesting a higher degree of robustness and redundancy. This pattern of findings may reflect the initial adaptive response of the brain at the acute stage of injury. Caeyenberghs et al [2012c] also reported an increase of γ in adults at 4 years after moderate to severe TBI, suggesting that the increase of γ could extend to the chronic stage or even become permanent following more severe TBI. However, additional investigation is needed to clarify whether similar long term response in γ will be found in children with mTBI. In theory, the change of λ and γ can both lead to changes in the σ. In the present study, the σ in the mTBI group was found to be significantly higher driven mainly by the elevated γ. By contrast, Caeyenberghs et al. [2012c] also found higher levels of γ and λ in the TBI group but failed to find change in the σ, due perhaps to the smaller increase in γ in the adult TBI at chronic stage. Overall, the higher levels of γ, λ, and σ in the mTBI group in the present study indicated that their brain networks had lower efficiency in global integration and a higher degree of regional segregation and specialization than the OI group, thus reflecting a new balance between the competing demands for wiring cost and resilience to pathological conditions.
The topological features of brain network can be analyzed structurally based on DTI, as the approach in the present study, as well as functionally based on task‐related fMRI or resting state fMRI. The correspondence between structural and functional connectivity has recently been investigated in a series of articles exploring the level of coupling/decoupling between the two approaches in both healthy participants and those with diseases [Baria et al., 2013; Betzel et al., 2013; Hagmann et al., 2010; van den Heuvel et al., 2013; Zhang et al., 2011]. In general, evidence has shown that both functional and structural connectivity analysis yield similar global level network features and that the coupling strengthens with development and weakens or even decouples in neurological disorders such as schizophrenia and epilepsy [Van den Heuvel et al., 2013; Zhang et al., 2011]. Due to the highly sensitive nature of the graph theory method, for example, the network measures are significantly influenced by the parcellation scheme and thresholding level, it usually is not feasible to combine results from the two approaches from different studies. To date, only one recent study of TBI [Caeyenberghs et al., 2013] has analyzed both functional and structural connectivity features in the same patients. In this study, no coupling was found in the TBI patients, which was in line with the findings from other patient populations.
Network hubs refer to those nodes that are highly influential over the hierarchical organization of the entire system. They are the brain areas that carry significant weight, without which the robustness and efficiency of the entire network would be significantly compromised. The profile of hub distribution and the changes of network features related to these hub nodes can often facilitate the identification of vulnerable brain regions and help to establish the association between functional deficits and abnormalities in neuroanatomy. In the present study, the hubs identified in the two groups were similar with 16 hubs shared by both groups. It is premature, although tempting, to speculate that mTBI poses no significant impact on the hubs regions based on the absence of differences in the distribution of hubs as seen in the present study. On the contrary, previous research has shown adverse effect of neurological disorders or disease in the absence of changes in the distribution of hubs [Kim et al., 2011; Liu et al., 2012]. Our analysis demonstrated evidence of abnormalities in nodal degree, nodal clustering coefficient, or nodal betweeness centrality in certain hubs including superior frontal gyrus, middle frontal gyrus, superior parietal gyrus, precuneus, supplementary motor area, and calcarine. Some of these hub areas have been reported to be associated with TBI outcomes based on structural or functional neuroimaging findings [Correa et al., 2013; Kohl et al., 2009; Leunissen et al., 2013; Lipszyc et al., 2014; Max et al., 2006; Sanchez‐Carrion et al., 2008; Scheibel et al., 2007; Tuner and Levine, 2008; Wilde et al., 2012]. For example, the superior parietal gyrus was found to have significant changes in cortical thickness [Wilde et al., 2012] and functional activation [Kohl et al., 2009] in patients with TBI. The superior frontal gyrus abnormality, either due to its own lesion or due to lesions in the white matter (WM) connected to it, was found to be associated with impaired performance in executive functions such as response inhibition [Lipszyc et al., 2014] and task switching [Leunissen et al., 2013]. Abnormal fMRI activation patterns in both superior frontal gyrus and middle frontal gyrus have been found in TBI patients with impairments in cognitive control [Scheibel et al., 2007] and working memory [Sanchez‐Carrion et al., 2008; Turner and Levine, 2008]. Cortical thickness of the precuneus and fMRI activation in patients with TBI were found to be abnormal in association with the level of executive function deficit [Cook et al., 2013], memory impairment [Palacios et al., 2013], and attention deficits [Bonnelle et al., 2011; Kim et al., 2009]. In the supplementary motor area, lower fMRI activation has been reported in patients with TBI when they performed motor [Kasahara et al., 2010] or attentional tasks [Kim et al., 2009]. Other hub areas were not found to have significant group difference in the present study due perhaps to the mild nature of the injury, but we cannot rule out the possibility that differences may manifest later during the course of recovery. Two of the hubs from the present study, that is, the orbital portion of superior frontal gyrus and the middle frontal gyrus, were found to have significant correlations between total PCSS scores and nodal degree, suggesting a potential association between symptom severity and regional neuroanatomical changes. It is worth noting that as the P‐values in the correlation analysis were not corrected for multiple testing, caution should be taken in the interpretation of the results. Nevertheless, the analysis of group difference of local network connectivity measures and their association to the PCSS scores in the present study provided initial evidence suggesting that not only the grey matter anatomy and functions could be compromised as reported in the literature, the integrity of white matter structural connectivity associated with these regions could also be affected as the consequence of mTBI.
TBI patients commonly have cognitive deficits in frontal lobe function such as attention, memory, and executive functions, which has been supported by extensive neuroimaging evidences based on fMRI and DTI [Kim et al. 2009; Tlustos et al., 2011; Wilde et al., 2011; Yuan et al., 2007]. The present study provided new evidence for the involvement of the frontal lobe based on analysis of group difference of connectivity measures and their correlation with PCSS results. However, unlike the traditional DTI indices (e.g., Fractional Anisotropy (FA) and Mean Diffusivity (MD) values) measures in a certain white matter area, which are direct measure of diffusion property in the structure, the regional connectivity measures (e.g., nodal degree) in the present study are a reflection of strength, efficiency, or cost of the interaction of individual node (gray matter regions) with the rest of the network. Therefore, it is not feasible to make a direct comparison between the findings in the present study based on graph analysis and those from traditional DTI analyses although both approaches pointed to frontal lobe alterations.
Several limitations in the present study need to be taken into consideration when interpreting the results. First, the sample size was relatively small to account for all the potential confounding factors. We were underpowered to determine whether sex, race, injury mechanisms, family income, or other individual characteristics contributed to differences between the mTBI and OI groups. Among these factors, sex differences have been reported in some network measures such as clustering coefficient and small worldness [Dennis et al., 2013; Yan et al., 2011]. In the present study, this is not expected to affect our conclusions because the two study groups had similar male and female distribution (Fisher's exact test, P = 0.39) although both groups had a majority of males. Second, while the aim of the study was to examine neural consequences of mTBI at acute stage, imaging data were only acquired once within 96 h postinjury. No longitudinal data were available at additional time points for studying the progression of recovery. Thus, future prospective studies are clearly warranted. Third, the white matter network was constructed based on deterministic tractography using a single‐tensor model which was not ideal to differentiate crossing fibers. In future studies, a High Angular Resolution Density Imaging data acquisition and Q‐ball approach for tractography may help to address the issue.
CONCLUSION
In conclusion, the present study demonstrated that the graph theoretical analysis combined with DTI detected abnormalities in brain structural connectivity in children with acute mTBI. The current findings add to a growing body of literature documenting injury following mTBI in children to the neuronal architecture, spatially and temporally, not detected by conventional neuroimaging. Future longitudinal studies using this approach are needed to elucidate the progression of changes in the network measures and their associations with behavioral and neuropsychological outcomes. If structural connectivity can be established as an imaging biomarker for persistence of postconcussion symptoms and/or other long term functional deficits following mTBI, it will allow us to evaluate and improve our understanding of the structural physiological substrates while enabling clinicians to more effectively screen and treat youth with mTBI.
Disclosure: No competing financial interest exists for any of the authors W.Y., S.L.W., and L.B.
REFERENCES
- S Achard, R Salvador, B Whitcher, J Suckling, E Bullmore (2006): A resilient, low frequency, small‐world human brain functional network with highly connected association cortical hubs. J Neurosci 26:63–72. [DOI] [PMC free article] [PubMed] [Google Scholar]
- Achenbach TM, Edelbrock CS (1983): Manual for the Child Behavior Checklist and Revised Child Behavior Profile. Burlington, VT: University of Vermont, Department of Psychiatry. [Google Scholar]
- Ajilore O, Lamar M, Kumar A (2014): Association of brain network efficiency with aging, depression, and cognition. Am J Geriatr Psychiatry 22:102–110. [DOI] [PMC free article] [PubMed] [Google Scholar]
- Baria AT, Mansour A, Huang L, Baliki MN, Cecchi GA, Mesulam MM, Apkarian AV (2013): Linking human brain local activity fluctuations to structural and functional network architectures. NeuroImage 73:144–155. [DOI] [PMC free article] [PubMed] [Google Scholar]
- Bassett DS, Brown JA, Deshpande V, Carlson JM, Grafton ST (2011): Conserved and variable architecture of human white matter connectivity. Neuroimage 54:1262–1279. [DOI] [PubMed] [Google Scholar]
- Bassett DS, Bullmore E, Verchinski BA, Mattay VS, Weinberger DR, Meyer‐Lindenberg A (2008) Hierarchical organization of human cortical networks in health and schizophrenia. J Neurosci 28:9239–9248. [DOI] [PMC free article] [PubMed] [Google Scholar]
- Bassett DS, Bullmore ET (2009): Human brain networks in health and disease. Curr Opin Neurol 22:340–347. Review. [DOI] [PMC free article] [PubMed] [Google Scholar]
- Bernhardt BC, Chen Z, He Y, Evans AC, Bernasconi N (2011): Graph‐theoretical analysis reveals disrupted small‐world organization of cortical thickness correlation networks in temporal lobe epilepsy. Cereb Cortex 21:2147–2157. [DOI] [PubMed] [Google Scholar]
- Betzel RF, Griffa A, Avena‐Koenigsberger A, Gõni J, Thiran JP, Hagmann P, Olaf Sporns (2013). Multi‐scale community organization of the human structural connectome and its relationship with resting‐state functional connectivity. Network Sci 1:353–373. [Google Scholar]
- Bonnelle V, Leech R, Kinnunen KM, Ham TE, Beckmann CF, De Boissezon X, Greenwood RJ, Sharp DJ. (2011). Default mode network connectivity predicts sustained attention deficits after traumatic brain injury. J Neurosci 31:13442–13451. [DOI] [PMC free article] [PubMed] [Google Scholar]
- Bullmore ET, Bassett DS (2011): Brain graphs: Graphical models of the human brain connectome. Annu Rev Clin Psychol 7:113–140. Review. [DOI] [PubMed] [Google Scholar]
- Bullmore E, Sporns O (2009): Complex brain networks: Graph theoretical analysis of structural and functional systems. Nat Rev Neurosci 10:186–198. [DOI] [PubMed] [Google Scholar]
- Caeyenberghs K, Leemans A, Heitger MH, Leunissen I, Dhollander T, Sunaert S, Dupont P, Swinnen SP (2012a): Graph analysis of functional brain networks for cognitive control of action in traumatic brain injury. Brain 135(Pt 4):1293–1307. [DOI] [PubMed] [Google Scholar]
- Caeyenberghs K, Leemans A, De Decker C, Heitger M, Drijkoningen D, Linden CV, Sunaert S, Swinnen SP (2012b): Brain connectivity and postural control in young traumatic brain injury patients: A diffusion MRI based network analysis. Neuroimage Clin 1:106–115. [DOI] [PMC free article] [PubMed] [Google Scholar]
- Caeyenberghs K, Leemans A, Leunissen I, Gooijers J, Michiels K, Sunaert S, Swinnen SP (2012c): Altered structural networks and executive deficits in traumatic brain injury patients. Brain Struct Funct 219:193–209. [DOI] [PubMed] [Google Scholar]
- Caeyenberghs K, Leemans A, Leunissen I, Michiels K, Swinnen SP (2013): Topological correlations of structural and functional networks in patients with traumatic brain injury. Front Hum Neurosci 7:726. [DOI] [PMC free article] [PubMed] [Google Scholar]
- Cook LG, Hanten G, Orsten KD, Chapman SB, Li X, Wilde EA, Schnelle KP, Levin HS (2013): Effects of moderate to severe traumatic brain injury on anticipating consequences of actions in adolescents: A preliminary study. J Int Neuropsychol Soc 19:508–517. [DOI] [PubMed] [Google Scholar]
- Correa DD, Root JC, Baser R, Moore D, Peck KK, Lis E, Shore TB, Thaler HT, Jakubowski A, Relkin N (2013): A prospective evaluation of changes in brain structure and cognitive functions in adult stem cell transplant recipients. Brain Imaging Behav 7:478–490. [DOI] [PMC free article] [PubMed] [Google Scholar]
- Daianu M, Jahanshad N, Nir TM, Toga AW, Jack CR Jr, Weiner MW, Thompson PM (2013): Breakdown of brain connectivity between normal aging and Alzheimer's disease: A structural k‐core network analysis. Alzheimer's disease neuroimaging initiative. Brain Connect 3:407–422. [DOI] [PMC free article] [PubMed] [Google Scholar]
- Dennis EL, Jahanshad N, McMahon KL, de Zubicaray GI, Martin NG, Hickie IB, Toga AW, Wright MJ, Thompson PM (2013): Development of brain structural connectivity between ages 12 and 30: A 4‐Tesla diffusion imaging study in 439 adolescents and adults. Neuroimage 64:671–684. [DOI] [PMC free article] [PubMed] [Google Scholar]
- Faul M, Xu L, Wald MM, Coronado VG (2010): Traumatic Brain Injury in the United States: Emergency Department Visits, Hospitalizations and Deaths 2002–2006. Atlanta (GA): Centers for Disease Control and Prevention, National Center for Injury Prevention and Control; Available at: http://www.cdc.gov/TraumaticBrainInjury, Last accessed on 15 October, 2014.
- Hagmann P, Sporns O, Madan N, Cammoun L, Pienaar R, Wedeen VJ, Meuli R, Thiran JP, Grant PE (2010): White matter maturation reshapes structural connectivity in the late developing human brain. Proc Natl Acad Sci USA 107:19067–19072. [DOI] [PMC free article] [PubMed] [Google Scholar]
- He Y, Evans A (2010): Graph theoretical modeling of brain connectivity. Curr Opin Neurol 23:341–350. Review. [DOI] [PubMed] [Google Scholar]
- CP Hess, P Mukherjee, ET Han, D Xu, DB Vigneron (2006): Q‐ball reconstruction of multimodal fiber orientations using the spherical harmonic basis. Magn Reson Med 56:104–117. [DOI] [PubMed] [Google Scholar]
- MD Humphries, K Gurney, TJ Prescott (2006): The brainstem reticular formation is a small‐world, not scalefree, network. Proc Biol Sci 273:503–511. [DOI] [PMC free article] [PubMed] [Google Scholar]
- Kasahara M, Menon DK, Salmond CH, Outtrim JG, Taylor Tavares JV, Carpenter TA, Pickard JD, Sahakian BJ, Stamatakis EA (2010). Altered functional connectivity in the motor network after traumatic brain injury. Neurology 75:168–176. [DOI] [PMC free article] [PubMed] [Google Scholar]
- Kim DJ, Skosnik PD, Cheng H, Pruce BJ, Brumbaugh MS, Vollmer JM, Hetrick WP, O'Donnell BF, Sporns O, Puce A, Newman SD (2011): Structural network topology revealed by white matter tractography in cannabis users: A graph theoretical analysis. Brain Connect 1:473–483. [DOI] [PMC free article] [PubMed] [Google Scholar]
- Kim YH, Yoo WK, Ko MH, Park CH, Kim ST, Na DL (2009): Plasticity of the attentional network after brain injury and cognitive rehabilitation. Neurorehabil Neural Repair 23:468–477. [DOI] [PubMed] [Google Scholar]
- Kohl AD, Wylie GR, Genova HM, Hillary FG, Deluca J (2009): The neural correlates of cognitive fatigue in traumatic brain injury using functional MRI. Brain Inj 23:420–432. [DOI] [PubMed] [Google Scholar]
- Langlois J, Rutland‐Brown W, Thomas K (2004): Traumatic Brain Injury in the United States: Emergency Department Visits, Hospitalizations, and Deaths. Atlanta, GA: US Department of Health and Human Servicies, CDC. [Google Scholar]
- Leunissen I, Coxon JP, Caeyenberghs K, Michiels K, Sunaert S, Swinnen SP (2013): Task switching in traumatic brain injury relates to cortico‐subcortical integrity. Hum Brain Mapp 35:2459–2469. [DOI] [PMC free article] [PubMed] [Google Scholar]
- Lipszyc J, Levin H, Hanten G, Hunter J, Dennis M, Schachar R (2014): Frontal white matter damage impairs response inhibition in children following traumatic brain injury. Arch Clin Neuropsychol 29:289–299. [DOI] [PMC free article] [PubMed] [Google Scholar]
- Liu Y, Duan Y, He Y, Wang J, Xia M, Yu C, Dong H, Ye J, Butzkueven H, Li K, Shu N (2012): Altered topological organization of white matter structural networks in patients with neuromyelitis optica. PLoS One 7:e48846. [DOI] [PMC free article] [PubMed] [Google Scholar]
- Liu Y, Liang M, Zhou Y, He Y, Hao Y, Song M, Yu C, Liu H, Liu Z, Jiang T (2008): Disrupted small‐world networks in schizophrenia. Brain 131(Pt 4):945–961. [DOI] [PubMed] [Google Scholar]
- Lo CY, Wang PN, Chou KH, Wang J, He Y, Lin CP (2010): Diffusion tensor tractography reveals abnormal topological organization in structural cortical networks in Alzheimer's disease. J Neurosci 30:16876–16885. [DOI] [PMC free article] [PubMed] [Google Scholar]
- Lovell MR, Iverson GL, Collins MW, K Podell, KM Johnston, D Pardini, J Pardini, J Norwig, JC Maroon (2006): Measurement of symptoms following sports‐related concussion: Reliability and normative data for the post‐concussion scale. Appl Neuropsychol 13:166–174. [DOI] [PubMed] [Google Scholar]
- Max JE, Levin HS, Schachar RJ, Landis J, Saunders AE, Ewing‐Cobbs L, Chapman SB, Dennis M (2006): Predictors of personality change due to traumatic brain injury in children and adolescents six to twenty‐four months after injury. J Neuropsychiatry Clin Neurosci 18:21–32. [DOI] [PubMed] [Google Scholar]
- Messé A, Caplain S, Pélégrini‐Issac M, Blancho S, Lévy R, Aghakhani N, Montreuil M, Benali H, Lehéricy S (2013): Specific and evolving resting‐state network alterations in post‐concussion syndrome following mild traumatic brain injury. PLoS One 8:e65470. [DOI] [PMC free article] [PubMed] [Google Scholar]
- Nakamura T, Hillary FG, Biswal BB (2009): Resting network plasticity following brain injury. PLoS One 4:e8220. doi: 10.1371/journal.pone.0008220. [DOI] [PMC free article] [PubMed] [Google Scholar]
- Onoda K, Yamaguchi S (2013): Small‐worldness and modularity of the resting‐state functional brain network decrease with aging. Neurosci Lett 556:104–108. [DOI] [PubMed] [Google Scholar]
- Ottet MC, Schaer M, Debbané M, Cammoun L, Thiran JP, Eliez S (2013): Graph theory reveals dysconnected hubs in 22q11DS and altered nodal efficiency in patients with hallucinations. Front Hum Neurosci 7:402. [DOI] [PMC free article] [PubMed] [Google Scholar]
- Pandit AS, Expert P, Lambiotte R, Bonnelle V, Leech R, Turkheimer FE, Sharp DJ (2013): Traumatic brain injury impairs small‐world topology. Neurology 80:1826–1833. [DOI] [PMC free article] [PubMed] [Google Scholar]
- EM Palacios, R Sala‐Llonch, C Junque, D Fernandez‐Espejo, T Roig, JM Tormos, N Bargallo, P Vendrell (2013): Long‐term declarative memory deficits in diffuse TBI: correlations with cortical thickness, white matter integrity and hippocampal volume. Cortex 49:646–657. [DOI] [PubMed] [Google Scholar]
- Reijmer YD, Leemans A, Caeyenberghs K, Heringa SM, Koek HL, Biessels GJ (2013): Vascular Cognitive Impairment Study Group. Disruption of cerebral networks and cognitive impairment in Alzheimer disease. Neurology 80:1370–1377. [DOI] [PubMed] [Google Scholar]
- Rubinov M, Sporns O (2010): Complex network measures of brain connectivity: Uses and interpretations. Neuroimage 52:1059–1069. [DOI] [PubMed] [Google Scholar]
- Sanchez‐Carrion R, Fernandez‐Espejo D, Junque C, Falcon C, Bargallo N, Roig T, Bernabeu M, Tormos JM, Vendrell P (2008). A longitudinal fMRI study of working memory in severe TBI patients with diffuse axonal injury. Neuroimage 43:421–429. [DOI] [PubMed] [Google Scholar]
- Scheibel RS, Newsome MR, Steinberg JL, Pearson DA, Rauch RA, Mao H, Troyanskaya M, Sharma RG, Levin HS (2007): Altered brain activation during cognitive control in patients with moderate to severe traumatic brain injury. Neurorehabil Neural Repair 21:36–45. [DOI] [PubMed] [Google Scholar]
- Shi F, Yap PT, Gao W, Lin W, Gilmore JH, Shen D (2012): Altered structural connectivity in neonates at genetic risk for schizophrenia: A combined study using morphological and white matter networks. Neuroimage 62:1622–1633. [DOI] [PMC free article] [PubMed] [Google Scholar]
- Sporns O (2013): Network attributes for segregation and integration in the human brain. Curr Opin Neurobiol 23:162–171. [DOI] [PubMed] [Google Scholar]
- Tlustos SJ, Chiu CY, Walz NC, Holland SK, Bernard L, Wade SL (2011). Neural correlates of interference control in adolescents with traumatic brain injury: Functional magnetic resonance imaging study of the counting stroop task. J Int Neuropsychol Soc 17:181–189. [DOI] [PMC free article] [PubMed] [Google Scholar]
- Turner GR, Levine B (2008): Augmented neural activity during executive control processing following diffuse axonal injury. Neurology 71:812–818. [DOI] [PMC free article] [PubMed] [Google Scholar]
- Vaessen MJ, Jansen JF, Vlooswijk MC, Hofman PA, Majoie HJ, Aldenkamp AP, Backes WH (2012): White matter network abnormalities are associated with cognitive decline in chronic epilepsy. Cereb Cortex. 22:2139–2147. [DOI] [PubMed] [Google Scholar]
- van Meer MP, Otte WM, van der Marel K, Nijboer CH, Kavelaars A, van der Sprenkel JW, Viergever MA, Dijkhuizen RM (2012): Extent of bilateral neuronal network reorganization and functional recovery in relation to stroke severity. J Neurosci 32:4495–4507. [DOI] [PMC free article] [PubMed] [Google Scholar]
- Vecchio F, Miraglia F, Marra C, Quaranta D, Vita MG, Bramanti P, Rossini PM (2014): Human brain networks in cognitive decline: A graph theoretical analysis of cortical connectivity from EEG data. J Alzheimers Dis 41:113–127. [DOI] [PubMed] [Google Scholar]
- van den Heuvel MP, Sporns O, Collin G, Scheewe T, Mandl RCW, Cahn W, Goni J, Hulshoff Pol HE, Kahn RS (2013): Abnormal rich club organization and functional brain dynamics in schizophrenia. JAMA Psychiatry 70:783–792. [DOI] [PubMed] [Google Scholar]
- Wang, R (2007): Diffusion Toolkit: A Software Package for Diffusion Imaging Data Processing and Tractography. Proceedings International Society for Magnetic Resonance in Medicine (ISMRM), Berlin, Germany, vol.15, pp. 3720. [Google Scholar]
- DJ Watts, SH Strogatz (1998): Collective dynamics of ‘small‐world’ networks. Nature 393:440–442. [DOI] [PubMed] [Google Scholar]
- Wilde EA, Merkley TL, Bigler ED, Max JE, Schmidt AT, Ayoub KW, McCauley SR, Hunter JV, Hanten G, Li X, Chu ZD, Levin HS (2012): Longitudinal changes in cortical thickness in children after traumatic brain injury and their relation to behavioral regulation and emotional control. Int J Dev Neurosci 30:267–276. [DOI] [PMC free article] [PubMed] [Google Scholar]
- Wilde EA, Newsome MR, Bigler ED, Pertab J, Merkley TL, Hanten G, Scheibel RS, Li X, Chu Z, Yallampalli R, Hunter JV, Levin HS (2011). Brain imaging correlates of verbal working memory in children following traumatic brain injury. Int J Psychophysiol 82:86–96. [DOI] [PMC free article] [PubMed] [Google Scholar]
- Yan C, Gong G, Wang J, Wang D, Liu D, Zhu C, Chen ZJ, Evans A, Zang Y, He Y. (2011). Sex‐ and brain size‐related small‐world structural cortical networks in young adults: A DTI tractography study. Cereb Cortex 21:449–458. [DOI] [PubMed] [Google Scholar]
- Yuan W, Holland SK, Schmithorst VJ, Walz NC, Cecil KM, Jones BV, Karunanayaka P, Michaud L, Wade SL (2007). Diffusion tensor MR imaging reveals persistent white matter alteration after traumatic brain injury experienced during early childhood. AJNR Am J Neuroradiol 28:1919–1925. [DOI] [PMC free article] [PubMed] [Google Scholar]
- Zalesky A, Fornito A, Seal ML, Cocchi L, Westin CF, Bullmore ET, Egan GF, Pantelis C (2011): Disrupted axonal fiber connectivity in schizophrenia. Biol Psychiatry 69:80–89. [DOI] [PMC free article] [PubMed] [Google Scholar]
- Zhang Z, Liao W, Chen H, Mantini D, Ding J, Xu Q, Wang Z, Yuan C, Chen G, Jiao Q, Lu G (2011). Altered functional‐structural coupling of large‐scale brain networks in idiopathic generalized epilepsy. Brain 134:2912–28. [DOI] [PubMed] [Google Scholar]
- Zuo N, Cheng J, Jiang T (2012): Diffusion magnetic resonance imaging for Brainnetome: A critical review. Neurosci Bull 28:375–388. Review. [DOI] [PMC free article] [PubMed] [Google Scholar]