

Abstract
Background
The Malnutrition-Inflammation Score (MIS), a non-expensive and easy-to-assess score between 0 and 30 to examine protein-energy wasting (PEW) and inflammation, includes 7 components of the subjective global assessment, body mass index, and serum albumin and transferrin concentrations. We hypothesized that the MIS risk-stratification of chronic hemodialysis (HD) patients in predicting outcomes is better than its components or laboratory markers of inflammation.
Study Design
5-year cohort study.
Setting & Participants
We examined 809 stable HD outpatients and followed them for up to 5 years (10/2001–12/2006).
Predictors
MIS and other nutritional and inflammatory markers.
Outcomes & Measurements
Prospective all-cause mortality, health-related quality of life via SF-36, and tests of body composition.
Results
The MIS was correlated with serum interleukin-6 (IL-6) (r=+0.26, p<0.001), C-reactive protein (CRP) (r=+0.16, p<0.001) and several measures of nutritional status. Patients with higher MIS had lower SF-36 scores. After multivariate adjustment for case-mix and other measures of PEW, the chronic HD patients in the second (3–4), third (5–7) and fourth (≥8) quartiles of MIS had worse survival rates than those in the first (0–2) quartile (p<0.001). Each 2 unit increase in MIS was associated with two-fold higher death risk, i.e., adjusted death hazard ratio of 2.03 (95% CI: 1.76–2.33, p<0.001). Cubic spline survival models confirmed linear trends. The areas under the receiver operating characteristic curves for the continuum of MIS in predicting 5-year mortality (0.67) was equal to IL-6 (0.67) and somewhat better than CRP (0.63).
Limitations
Selection bias and unknown confounders.
Conclusions
In chronic HD patients, the MIS is associated with inflammation, nutritional status, quality of life, and 5-year prospective mortality. The mortality-predictability of the MIS appears equal to serum IL-6 and somewhat greater than CRP. Controlled trials are warranted to examine whether interventions to improve MIS can also improve clinical outcomes in chronic HD patients.
Keywords: Malnutrition-inflammation score (MIS), chronic kidney disease (CKD), hemodialysis, malnutrition, inflammation, cardiovascular disease, protein-energy wasting (PEW), health-related quality of life
Introduction
Many individuals with chronic kidney disease (CKD) stage 5, who undergo chronic hemodialysis (HD), suffer from protein-energy wasting (PEW), also known as uremic malnutrition.1–3 The International Society of Renal Nutrition and Metabolism (ISRNM) Expert Panel recently proposed a set of criteria for the detection of PEW.2 In addition to the four sets of traditional criteria for diagnosis of PEW, i.e. biochemical tests, low body weight, reduced total body fat or muscle fat or weight loss, and low protein or energy intakes, the ISRNM also suggested use of scoring systems such as the semi-quantitative “Subjective Global Assessment of Nutrition” (SGA) or its fully quantitative and CKD-tailored refinements such as the “Malnutrition-Inflammation Score” (MIS).2
Originally introduced in 2001 in American Journal of Kidney Disease,4 the MIS is one of the CKD specific nutritional scoring systems that has received a considerable attention in research and clinical practice in the past years and is currently used for annual nutritional assessment of over 100,000 dialysis patients in DaVita dialysis clinics across the United States. The MIS incorporates seven components of the original SGA plus the body mass index (BMI), serum albumin and total iron-binding capacity (TIBC) or transferrin (Table 1).4 In dialysis patients, MIS has been shown to be associated to coronary artery disease,5 hospitalization and mortality,4, 6 health related quality of life (QoL),7 sleep and depressive disorders,7, 8 exercise capacity and oxygen uptake,9 and erythropoietin hyporesponsiveness.10, 11 The efficacy of the MIS has also been examined in peritoneal dialysis patients12–14 as well as in different populations6, 12, 14, 15 and different age groups.16 Indeed, a recent study used the MIS as the gold standard for examining other simpler scoring systems.15, 17
Table 1.
Components of the “Malnutrition-Inflammation Score” (MIS)
| MIS Components | Score | |||
|---|---|---|---|---|
| 0 | 1 | 2 | 3 | |
| (A) Medical history: | ||||
| 1. Change in end dialysis dry weight (overall change in the past 3–6 months) | <0.5 Kg | 0.5–1.0 Kg | ≥1 Kg but <5% | ≥ 5% |
| 2. Dietary intake | Good appetite, no deterioration of dietary intake | Sub-optimal solid dietary intake | Moderate overall decrease to full liquid diet | Hypo-caloric liquid to starvation |
| 3. Gastrointestinal symptoms | No symptoms with good appetite | Mild symptoms, poor appetite or nauseated occasionally | Occasional vomiting or moderate GI symptoms | Frequent diarrhea or vomiting or sever anorexia |
| 4. Functional capacity (nutritionally related functional impairment) | Normal to improved functional capacity, feeling fine | Occasional difficulty with baseline ambulation, or feeling tired frequently | Difficulty with otherwise independent activities (e.g. going bathroom) | Bed/chair ridden, or little to no physical activity |
| 5. Co-morbidity * | No comorbidity | Mild comorbidity (excluding MCC**) | Moderate comorbidity (including one MCC*) | Any sever multiple comorbidity (≥2 MCC*) |
| (B) Physical exam: | ||||
| 6. Decreased fat stores or loss of subcutaneous fat (below eyes, triceps, biceps, triceps, chest) | No change | mild | moderate | sever |
| 7. Signs of muscle wasting (temple, clavicle, scapula, ribs, quadriceps, knee, interosseous) | No change | mild | moderate | sever |
| (C) Body size | ||||
| 8. Body mass index (kg/m2) | ≥ 20 | 18–19.9 | 16–17.99 | <16 |
| (D) Laboratory parameters | ||||
| 9. Serum albumin (g/L) | ≥4 | 3.5–3.9 | 3.–3.4 | <3.0 |
| 10. Serum total iron binding capacity (mg/dL) | ≥ 250 | 200–249 | 150–199 | <150 |
| Total MIS = sum of the above 10 components, ranging from 0 (no malnutrition) to 30 (severely malnourished) | ||||
In the original MIS dialysis treatment age (vintage) contributes to the comorbid condition scoring: 0 if vintage <1 year, 1 if vintage 1 to 4 years, and at least 2 if vintage >4 years.
Major co-morbid conditions (MCC) include CHF class III or IV, full blown AIDS, severe coronary artery disease, moderate to severe chronic obstructive pulmonary disease, major neurological sequelae, metastatic malignancy or recent chemotherapy
Many of the foregoing studies, however, have significant limitations, including small sample sizes, mostly <100 subjects, and short follow-up period. Indeed, the mortality predictability of the MIS was originally examined in only 83 chronic HD patients over a 12-month period,4 and the association between the MIS and QoL was examined in only 76 Turkish HD patients.7 It is not known whether MIS has superior mortality predictability compared to its 10 components or other markers of nutrition or inflammation. The inflammatory representativeness of the MIS has not yet been well studied. Recent evidence suggests that elevated circulatory levels of interleukin-6 (IL-6) and C-reactive protein (CRP) are strong correlates of mortality in HD patients.18–21 The prognostic value of these elaborate laboratory markers of inflammation has not yet been compared to the MIS in larger and longer cohorts. Hence, to examine the hypothesis that the MIS risk-stratification of chronic HD patients is useful in predicting outcomes and greater than its component alone or in diverse combinations, we first examined the association between the MIS and the health related QoL and mortality in 809 HD patients. Then, we studied the commensurate mortality-predictability of the MIS as compared to explicit laboratory markers of inflammation and proinflammatory cytokines.
Methods
Patient Population
We studied HD patients who participated in the Nutritional and Inflammatory Evaluation in Dialysis (NIED) Study.22 The original patient cohort was derived from a pool of over 3,000 HD outpatients over 5 years in eight DaVita chronic dialysis facilities in the South Bay Los Angeles area (see the NIED Study website at www.NIEDStudy.org for more details, as well as previous publications23–25). Inclusion criteria were outpatients who had been undergoing HD treatment for at least 8 weeks, who were 18 years or older and who signed the Institutional Review Board approved consent form. Patients with acute infections or an anticipated life expectancy of less than 6 months (e.g. due to a metastatic malignancy or advanced HIV/AIDS disease) were excluded. From October 1, 2001, through December 31, 2006, 893 HD patients signed the informed consent form and underwent the periodic evaluations of the NIED Study. For this study, data including MIS were available in 809 HD patients.
The medical chart of each HD patient was thoroughly reviewed by a collaborating physician, and data pertaining to the underlying kidney disease, cardiovascular history and other comorbid conditions were extracted. A modified version of the Charlson comorbidity index, i.e., without the age and kidney disease components, was used to assess the severity of comorbidities.26, 27 The 809 HD patients were followed for up to 63 months, i.e., until December 31, 2006.
The Malnutrition-Inflammation Score
The MIS has four sections (nutritional history, physical examination, BMI, and laboratory values) and 10 components.4 Each component has four levels of severity, from 0 (normal) to 3 (severely abnormal). The sum of all 10 MIS components can range from 0 (normal) to 30 (severely malnourished); a higher score reflects a more severe degree of malnutrition and inflammation (Table 1).
The five nutritional history based components include weight change, dietary intake, gastrointestinal symptoms, functional capacity, and comorbid conditions. In the current study, dialysis vintage was not included in the comorbidity component. The two physical examination components consist of the assessment of the subcutaneous body fat and signs of muscle wasting. In addition to the foregoing seven SGA-based components, the three MIS-unique sections include the BMI (>20, 18 to 19.99, 16 to 17.99, and <16 kg/m2), serum albumin (≥4.0, 3.5–3.9, 3.0–3.4 and <3.0 g/dL) and serum TIBC (≥250, 200–249, 150–200, and <150 mg/dL), the four increments of which are also scored from 0 through 3, respectively.4
Anthropometric Measures
Body weight assessment and anthropometric measurements were performed while patients underwent a hemodialysis treatment or within 5 to 20 minutes after termination of the treatment. Biceps skinfold (BSF) and triceps skinfold (TSF) thicknesses were measured with a conventional skinfold caliper using standard techniques as previously described.28, 29
Near Infra-Red Interactance
To estimate the percentage of body fat and fat-free body mass, near infra-red (NIR) interactance was measured at the same time as the anthropometric measurements.30 A commercial near-infrared interactance sensor with a coefficient of variation of 0.5% for total body fat measurement (portable Futrex 6100®, Gaithersburg, Maryland, www.futrex.com) was used. NIR measurements were performed by placing, for several seconds on the upper aspect of the arm without a vascular access, a Futrex® sensor, and entering the required data (date of birth, gender, weight and height) of each patient. NIR measurements of body fat appear to correlate significantly with other nutritional measures in HD patients.25
Laboratory Tests
Pre-dialysis blood samples and post-dialysis serum urea nitrogen were obtained on a mid-week day which coincided chronologically with the drawing of quarterly blood tests in the DaVita facilities. The single-pool Kt/V was used to represent the weekly dialysis dose. All routine laboratory measurements were performed by DaVita® Laboratories (Deland, FL) using automated methods.
Serum high sensitivity CRP was measured by a turbidometric immunoassay (manufacturer: WPCI, Osaka, Japan, unit: mg/L, normal range: <3.0 mg/L).31, 32 IL-6 and tumor necrosis factor alpha (TNF-α) were measured with immunoassay kits based on a solid phase sandwich ELISA using recombinant human IL-6 and TNF-α (manufacturer: R&D Systems, Minneapolis, MN; units: pg/ml; normal range: IL-6: <9.9 pg/ml, TNF-α: <4.7 pg/ml).21, 33 CRP, TNF-alpha, and IL-6 were measured in the General Clinical Research Center (GCRC) Laboratories of Harbor-UCLA. Serum transthyretin (prealbumin) was measured using immunoprecipitin analysis. Plasma total homocysteine concentrations were determined by high-performance liquid chromatography in the Harbor-UCLA Clinical Laboratories.
Statistical Methods
Pearson´s correlation coefficient (r) was used for analyses of linear associations. Multivariate regression analyses and analyses of covariance were performed to obtain adjusted p-values controlled for case-mix and other covariates. Restricted cubic splines graphs were utilized as exploratory data analysis (EDA) strategies to illustrate systematic relations between serum MIS and mortality. This method also served to examine the non-linear associations as continuous mortality predictors as an alternative to inappropriate linearity assumptions.34 Thereafter, to calculate the relative risks of death, hazard ratios (HR) were obtained using Cox proportional hazard models after controlling for the relevant covariates. Plots of log [-log (survival rate)] against log (survival time) were performed to establish the validity of the proportionality assumption. Kaplan-Meier analyses were utilized to assess the differences in surviving proportions between quartiles of MIS.
To compare the prognostic ability of the full version of the MIS to each of its 10 components, any combination of them or other nutritional or inflammatory markers in predicting mortality, receiver operating characteristic (ROC) curves were constructed in which death was the reference variable and the death hazard function of the full MIS version, each of the 10 MIS components alone or in combination, or selected inflammatory or nutritional markers were the predicting variables. The differences of the areas under ROC curves were examined and compared to the full MIS version (with 10 components) using the roccomp command in Stata. Sensitivity (y-axis) was plotted vs. one minus specificity (x-axis) for each possible cutoff value of hazard function of each component or combination of components and death as dependent (reference) variable.35 The area under the curve represents the discriminative power of the test. Values are expected to be between 0.5 (indicating no discriminative ability) and 1.0 (indicating highest detection accuracy).
Case-mix and comorbidity covariates included gender, age, race and ethnicity (Hispanics, African Americans, Asians and others), diabetes mellitus, dialysis vintage, primary insurance, marital status, dialysis dose (Kt/V), and kidney residual urine (KRU); and laboratory measures of the MICS (excluding serum albumin, total iron binding capacity, and body mass index) in fully adjusted Cox models included serum CRP, TNF-α, and IL-6. Fiducial limits are given as mean±SD (standard deviation) or median and inter-quartile range; risk ratios include 95% confidence interval (CI) levels. A p-value <0.05 or a 95% CI that did not span 1.0 was considered to be statistically significant. Descriptive and multivariate statistics were carried out with the statistical software “Stata version 10.0” (Stata Corporation, College Station, Texas).
Results
General and laboratory characteristics
Mean age (±SD) of patients was 53.6±14.9 years; 47% of patients were women, 52% Hispanic, 30% African-American and 54% diabetic. The mean dialysis vintage was 30±33 months (median: 19, inter-quartile range: 7–42 months). The average baseline MIS in the 809 HD patients was 5.1±3.6 ng/mL (median: 4, minimum: 0, maximum: 23, inter-quartile range: 2–7 ng/mL) (Figure 1). Table 2 shows the values of relevant demographic and clinical variables according to the quartiles of the MIS. The proportions of women, unmarried or diabetics were higher in the 4th quartile of the MIS (i.e., MIS ≥8). Moreover, in addition to BMI and mid-arm muscle circumference, biceps (but not triceps) skinfold also showed decreasing trend across increasing MIS quartiles. Among laboratory measures, in addition to serum albumin and TIBC, the levels of serum transthyretin, calcium, iron, and blood hemoglobin decreased across increasing MIS categories, whereas serum CRP, IL-6, WBC and ferritin showed the opposite trend.
Figure 1.
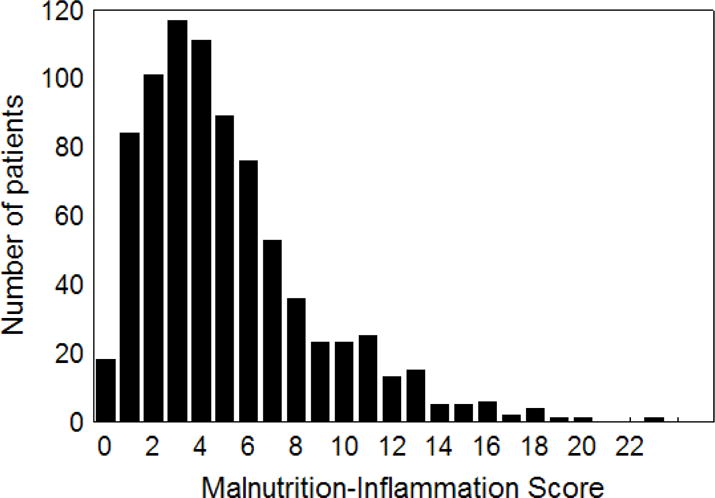
Distribution of the baseline malnutrition-inflammation score in 809 maintenance hemodialysis patients
Table 2.
Baseline demographic, clinical, and laboratory values in total and according to the quartiles of malnutrition-inflammation score in 809 maintenance hemodialysis patients1
| Variable | Malnutrition-Inflammation Score
|
P for trend | |||
|---|---|---|---|---|---|
| Quartile 1 0, 1 & 2 (n= 203) |
Quartile 2 3 & 4 (n= 227) |
Quartile 3 5, 6, & 7 (n= 219) |
Quartile 4 ≥8 (n= 160) |
||
| Demographic | |||||
| Age (years) | 48.5±13.6 | 53.7±15.4 | 54.6±14.5 | 58.8±14.1 | <0.001 |
| Women (%) | 38 | 49 | 50 | 53 | 0.005 |
| Marital status: % married | 56 | 45 | 44 | 45 | 0.07 |
| Race: % African-American | 23 | 34 | 34 | 29 | 0.2 |
| Ethnicity: % Hispanic | 39 | 54 | 50 | 49 | 0.08 |
| Primary insurance: % Medicare | 44 | 54 | 59 | 50 | 0.2 |
| Diabetes mellitus (%) | 46 | 53 | 62 | 66 | <0.001 |
| Modified Charlson comorbidity score | 1.2±1.2 | 1.7±1.5 | 2.2±1.6 | 2.6±1.8 | <0.001 |
| Mortality in 5-year (%) | 14 | 24 | 31 | 51 | <0.001 |
| Body composition | |||||
| Body mass index (kg/m2) | 27.1±5.6 | 26.8±5.8 | 27.2±6.6 | 24.1±6.0 | <0.001 |
| Triceps skinfold (mm) | 17.2±9.9 | 18.1±9.0 | 19.0±11.0 | 15.4±8.9 | 0.4 |
| Biceps skinfold (mm) | 10.4±9.2 | 10.1±6.7 | 10.5±8.2 | 8.1±6.1 | 0.03 |
| Mid-arm muscle circumference (cm) | 26.6±4.2 | 26.1±4.5 | 25.8±4.1 | 24.3±4.5 | <0.001 |
| Near infrared measured body fat (%) | 25.8±10.5 | 25.3 ±10.6 | 27.7 ± 11.0 | 24.9 ± 10.8 | 0.7 |
| Hemodialysis treatment measures | |||||
| Dialysis vintage <6 months (%) | 20 | 23 | 19 | 27 | 0.3 |
| Dialysis vintage (months) | 31.0±33.4 | 32.1±36.9 | 25.6±25.7 | 31.5±35.6 | 0.6 |
| Dialysis dose (Kt/V single pool) | 1.64±0.33 | 1.63±0.29 | 1.58±0.28 | 1.60±0.32 | 0.09 |
| nPNA (nPCR) (g.kg−1.day−1) | 1.11±0.24 | 1.07±0.22 | 1.06±0.22 | 1.03±0.27 | 0.002 |
| Erythropoietin dose (1,000 u/week) | 13.4±12.0 | 12.2±8.7 | 15.3±12.0 | 18.7±16.9 | <0.001 |
| Active vitamin D dose (mcg/month) | 43.3±39.1 | 52.2±44.1 | 41.7±3.5 | 39.6±37.6 | 0.60 |
| Biochemical measurements | |||||
| Serum albumin (g/dl) | 4.12±0.29 | 3.93±0.29 | 3.86±0.33 | 3.56±0.43 | <0.001 |
| prealbumin (transthyretin) (mg/dl) | 31.2±10.3 | 28.9±8.9 | 29.1±8.8 | 23.3±8.5 | <0.001 |
| creatinine (mg/dl) | 10.7±3.3 | 10.7±3.3 | 10.2±3.0 | 8.8±2.9 | <0.001 |
| total iron binding capacity (mg/dl) | 235±33 | 207±37 | 197±31 | 187±40 | <0.001 |
| calcium (mg/dl) | 9.4±0.7 | 9.4±0.7 | 9.3±0.6 | 9.3±0.7 | 0.005 |
| iron (mg/dl) | 73±24 | 68±26 | 63±23 | 59±31 | <0.001 |
| iron saturation ratio | 31.7±10.1 | 32.8±10.9 | 31.8±10.6 | 31.0±12.1 | 0.4 |
| phosphorus (mg/dl) | 5.9±1.4 | 5.6±1.3 | 5.9±1.5 | 5.7±1.7 | 0.5 |
| ferritin (ng/ml) | 438±394 | 556±402 | 639±454 | 655±484 | <0.001 |
| bicarbonate (mg/dl) | 21.6±3.0 | 22.5±2.7 | 22.2±2.6 | 22.7±3.0 | 0.003 |
| total homocysteine (μmol/l) | 23.4±10.1 | 23.9±9.1 | 25.1±13.5 | 21.2±9.5 | 0.3 |
| C-reactive protein (mg/l) | 4.6±5.6 | 4.7±4.8 | 6.7±7.7 | 7.4±9.2 | <0.001 |
| IL-6 (pg/ml) | 10.0±20.7 | 11.7±19.7 | 19.5±61.3 | 31.6±80.5 | <0.001 |
| TNF-α (pg/ml) | 8.7±13.5 | 8.9±11.7 | 7.9±7.9 | 8.3±10.1 | 0.5 |
| Blood hemoglobin (g/dl) | 12.3±0.8 | 12.2±0.9 | 12.1±0.9 | 11.7±1.3 | <0.001 |
| WBC (×1000 cell/μl) | 7.1±2.0 | 7.1±1.9 | 7.3±1.9 | 7.4±2.4 | 0.09 |
| lymphocyte (% of total WBC) | 25.0±7.6 | 23.1±8.2 | 21.4±7.0 | 20.7±8.1 | <0.001 |
Kt/V, dialysis dose; nPCR, normalized protein catabolic rate; IL-6, Interleukin 6; TNF-α, Tumor necrosis factor α
All values are presented as mean ± SD or percentages
P-values for dialysis dose (vintage), ferritin, vitamin D dose, CRP, IL-6, and TNF- α are based on the logarithmic values of these measures.
Health Related Quality of Life
Table 3 shows the average crude scores of SF-36 in 688 HD patients who answered this quality of life questionnaire. Poorer self-reported quality of life was noted with higher MIS values. This trend was prominent in all scales and dimensions of quality of life. Figure 2 illustrates the same trends for the standardized scores of SF-36.
Table 3.
Means of baseline SF-361 quality of life scores and malnutrition-inflammation score in 6882 maintenance hemodialysis patients
| Variable | Malnutrition-inflammation score
|
|||||
|---|---|---|---|---|---|---|
| Total (n=688) | Quartile 1 0, 1 & 2 (n= 172) |
Quartile 2 3 & 4 (n= 196) |
Quartile 3 5, 6, & 7 (n= 193) |
Quartile 4 ≥8 (n= 127) |
P for trend | |
| SF-36 Overall | ||||||
| SF-36 total score | 59±21 | 55±21 | 52±22 | 49±21 | 43±20 | <0.001 |
| SF-36 dimensions | ||||||
| SF-36 mental health | 53±21 | 56±20 | 54±21 | 53±20 | 47±20 | <0.001 |
| SF-36 physical health | 46±22 | 51±22 | 48±23 | 44±21 | 38±19 | <0.001 |
| SF-36 scales | ||||||
| Body pain | 58±29 | 63±29 | 61±29 | 57±28 | 49±28 | <0.001 |
| General health | 45±22 | 48±22 | 46±23 | 43±20 | 40±21 | 0.001 |
| Mental health | 66±20 | 67±20 | 67±20 | 66±20 | 64±22 | <0.001 |
| Physical function | 46±30 | 55±28 | 49±30 | 44±29 | 32±26 | <0.001 |
| Role emotional | 47±43 | 50±42 | 51±43 | 46±44 | 39±43 | 0.014 |
| Role physical | 35±41 | 39±42 | 40±43 | 31±40 | 28±39 | 0.006 |
| Functionality | 62±28 | 66±26 | 61±29 | 62±27 | 55±29 | 0.004 |
| Vitality | 49±22 | 54±22 | 49±22 | 48±22 | 42±22 | <0.001 |
SF-36, short form quality of life score with 36 questions
Of all the 809 patients under study, data of quality of life were available for 688 patients
Figure 2. Standardized SF-36 quality of life scores in the quartiles of malnutrition-inflammation score in 688 maintenance hemodialysis patients.
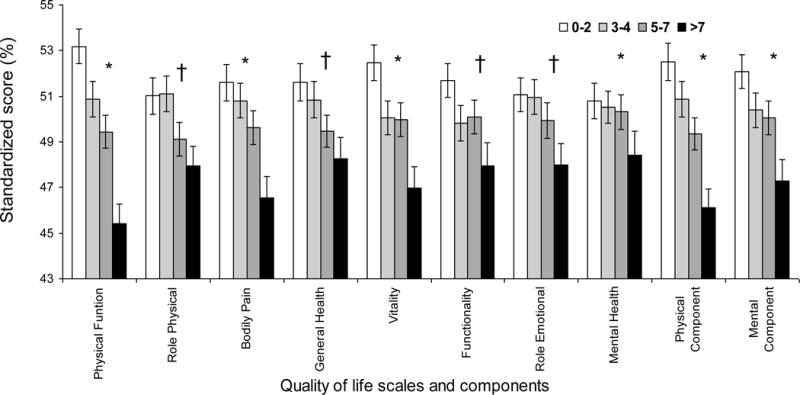
* P<0.001; † 0.001≤P<0.05
Linear Associations
The MIS was negatively correlated with the nPNA (nPCR) (r=−0.13, p<0.001), a surrogate of dietary protein intake, as well as with serum prealbumin (transthyretin) (r=−0.29, p<0.001) and serum iron level (r=−0.21, p<0.001). The MIS was also positively correlated with monthly erythropoietin dose (r=+0.13, p<0.001) and logarithms of CRP (r=+0.16, p<0.001) and IL-6 (r=+0.26, p<0.001). The MIS also had negative correlations with mid-arm muscle circumference (r=−0.19, p<0.001) and lean body mass (r=−0.16, p<0.001).
MIS and Survival
Over the 5 year follow-up, 232 (29%) patients died, 92 (11%) underwent transplantation, and 147 (18%) left the cohort. Figure 3 shows the cubic splines illustrating the associations between baseline MIS and mortality in the 5-year cohort of 809 HD patients. A consistent trend towards increased death risk was observed in the patients with higher MIS even after multivariate adjustment for other makers of nutrition and inflammation including CRP, IL-6 and TNF-α. Figure 4 shows the hazard ratios (HR) of mortality for the quartiles of MIS. Patients in the 4th quartile of the MIS had a significantly higher HR of death after multivariate adjustments. As shown in Figure 5, the Kaplan-Meier survival plots show incrementally worsening survival across increasing MIS quartiles. The hazard ratios listed in Table 4 indicate that HD patients in first quartiles had a lesser death risk vs. those in the 4th quartile and that this trend was robust to multivariate adjustment for other measures of MICS including several inflammatory markers and cytokines. Sensitivity analyses to examine diverse calibrations such as MIS quintiles yielded similar results (data not shown). Since spline models (Figure 3) showed somewhat linear associations. We also examined the linear Cox survival regression, which showed that the fully adjusted death hazard ratio for each 2 unit increase in MIS was 2.03 (95% CI: 1.76–2.33, p<0.001).
Figure 3. Mortality predictability of malnutrition-inflammation score in 809 maintenance hemodialysis patients (Oct 2001 – Jan 2007).
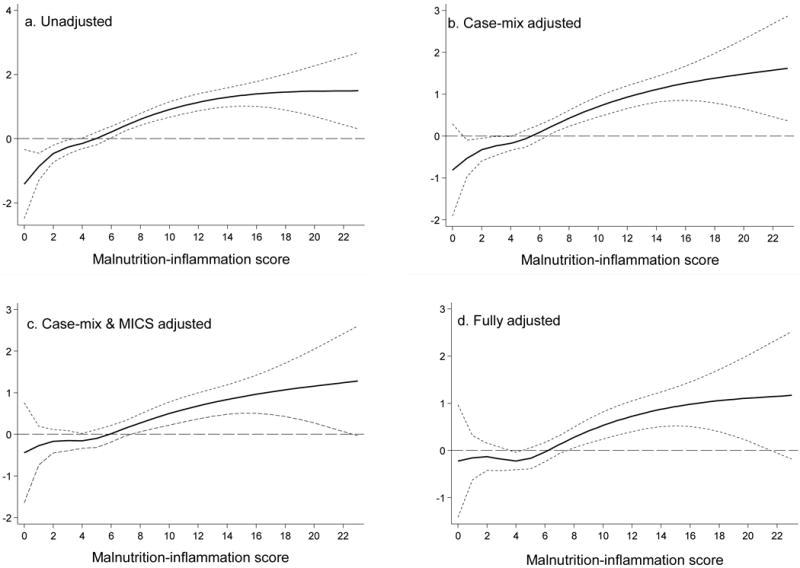
Panel A. Unadjusted
Panel B. adjusted for Case-mix variables
Panel C. adjusted for Case-mix and MICS variables
Panel D. adjusted for case-mix, MICS, and inflammation
Case-mix variables: age, gender, race/ethnicity, diabetes mellitus, log vintage, primary insurance, marital status, dialysis dose (Kt/V), and kidney residual urine (KRU)
MICS variables: erythropoietin dose, creatinine, hemoglobin, phosphorus, normalized protein catabolic rate (nPCR), bicarbonate, calcium, ferritin, WBC, lymphocyte percentage, and vitamin D dose
Inflammatory variables: C-reactive protein, Interleukin-6, Tumor necrosis factor-α
Figure 4. Mortality predictability of quartiles of baseline malnutrition-inflammation score (MIS) in 809 maintenance hemodialysis patients (Oct 2001 – Jan 2007).
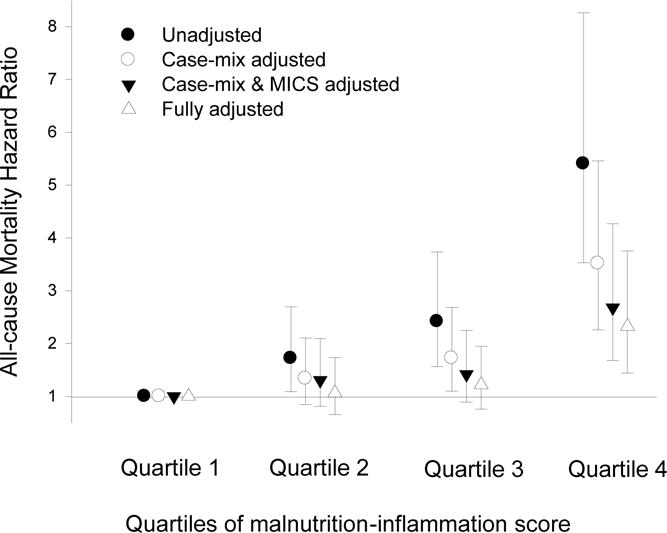
Case-mix variables: age, gender, race/ethnicity, diabetes mellitus, log vintage, primary insurance, marital status, dialysis dose (Kt/V), and kidney residual urine (KRU)
MICS variables: erythropoietin dose, creatinine, hemoglobin, phosphorus, normalized protein catabolic rate (nPCR), bicarbonate, calcium, ferritin, WBC, lymphocyte percentage, and vitamin D dose
Inflammatory variables: Log C-reactive protein, Log Interleukin-6, Log Tumor necrosis factor-α
Quartile 1: 0 to 2; Quartile 2: 3 & 4; Quartile 3: 5 to 7; Quartile 4: ≥8
Figure 5.
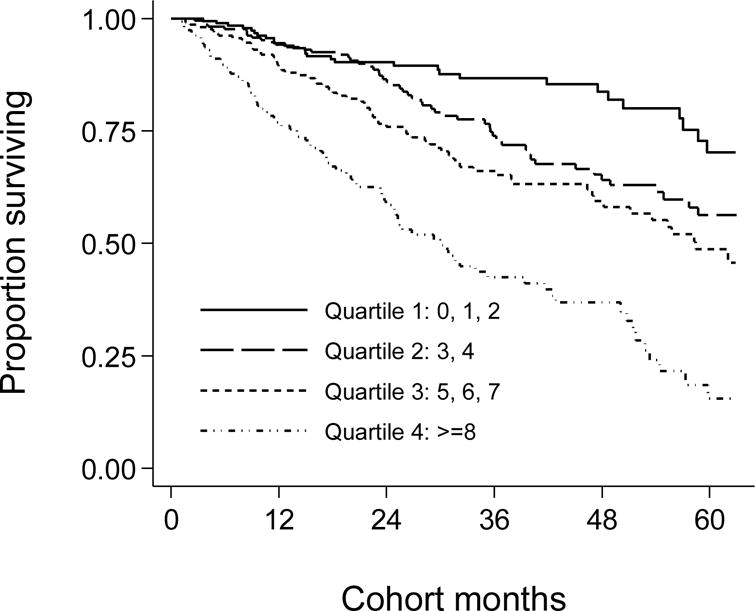
Kaplan-Meier proportion of surviving after 5 years of observation according to the quartiles of baseline malnutrition-inflammation score (MIS) in 809 HD patients (Oct 2001 – Jan 2007)
Table 4.
Hazard ratios (HRs) of 5-year mortality according to the quartiles of malnutrition-inflammation score (MIS) in 809 maintenance hemodialysis patients (Oct. 2001 to Jan 2007)
| Unadjusted | Case-mix1 adjusted | Case-mix + MICS2 adjusted | Case-mix + MICS + inflammation adjusted (Full model) 3 | |||||
|---|---|---|---|---|---|---|---|---|
|
| ||||||||
| MIS Quartiles | HR (95% CI) | P | HR (95% CI) | P | HR (95% CI) | P | HR (95% CI) | P |
| Quartile 1: 0, 1 & 2 (n=172) | 0.19 (0.12–0.28) | <0.001 | 0.28 (0.18–0.44) | <0.001 | 0.37 (0.23–0.59) | <0.001 | 0.43 (0.27–0.70) | 0.001 |
| Quartile 2: 3 & 4 (n=196) | 0.32 (0.23–0.45) | <0.001 | 0.38 (0.27–0.54) | <0.001 | 0.49 (0.33–0.71) | <0.001 | 0.46 (0.31–0.68) | <0.001 |
| Quartile 3: 5, 6, & 7 (n=193) | 0.45 (0.32–0.62) | <0.001 | 0.49 (0.35–0.68) | <0.001 | 0.53 (0.38–0.74) | <0.001 | 0.52 (0.37–0.75) | <0.001 |
| Quartile 4: ≥8 (n=127) | 1.0 (Reference) | 1.0 (Reference) | 1.00 (Reference) | 1.00 (Reference) | ||||
Case-mix variables include age, gender, race/ethnicity, diabetes, Log vintage, insurance (medicare), marital status, dialysis dose (Log Kt/V), and kidney residual urine (KRU)
MICS variables include Log erythropoietin dose, creatinine, hemoglobin, phosphorus, normalized protein catabolic rate (nPCR), bicarbonate, calcium, Log ferritin, white blood count (WBC), lymphocyte percent, Log vitamin D dose
Full model consist of case-mix and MICS variables, and three inflammatory markers: C-reactive protein, Interleukin-6, Tumor necrosis factor-α
Comparing the MIS to other Mortality Predictors
We examined the prognostic value of different versions and components of the MIS in predicting the 5-year mortality by analyzing the area under the ROC curves (AUC). We compared the full version of the MIS with each of its 10 components, a combination of the first 6 components (after excluding comorbidity, BMI, albumin and TIBC, to imitate the original SGA), inflammatory markers and prealbumin (transthyretin). As shown in Table 5, the AUC for the full version of the MIS was higher than each of the 10 MIS components including the commensurate serum albumin. The AUC for the MIS in predicting death was significantly higher than the combination of the first 6 components (p<0.001) and serum prealbumin (p=0.009) somewhat higher than CRP (p=0.15) and essentially equal to serum IL-6 (p=0.9). Figure 6 illustrates the AUC comparison among MIS, CRP and IL-6. Sensitivity analyses showed that adding MIS to age or other case-mix variables inmproved the mortality predictability of them (data not shown).
Table 5.
Comparing the area under receiver operating characteristics (ROC) curve (AUC) of the full malnutrition-inflammation score (MIS) version with the 10 components of the MIS, and the SGA (6-component) combination, inflammatory markers and prealbumin in predicting 5-year death risk in 809 HD patients.
| Variable | AUC | 95% confidence interval | P value1 |
|---|---|---|---|
| MIS Components | |||
| 1. Changes in dry weight | 0.57 | 0.54 – 0.61 | <0.001 |
| 2. Dietary intake | 0.55 | 0.52 – 0.58 | <0.001 |
| 3. Gastrointestinal symptoms | 0.56 | 0.53 – 0.60 | <0.001 |
| 4. Functional capacity | 0.63 | 0.59 – 0.66 | 0.01 |
| 5. Decreased fat storage | 0.56 | 0.53 – 0.59 | <0.001 |
| 6. Muscle wasting | 0.58 | 0.54 – 0.61 | <0.001 |
| 7. Co-morbidity | 0.62 | 0.58 – 0.66 | 0.02 |
| 8. Body mass index | 0.53 | 0.50 – 0.57 | <0.001 |
| 9. Serum albumin | 0.62 | 0.58 – 0.65 | 0.004 |
| 10. Total iron binding capacity | 0.57 | 0.53 – 0.61 | <0.001 |
| MIS with 6 components (SGA) 2 | 0.63 | 0.58 – 0.67 | <0.001 |
| MIS with 10 components | 0.67 | 0.63 – 0.71 | reference |
| Log interleukin-6 | 0.67 | 0.63 – 0.71 | 0.9 |
| Log C-reactive protein | 0.63 | 0.59 – 0.67 | 0.1 |
| Log Tumor necrosis factor-alpha | 0.53 | 0.48 – 0.57 | <0.001 |
| Serum prealbumin | 0.59 | 0.55 – 0.62 | 0.009 |
p value of comparison of AUC of each variable with MIS (containing 10 components)
Comorbidity, body mass index, serum albumin, and total iron binding capacity are excluded to imitate the Subjective Global Assesment (SGA)
Figure 6. Receiver operating characteristic (ROC) curves of probabilities obtained from hazard regression models including (right) C-reactive protein (CRP), (middle) Interleukin-6 (IL-6), and (left) malnutrition-inflammation score (MIS) as independent variables and all-cause mortality as dependent (reference) variable.
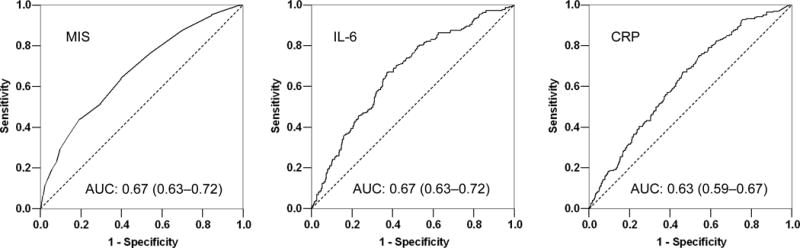
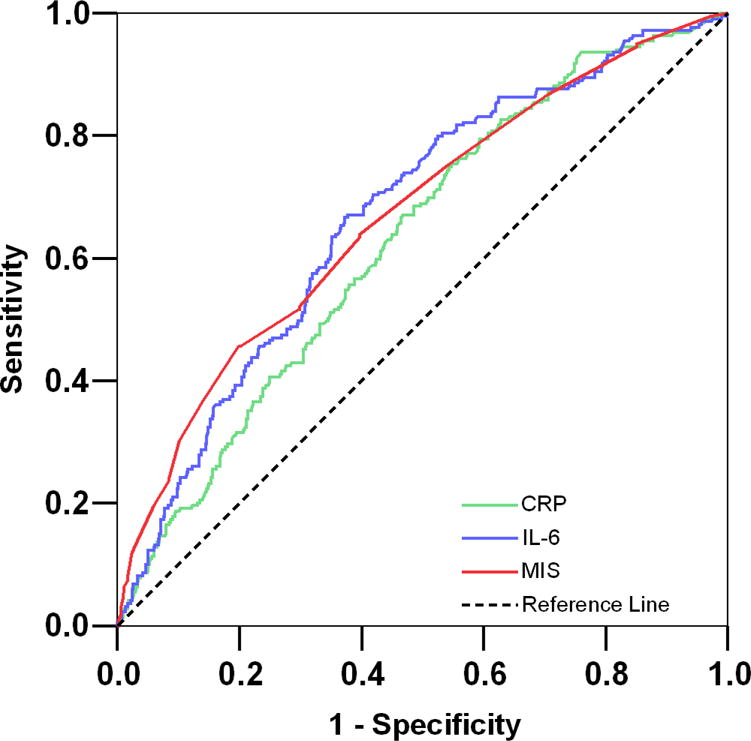
Footnote: values in parentheses are 95% confidence interval of the calculated area under the ROC curves.
Discussion
In this prospective 5-year cohort study in 809 chronic HD outpatients in Southern California, we found that the MIS is associated with health related QoL and prospective 5-year mortality. The increasing trend of mortality associated with higher MIS was robust to controlling for case-mix and other nutritional and inflammatory measures. Each 2-unit increase is MIS was associated with 2-fold higher death risk. The MIS could predict death somewhat similar to IL-6 slightly better than CRP and significantly better than each of its 10 components, the SGA and serum prealbumin. A poorer health-related QoL in diverse scales and dimensions of the SF-36 was observed across the worsening MIS quartiles. In addition, MIS was correlated with other nutritional variables, serum iron and hemoglobin level. These findings imply that MIS is a useful and robust marker of nutritional and inflammatory status with clinically relevant associations with QoL and survival and that its mortality predictability is at least as good as, if not better than, some elaborate tests of inflammation and nutritional status.
Individuals with CKD have an exceptionally high mortality rate and a high burden of cardiovascular disease.36 About one of every five of the 400,000 HD patients in the United States die every year.37 Even though half of all these deaths are attributed to cardiovascular disease, measures of PEW, and not traditional cardiovascular risk factors, are the strongest predictors of mortality in HD patients.2, 38 The confounding effect of PEW and inflammation, together known as MICS, on associations between traditional cardiovascular risk factors, such as lipids, and clinical outcome is so strong that these latter associations appear paradoxically inversed.39, 40 Therefore, reliable markers of PEW with stronger and more robust associations with morbidity and mortality in HD patients are needed, so that patients at risk can better be identified for focused nutritional and anti-inflammatory interventions.
The MIS was first introduced in 2001 as an attempt to make a comprehensive and quantitative but easy-to-assess tool to evaluate malnutrition and inflammation in dialysis patients.2, 4 Today, the MIS is used to assess nutritional status in over 100,000 DaVita dialysis patients at least annually. The MIS is a constellation of 6 to 7 original SGA components along with BMI, serum albumin, and TIBC, which are readily and frequently (monthly) available in almost all dialysis patients in the USA and many other countries around the world. Hence, calculating the MIS in a given patient does not need additional testing, nor does it usually impose additional cost, especially since all the variables included in MIS are usually available in patient records or can be directly obtained from the patients or via a brief nutritional examination.
In this study, we found that MIS was associated with QoL and mortality over a 5-year follow-up period. These associations were robust to multivariate adjustment including case-mix and those nutritional and inflammatory variables not included in the MIS. The cubic spline figure for the fully adjusted Cox proportional model, which included adjustment for proinflammatory cytokines, showed that the death risk increased substantially in patients with the MIS above 4 to 5 (Figure 3, panel d). This finding is in accordance with a recent report by Ho et al, who found HD patients with MIS score of more than 4 to 5 had a significant risk of 1-year mortality6. Several recent studies have found rather strong associations between the proinflammatory cytokines and mortality in CKD patients.18–21 In our current study, we found that mortality predictability of MIS is equal to serum IL-6 and somewhat higher than CRP. This finding implies that IL-6 and CRP can be easily replaced by the MIS in daily clinical practice to determine inflammation state of HD patients and to risk-stratify these individuals.
A clinically relevant finding was the association of the MIS and SF-36 measured health related QoL. Indeed, the HD patients within the highest MIS quartiles had the worst QoL scores across most SF-36 scales and dimensions. This finding is important, since the QoL per se is a predictor of survival in the CKD patient population.41, 42 In a study of 1000 patients at three dialysis facilities in the USA, lower scores in the physical component of QoL were associated with higher death risk and hospitalization in the next 2 years.43 In addition to physical component and scales, our study showed that the MIS was associated with mental and psychological aspects of QoL. A large study in 5,256 HD patients from the USA and Europe, revealed that the psychological or mental components of QoL predict death and hospitalization in HD patients.44
Our study also showed that the MIS captures most of the main criteria suggested for diagnosis of PEW.2 Whereas serum albumin, BMI, and muscle wasting are inherent components of the MIS, our study showed that the MIS also correlates with other markers of PEW including serum prealbumin (transthyretin), fat weight and NIR measured fat percentage, mid-arm muscle circumference, and nPNA (nPCR) as a surrogate of dietary protein intake. Considering the associations between the MIS and inflammatory markers as well as diagnostic markers of PEW and also the associations of the MIS with QoL and mortality, it could be speculated that the MIS has wide range of clinical utility from assessment of nutritional status and inflammation to risk-stratification of CKD patients.
A potential limitation of the present study is a selection bias during enrollment. However, since mortality in our cohort was less than the base population,22 it might be argued that a selection bias with such a direction would lead to a bias toward the null, so without this bias our results may have been even stronger. Other limitations include lack of information on dialysis access, dialysis membrane and other known or unknown confounders. The strengths of our study include the sample size, which was moderately large, the comprehensive clinical and laboratory evaluations with concomitant assessment of quality of life and body composition measures, and detailed evaluation of comorbid states by study physicians at baseline. Unlike previous cohorts that have been studied, ours has been extensively characterized for markers of inflammation and nutritional status, including direct total body fat measurements. The availability of these measures allowed us to demonstrate that MIS was strongly associated with mortality risk independent of influences from other known nutritional and inflammatory markers in this group of HD patients. Another strength of this cohort is that the subjects were selected randomly without having any prior knowledge of their inflammation status. Finally, the very same blood specimens that were utilized to measure markers of PEW were also used for the cytokines measurements.
In conclusion, we found that MIS, as a constellation of readily available clinical and paraclinical variables, correlated with several surrogates of body composition, health related QoL and death risk in 809 HD patients who followed up to 5 years. The full version of the MIS was superior to its 10 components in predicting survival. The comparisons between the MIS and other markers of nutrition and inflammation indicate that MIS may be used as a marker of inflammation in lieu of IL-6 or CRP. Examining the utility of MIS and its associations with clinically relevant outcomes may lead to more effective strategies to identify patients at risk of PEW and inflammation and to the development of focused nutritional and anti-inflammatory interventions to improve nutritional status and, hence, survival in almost half a million dialysis patients and over the 20 million individuals with CKD in the United States and many more throughout the world.
Acknowledgments
The authors are thankful to Ms. Stephanie Griffith and Dr. Victor Goh, at Harbor-UCLA GCRC Core Laboratories for the management of blood samples and measuring inflammatory markers. They are also indebted to hard-working collaborating dietitians in 10 DaVita dialysis facilities in Los Angeles South Bay area and DaVita teammates in these facilities.
Funding Sources: This study was supported by a National Institutes of Health, National Institute of Diabetes, Digestive and Kidney Disease grant K21-DK61162 (for KKZ). Additional sources of funding include a research grants from Watson Pharmaceuticals, DaVita Clinical Research, Harold Simmons (for KKZ), and a General Clinical Research Center (GCRC) grant # M01-RR00425 from the National Centers for Research Resources, National Institutes of Health.
Footnotes
Potential Conflict of Interests: None.
References
- 1.Clinical practice guidelines for nutrition in chronic renal failure. K/DOQI, National Kidney Foundation. Am J Kidney Dis. 2000;35:S1–S140. doi: 10.1053/ajkd.2000.v35.aajkd03517. [DOI] [PubMed] [Google Scholar]
- 2.Fouque D, Kalantar-Zadeh K, Kopple J, Cano N, Chauveau P, Cuppari L, et al. A proposed nomenclature and diagnostic criteria for protein-energy wasting in acute and chronic kidney disease. Kidney Int. 2008;73(4):391–398. doi: 10.1038/sj.ki.5002585. [DOI] [PubMed] [Google Scholar]
- 3.Kalantar-Zadeh K. Recent advances in understanding the malnutrition-inflammation-cachexia syndrome in chronic kidney disease patients: What is next? Semin Dial. 2005;18(5):365–369. doi: 10.1111/j.1525-139X.2005.00074.x. [DOI] [PubMed] [Google Scholar]
- 4.Kalantar-Zadeh K, Kopple JD, Block G, Humphreys MH. A malnutrition-inflammation score is correlated with morbidity and mortality in maintenance hemodialysis patients. Am J Kidney Dis. 2001;38(6):1251–1263. doi: 10.1053/ajkd.2001.29222. [DOI] [PubMed] [Google Scholar]
- 5.Elsurer R, Afsar B, Sezer S, Arat Z, Ozdemir FN, Haberal M. Malnutrition inflammation score is associated with coronary artery disease in hepatitis C virus-infected hemodialysis patients. Eur J Clin Nutr. 2007 doi: 10.1038/sj.ejcn.1602867. [DOI] [PubMed] [Google Scholar]
- 6.Ho LC, Wang HH, Peng YS, Chiang CK, Huang JW, Hung KY, et al. Clinical Utility of Malnutrition-Inflammation Score in Maintenance Hemodialysis Patients: Focus on Identifying the Best Cut-Off Point. Am J Nephrol. 2008;28(5):840–846. doi: 10.1159/000137684. [DOI] [PubMed] [Google Scholar]
- 7.Bilgic A, Akgul A, Sezer S, Arat Z, Ozdemir FN, Haberal M. Nutritional status and depression, sleep disorder, and quality of life in hemodialysis patients. J Ren Nutr. 2007;17(6):381–388. doi: 10.1053/j.jrn.2007.08.008. [DOI] [PubMed] [Google Scholar]
- 8.Micozkadioglu H, Micozkadioglu I, Zumrutdal A, Erdem A, Ozdemir FN, Sezer S, et al. Relationship between depressive affect and malnutrition-inflammation complex syndrome in haemodialysis patients. Nephrology (Carlton) 2006;11(6):502–505. doi: 10.1111/j.1440-1797.2006.00664.x. [DOI] [PubMed] [Google Scholar]
- 9.Sezer S, Elsurer R, Ulubay G, Ozdemir FN, Haberal M. Factors associated with peak oxygen uptake in hemodialysis patients awaiting renal transplantation. Transplant Proc. 2007;39(4):879–882. doi: 10.1016/j.transproceed.2007.02.013. [DOI] [PubMed] [Google Scholar]
- 10.Akgul A, Bilgic A, Sezer S, Ozdemir FN, Olcay I, Arat Z, et al. Effect of protein-energy malnutrition on erythropoietin requirement in maintenance hemodialysis patients. Hemodial Int. 2007;11(2):198–203. doi: 10.1111/j.1542-4758.2007.00169.x. [DOI] [PubMed] [Google Scholar]
- 11.Kalantar-Zadeh K, McAllister CJ, Lehn RS, Lee GH, Nissenson AR, Kopple JD. Effect of malnutrition-inflammation complex syndrome on EPO hyporesponsiveness in maintenance hemodialysis patients. Am J Kidney Dis. 2003;42(4):761–773. doi: 10.1016/s0272-6386(03)00915-6. [DOI] [PubMed] [Google Scholar]
- 12.Afsar B, Sezer S, Ozdemir FN, Celik H, Elsurer R, Haberal M. Malnutrition-inflammation score is a useful tool in peritoneal dialysis patients. Perit Dial Int. 2006;26(6):705–711. [PubMed] [Google Scholar]
- 13.Sezer S, Elsurer R, Afsar B, Arat Z, Ozdemir NF, Haberal M. Peritoneal small solute transport rate is related to the malnutrition inflammation score in peritoneal dialysis patients. Nephron Clin Pract. 2007;107(4):c156–162. doi: 10.1159/000110051. [DOI] [PubMed] [Google Scholar]
- 14.Chan JY, Che KI, Lam KM, Chow KM, Chung KY, Li PK, et al. Comprehensive malnutrition inflammation score as a marker of nutritional status in Chinese peritoneal dialysis patients. Nephrology (Carlton) 2007;12(2):130–134. doi: 10.1111/j.1440-1797.2006.00693.x. [DOI] [PubMed] [Google Scholar]
- 15.Yamada K, Furuya R, Takita T, Maruyama Y, Yamaguchi Y, Ohkawa S, et al. Simplified nutritional screening tools for patients on maintenance hemodialysis. Am J Clin Nutr. 2008;87(1):106–113. doi: 10.1093/ajcn/87.1.106. [DOI] [PubMed] [Google Scholar]
- 16.Yang SC, Chiang CK, Hsu SP, Hung KY. Relationship between interdialytic weight gain and nutritional markers in younger and older hemodialysis patients. J Ren Nutr. 2008;18(2):210–222. doi: 10.1053/j.jrn.2007.11.012. [DOI] [PubMed] [Google Scholar]
- 17.Rambod M, Kovesdy CP, Kalantar-Zadeh K. Malnutrition-Inflammation Score for risk stratification of patients with CKD: is it the promised gold standard? Nat Clin Pract Nephrol. 2008 doi: 10.1038/ncpneph0834. [DOI] [PubMed] [Google Scholar]
- 18.Rao M, Guo D, Perianayagam MC, Tighiouart H, Jaber BL, Pereira BJ, et al. Plasma interleukin-6 predicts cardiovascular mortality in hemodialysis patients. Am J Kidney Dis. 2005;45(2):324–333. doi: 10.1053/j.ajkd.2004.09.018. [DOI] [PubMed] [Google Scholar]
- 19.Panichi V, Maggiore U, Taccola D, Migliori M, Rizza GM, Consani C, et al. Interleukin-6 is a stronger predictor of total and cardiovascular mortality than C-reactive protein in haemodialysis patients. Nephrol Dial Transplant. 2004;19(5):1154–1160. doi: 10.1093/ndt/gfh052. [DOI] [PubMed] [Google Scholar]
- 20.Badiou S, Cristol JP, Jaussent I, Terrier N, Morena M, Maurice F, et al. Fine-tuning of the prediction of mortality in hemodialysis patients by use of cytokine proteomic determination. Clin J Am Soc Nephrol. 2008;3(2):423–430. doi: 10.2215/CJN.02010507. [DOI] [PMC free article] [PubMed] [Google Scholar]
- 21.Pecoits-Filho R, Barany P, Lindholm B, Heimburger O, Stenvinkel P. Interleukin-6 is an independent predictor of mortality in patients starting dialysis treatment. Nephrol Dial Transplant. 2002;17(9):1684–1688. doi: 10.1093/ndt/17.9.1684. [DOI] [PubMed] [Google Scholar]
- 22.Colman S, Bross R, Benner D, Chow J, Braglia A, Arzaghi J, et al. The Nutritional and Inflammatory Evaluation in Dialysis patients (NIED) study: overview of the NIED study and the role of dietitians. J Ren Nutr. 2005;15(2):231–243. doi: 10.1053/j.jrn.2005.01.003. [DOI] [PubMed] [Google Scholar]
- 23.Kalantar-Zadeh K, Brennan ML, Hazen SL. Serum myeloperoxidase and mortality in maintenance hemodialysis patients. Am J Kidney Dis. 2006;48(1):59–68. doi: 10.1053/j.ajkd.2006.03.047. [DOI] [PubMed] [Google Scholar]
- 24.Kalantar-Zadeh K, Kopple JD, Kamranpour N, Fogelman AM, Navab M. HDL-inflammatory index correlates with poor outcome in hemodialysis patients. Kidney Int. 2007;72(9):1149–1156. doi: 10.1038/sj.ki.5002491. [DOI] [PubMed] [Google Scholar]
- 25.Kalantar-Zadeh K, Kuwae N, Wu DY, Shantouf RS, Fouque D, Anker SD, et al. Associations of body fat and its changes over time with quality of life and prospective mortality in hemodialysis patients. Am J Clin Nutr. 2006;83(2):202–210. doi: 10.1093/ajcn/83.2.202. [DOI] [PubMed] [Google Scholar]
- 26.Mehrotra R, Kermah D, Fried L, Kalantar-Zadeh K, Khawar O, Norris K, et al. Chronic peritoneal dialysis in the United States: declining utilization despite improving outcomes. J Am Soc Nephrol. 2007;18(10):2781–2788. doi: 10.1681/ASN.2006101130. [DOI] [PubMed] [Google Scholar]
- 27.Beddhu S, Bruns FJ, Saul M, Seddon P, Zeidel ML. A simple comorbidity scale predicts clinical outcomes and costs in dialysis patients. Am J Med. 2000;108(8):609–613. doi: 10.1016/s0002-9343(00)00371-5. [DOI] [PubMed] [Google Scholar]
- 28.Nelson EE, Hong CD, Pesce AL, Singh S, Pollak VE. Anthropometric norms for the dialysis population. Am J Kidney Dis. 1990;16:32–37. doi: 10.1016/s0272-6386(12)80782-7. [DOI] [PubMed] [Google Scholar]
- 29.Williams AJ, McArley A. Body composition, treatment time, and outcome in hemodialysis patients. J Ren Nutr. 1999;9(3):157–162. doi: 10.1016/s1051-2276(99)90056-0. [DOI] [PubMed] [Google Scholar]
- 30.Kalantar-Zadeh K, Dunne E, Nixon K, Kahn K, Lee GH, Kleiner M, et al. Near infra-red interactance for nutritional assessment of dialysis patients. Nephrol Dial Transplant. 1999;14(1):169–175. doi: 10.1093/ndt/14.1.169. [DOI] [PubMed] [Google Scholar]
- 31.Ridker PM, Rifai N, Rose L, Buring JE, Cook NR. Comparison of C-reactive protein and low-density lipoprotein cholesterol levels in the prediction of first cardiovascular events. N Engl J Med. 2002;347(20):1557–1565. doi: 10.1056/NEJMoa021993. [DOI] [PubMed] [Google Scholar]
- 32.Erbagci AB, Tarakcioglu M, Aksoy M, Kocabas R, Nacak M, Aynacioglu AS, et al. Diagnostic value of CRP and Lp(a) in coronary heart disease. Acta Cardiol. 2002;57(3):197–204. doi: 10.2143/AC.57.3.2005389. [DOI] [PubMed] [Google Scholar]
- 33.Beutler B, Cerami A. The biology of cachectin/TNF - a primary mediator of host response. Ann Rev Immunol. 1989;7:625–655. doi: 10.1146/annurev.iy.07.040189.003205. [DOI] [PubMed] [Google Scholar]
- 34.Durrleman S, Simon R. Flexible regression models with cubic splines. Stat Med. 1989;8:551–561. doi: 10.1002/sim.4780080504. [DOI] [PubMed] [Google Scholar]
- 35.Pepe MS, Janes H, Longton G, Leisenring W, Newcomb P. Limitations of the odds ratio in gauging the performance of a diagnostic, prognostic, or screening marker. Am J Epidemiol. 2004;159(9):882–890. doi: 10.1093/aje/kwh101. [DOI] [PubMed] [Google Scholar]
- 36.Go AS, Chertow GM, Fan D, McCulloch CE, Hsu CY. Chronic kidney disease and the risks of death, cardiovascular events, and hospitalization. N Engl J Med. 2004;351(13):1296–1305. doi: 10.1056/NEJMoa041031. [DOI] [PubMed] [Google Scholar]
- 37.United States Renal Data System. Excerpts from the USRDS 2005 Annual Data Report: Atlas of End-Stage Renal Disease in the United States, National Institutes of Health, National Institute of Diabetes and Digestive and Kidney Diseases. Am J Kid Dis. 2006;47(Supplement 1):1–286. [Google Scholar]
- 38.Kalantar-Zadeh K, Balakrishnan VS. The kidney disease wasting: inflammation, oxidative stress, and diet-gene interaction. Hemodial Int. 2006;10(4):315–325. doi: 10.1111/j.1542-4758.2006.00124.x. [DOI] [PubMed] [Google Scholar]
- 39.Kilpatrick RD, McAllister CJ, Kovesdy CP, Derose SF, Kopple JD, Kalantar-Zadeh K. Association between serum lipids and survival in hemodialysis patients and impact of race. J Am Soc Nephrol. 2007;18(1):293–303. doi: 10.1681/ASN.2006070795. [DOI] [PubMed] [Google Scholar]
- 40.Kalantar-Zadeh K, Abbott KC, Salahudeen AK, Kilpatrick RD, Horwich TB. Survival advantages of obesity in dialysis patients. Am J Clin Nutr. 2005;81(3):543–554. doi: 10.1093/ajcn/81.3.543. [DOI] [PubMed] [Google Scholar]
- 41.Kalantar-Zadeh K, Unruh M. Health related quality of life in patients with chronic kidney disease. Int Urol Nephrol. 2005;37(2):367–378. doi: 10.1007/s11255-004-0012-4. [DOI] [PubMed] [Google Scholar]
- 42.Mapes DL, Lopes AA, Satayathum S, McCullough KP, Goodkin DA, Locatelli F, et al. Health-related quality of life as a predictor of mortality and hospitalization: the Dialysis Outcomes and Practice Patterns Study (DOPPS) Kidney Int. 2003;64(1):339–349. doi: 10.1046/j.1523-1755.2003.00072.x. [DOI] [PubMed] [Google Scholar]
- 43.DeOreo PB. Hemodialysis patient-assessed functional health status predicts continued survival, hospitalization, and dialysis-attendance compliance. Am J Kidney Dis. 1997;30(2):204–212. doi: 10.1016/s0272-6386(97)90053-6. [DOI] [PubMed] [Google Scholar]
- 44.Lopes AA, Bragg J, Young E, Goodkin D, Mapes D, Combe C, et al. Depression as a predictor of mortality and hospitalization among hemodialysis patients in the United States and Europe. Kidney Int. 2002;62(1):199–207. doi: 10.1046/j.1523-1755.2002.00411.x. [DOI] [PubMed] [Google Scholar]