

Abstract
Background
Tobacco exposure is often quantified by serum or saliva concentrations of the primary nicotine metabolite, cotinine. However, average cotinine concentrations are higher in African American (AA) compared to Whites with similar smoking levels. Cotinine is metabolized by UGT2B10 and CYP2A6, and low UGT2B10 activity is common in AA, due to the prevalence of a UGT2B10 splice variant.
Methods
UGT2B10-activity was phenotyped in 1446 smokers (34% AA) by measuring the percentage of cotinine excreted as a glucuronide. Urinary total nicotine equivalents (TNE), the sum of nicotine and 6 metabolites were determined to quantify smoking dose, and cotinine and 3′-hydroxycotinine were quantified in saliva (study 1) or serum (study 2).
Results
Ninety seven smokers (78% AA) were null for UGT2B10 activity, and the saliva and serum cotinine levels, after adjustment for TNE and CPD were 68% and 48% higher in these smokers compared to non-null smokers (p<0.001). After adjustment for TNE and CPD, salivary cotinine was 35% higher, and serum cotinine 24% higher in AA versus White smokers, but with additional adjustment for UGT2B10 activity, there were no significant differences in saliva and serum cotinine concentrations between these two groups.
Conclusion
UGT2B10 activity significantly influences plasma cotinine levels and higher cotinine concentrations in AA versus White smokers (after adjustment for smoking dose) result from lower levels of UGT2B10-catalyzed cotinine glucuronidation by AA.
Impact
UGT2B10 activity or genotype should be considered when using cotinine as a tobacco exposure biomarker, particularly in populations such as AA with high frequencies of UGT2B10 non-functional variants.
Keywords: cotinine, UGT2B10, African Americans
Introduction
It was reported more than 25 years ago that despite smoking fewer cigarettes per day (CPD), serum cotinine levels of African American smokers are significantly higher than those of White smokers (1). Higher serum cotinine concentrations have been observed in all National Health and Nutrition Surveys from 1988 through 2012 (2–5). In addition, African Americans exposed to secondhand smoke have higher serum cotinine levels than Whites with similar exposures (3,6). Differences in both nicotine metabolism and intake likely contribute to the differences in serum cotinine between these two groups (7,8).
Nicotine metabolism occurs primarily by P450 2A6-catalyzed 5′-oxidation (Fig 1). The iminium ion product of this reaction is then converted to cotinine either by a second P450 2A6-catalyzed oxidation or by aldehyde oxidase (9,10). Cotinine is the primary nicotine metabolite in plasma and is a widely used biomarker of smoking and nicotine exposure (11). Cotinine is metabolized to trans 3′-hydroxycotinine (3HCOT) and cotinine N-glucuronide. A small amount of cotinine N-oxide is also formed. In smokers, 3HCOT is the product of P450 2A6-catalyzed oxidation of cotinine; UGT2B10 is the catalyst of cotinine -glucuronidation (12,13). Smokers who are homozygous for a UGT2B10 spice variant excrete no cotinine glucuronide (13). Glucuronide conjugation of nicotine is also catalyzed by UGT2B10 (12,14,15). In smokers’ urine, the sum of nicotine, cotinine, 3HCOT, their respective glucuronide conjugates, plus nicotine N-oxide accounts for >85% of the nicotine dose consumed, and is referred to as total nicotine equivalents (TNE), an excellent biomarker of tobacco exposure (16,17).
Figure 1.
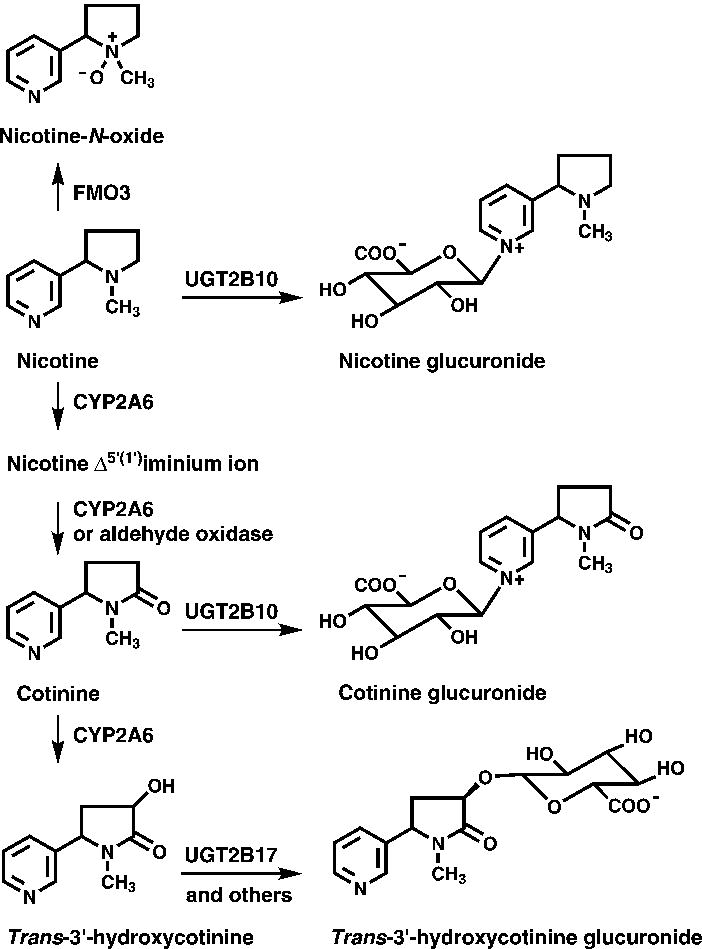
Nicotine metabolic pathways. Adapted from Murphy et al, Carcinogenesis (2014) 35 (11): 2526–2533. Used by permission of Oxford University Press.
There are several studies that confirm higher intake of nicotine per cigarette by African Americans relative to Whites. In a pharmacokinetic study, nicotine intake per cigarette was reported to be 30% higher in African Americans (7). In a more recent relatively small study, we reported a significantly higher ratio of TNE to reported CPD for African American smokers (18). A higher ratio of TNE to CPD in African American compared to White smokers was also reported in a study of over 3000 smokers (19). In this study cigarette butts were collected to confirm reported CPD. Together these data support the conclusion that at least some of the higher serum cotinine levels found in African American smokers is attributable to a higher intake of nicotine per cigarette. However, pharmacokinetic studies have confirmed that cotinine clearance is slower in African Americans compared to Whites (7). In addition, African Americans glucuronidate cotinine significantly less than do White smokers (8,18). The low levels of cotinine glucuronidation are primarily due to the relative high frequency of a UGT2B10 splice variant in African Americans (13,20,21).
In the study presented here, the relationship of saliva or serum cotinine levels to UGT2B10 activity was investigated, and the contribution of low UGT2B10 activity to the higher serum (or saliva) cotinine levels in African American compared to white smokers was determined. The concentrations of nicotine and its metabolites in urine and serum (or saliva) samples were quantified in two independent study populations, both with a relatively high percentage of African American smokers. The effect of UGT2B10 phenotype on the serum (or saliva) and urine ratios of 3HCOT to cotinine (as measures of CYP2A6 activity) was also investigated.
Materials and Methods
Study population
This investigation of the effect of UGT2B10 phenotype on nicotine metabolite biomarkers was carried out using participants in one of two randomized trials of reduced nicotine content cigarettes. The subjects included in the analyses were those for whom baseline urine and either a saliva or serum sample were collected. DNA was not available. Only baseline samples were used from either study. Study 1 was recently completed and the details and results of the trial reported (22). At baseline, the participants (n=839, 38% Black, 51% White and 5% Hispanic) were smoking their usual brand of cigarette and did not report using any other nicotine containing products in more than 9 of the last 30 days. Eligibility criteria for the trial included an age of 18 years, use of at least 5 CPD and either expired carbon monoxide levels >8ppm or urinary cotinine concentration > 100 ng/ml at the screening visit. Among the 839 subjects, 816 had both urine and saliva collected at baseline. Participants with TNE < 4 (n=20), reflecting very light smoking were excluded from our analysis of cotinine glucuronidation (UGT2B10 phenotype). One urine sample that appeared to be contaminated with nicotine was also excluded, therefore a total of 795 participants were included in our Study 1 analyses. Study 2 participants include all subjects recruited to an on-going trial as of May 1, 2016, for whom urine and serum samples were available and with baseline TNE > 4 nmol/ml (n= 651), other eligibility criteria were the same as study 1. At baseline the participants of both studies were smoking their usual brand cigarettes, and the average CPD was assessed with the use of an interactive voice response system (InterVision Media), which telephoned and asked them to report the number of cigarettes smoked in the past day.
Biomarkers
Liquid chromatography with tandem mass spectrometry was used for the analyses of urinary, saliva, and serum biomarkers as previously described (13,23). In urine (a first morning void) total nicotine, total cotinine, total 3HCOT, nicotine N-oxide and cotinine were quantified. Total refers to the sum of the analyte and its glucuronide conjugate and was measured by treating the urine with β-glucuronidase prior to analysis. TNE values were calculated as the sum of total nicotine, total cotinine, total 3HCOT and nicotine N-oxide. UGT2B10 phenotype was determined as the percent of cotinine excreted as its glucuronide conjugate. The relationship of cotinine glucuronidation to UGT2B10 genotype was previously described (13). Smokers categorized as null for UGT2B10 activity were those with no quantifiable difference between the concentration of cotinine and total cotinine in urine. In practice these individuals were those with a ratio of total cotinine over free cotinine of <1.1, since the coefficient of variance for the independent analysis (n=30) of 6 replicate samples for cotinine and total cotinine was 6.8% and the calculated coefficient of variance ratio was 9.6%. Cotinine and 3-HCOT were quantified in serum and saliva and the ratio of 3HCOT to cotinine calculated as a measure of CYP2A6 activity as previously described (23).
Statistical analysis
Biomarkers were compared by UGT2B10 phenotype (null vs. non-null) and by race (White vs. African American). For UGT2B10 phenotype, urinary nicotine, nicotine metabolites as a molar percentage of TNE, and TNE were summarized by phenotype using the mean and standard deviation and compared between groups using the two-sample t-test for unequal variances. TNE was also summarized by phenotype using the geometric mean and interquartile range. Geometric means were compared by phenotype by completing a two-sample t-test for unequal variance on the natural log of TNE. Saliva or serum cotinine were compared by CYP2A6 phenotype using linear regression with the natural log of the biomarker as the outcome and terms in the model for UGT2B10 phenotype, CPD, and TNE and summarized by the geometric mean for each phenotype adjusted for TNE and CPD (i.e. assuming that TNE and CPD equaled their respective averages observed in the study population). The difference in biomarkers between groups was summarized by the ratio of geometric means. A second model was fit that also included the natural log of the ratio of total cotinine over free cotinine as a covariate to determine the proportion of the effect of UGT2B10 phenotype on the biomarker that can be explained by the natural log of the ratio of total cotinine over free cotinine. An identical analysis was completed for the comparison of biomarkers by race.
Results
UGT2B10 activity was phenotyped by determining the ratio of urinary cotinine to total cotinine in two studies of smokers. The characteristics of the participants in those studies are presented in Table 1. The average age of the smoker in study 2 was slightly higher (44.1 vs 41.6 years) and the percentage of the population that was African American was slightly lower 30.7% vs 36.7%. The largest difference between the two studies was the extent of smoking among the participants. The average number of CPD in Study 1 was 15.6 ± 7.6 compared to 16.8 ± 8.2 in Study 2. The higher reported CPD in study 2 is consistent with the higher mean TNE (77 nmol/ml) in urine samples from these smokers compared to those in study 1 (57 nmol/ml).
Table 1.
Demographics for participants of the two studies
| Study 1 (n = 795) |
Study 2 (n = 651) |
||
|---|---|---|---|
|
|
|||
| Age: mean years (SD) | 41.6 (13.2) | 44.1 (13.1) | |
| Sex, N (%) | Men | 456 (57.4%) | 382 (58.7%) |
| Women | 339 (42.6%) | 269 (41.3%) | |
| Race N (%) | White | 416 (52.3%) | 386 (59.3%) |
| Black | 293 (36.9%) | 200 (30.7%) | |
| Other | 86 (10.8%) | 65 (10%) | |
| BMI: mean kg/m2 (SD) | 29.4 (7.7) | 29.4 (7) | |
| CPD: mean (SD) | 15.6 (7.6) | 16.8 (7) | |
| TNE: mean nmol/ml (SD) | 57 (39.6) | 77 (53.5) | |
Effect of UGT2B10 phenotype on nicotine metabolism
To identify those smokers with essentially no UGT2B10 activity the percent of cotinine excreted as its glucuronide conjugate was determined. Individuals were characterized as UGT2B10 null if there was no quantifiable difference between their urinary concentration of total cotinine and cotinine. Using this criteria 60 (7.5%) smokers in study 1 and 37 (5.7%) of the smokers in study 2 were classified as null (Table 2). The remaining smokers in each study, who would be either heterozygous or homozygous for UGT2B10 alleles coding for active enzyme, are referred to as “non-null”. As expected based on the racial/ethnic specific frequency of the UGT2B10 splice variant, the majority of the UGT2B10 null individuals were African Americans, 75% in study 1 and 84% in study 2. Fifteen percent of African Americans are predicted to be homozygous for a UGT2B10 variant allele that codes for non-functional enzyme: either a common splice variant or the Asp67Tyr variant (13), therefore, 45 smokers in Study 1 and 30 smokers in Study 2 (13). In agreement with these values, we identified 45 African American smokers as null in study 1and 31 in study 2 (Table 2). Based on the 7.5% of smokers in study 1 identified as null, the frequency of non-functional UGT2B10 alleles in this study population is 27.4%, and 51% (405 smokers) are predicted to be heterozygous for a non-functional UGT2B10 allele. Similarly in study 2, 36% or 237 of the smokers are expected to be heterozygous. In both studies the majority of these smokers will be African American.
Table 2.
Urinary nicotine and nicotine metabolites as a molar percentage of TNE stratified by UGT2B10 phenotypea
| Analytes | Study 1
|
Study 2
|
||||
|---|---|---|---|---|---|---|
| UGT2B10 Null (n = 60) |
UGT2B10 Non-null (n = 735) |
P value | UGT2B10 Null (n = 37) |
UGT2B10 Non-null (n = 614) |
P value | |
|
|
|
|||||
| Total Nicotineb | 20 (21.1) | 18.5 (11.5) | 0.571 | 14.7 (12.6) | 15.2 (10.9) | 0.796 |
| Nicotine-N-oxideb | 8.2 (4.9) | 7 (4.4) | 0.067 | 7.7 (5.4) | 5.6 (4.2) | 0.028 |
| Cotinineb | 21.5 (9.7) | 13.1 (5.9) | < 0.001 | 20.6 (7.9) | 11.4 (5.3) | < 0.001 |
| Cotinine glucuronideb | ND | 17.2 (8.4) | < 0.001 | ND | 16 (7.1) | < 0.001 |
| Total 3-hydroxycotinineb | 52.2 (17.9) | 44.3 (16.2) | 0.002 | 58.3 (19.9) | 51.7 (16.3) | 0.057 |
| C-oxidation (sum of total cotinine and total 3-hydroxycotinine)b | 73.4 (16.4) | 74.5 (13.7) | 0.601 | 77.7 (15.8) | 79.2 (13.6) | 0.582 |
| TNEb (nmol/ml) | 56.6 (36.6) | 57.1 (39.8) | 0.929 | 57.4 (39.1) | 78.8 (53.9) | 0.003 |
| TNEc (nmol/ml) | 45.1 (39.6) | 45.7 (44.8) | 0.895 | 47.3 (45.5) | 62.7 (56.8) | 0.012 |
| Number of African Americans (%) | 45 (75%) | 248 (33.7%) | < 0.001 | 31 (83.8%) | 169 (27.5%) | < 0.001 |
UGT2B10 phenotype was characterized by cotinine glucuronidation, smokers with no quantifiable cotinine glucuronide are defined as null, values for each analyte are the percentage of TNE.
mean (SD), ND, not detected (nmol total cotinine/nmol cotinine <1.1, based on a coefficient of variation of 9.6%)
geometric mean (interquartile range)
The relative distribution of nicotine and its metabolites in urine, expressed as a percentage of TNE, was determined for the UGT2B10 null and non-null smokers in each study. As expected, in both studies the average excretion of unconjugated cotinine by null individuals was significantly greater than that by non-null smokers (p<0.001,Table 2). However, total cotinine excretion was still lower in null compared to non-null smokers, 21.9% vs 30.3%, p<0.001 (study 1) and 21% vs 27.4%, p<0.001 (study 2). The lack of cotinine glucuronidation by UGT2B10 null smokers also resulted in a higher percentage of TNE being excreted as 3HCOT by these individuals compared to non-null smokers, 52.2% vs 44.3% (study 1) and 58.3% vs 51.7% (study 2). Also of note, in study 2 there was a significant difference between TNE excreted by non-null compared to null smokers. Since the majority of null individuals are African American the lower TNE in null smokers may be due to the significantly lower TNE of African Americans compared to Whites in study 2 (Table 3).
Table 3.
Urinary nicotine and nicotine metabolites as a percentage of TNE stratified by race
| Analytesa | Study 1
|
Study 2
|
||||
|---|---|---|---|---|---|---|
| African Americans (n = 295) | Whites(n = 416) | P value | African Americans (n = 200) | Whites (n = 386) | P value | |
| Study 1
|
Study 2
|
|||||
| Total nicotineb | 19.9 (14.8) | 17.9 (10.6) | 0.05 | 16.5 (11.6) | 14.4 (10.2) | 0.032 |
| Nicotine-N-oxideb | 8.1 (5.1) | 6.5 (3.8) | < 0.001 | 6.8 (4.9) | 5.2 (3.8) | < 0.001 |
| Cotinineb | 16.1 (7.6) | 12.1 (5.5) | < 0.001 | 14.3 (7.1) | 10.7 (4.8) | < 0.001 |
| Cotinine glucuronideb | 10.9 (8.1) | 19.6 (8.4) | < 0.001 | 10.3 (7.5) | 17.5 (6.8) | < 0.001 |
| Total 3-hydroxycotinineb | 45.5 (16.6) | 43.9 (16.3) | 0.213 | 52.3 (18) | 52.3 (15.9) | 0.974 |
| C-oxidation (sum of total cotinine and total 3-hydroxycotinine)b | 72.4 (14.9) | 75.6 (13.1) | 0.003 | 76.7 (14.1) | 80.4 (12.9) | 0.002 |
| TNEb (nmol/ml) | 54.3 (39.3) | 58.4 (40.6) | 0.184 | 72.2 (48.6) | 81.4 (54.6) | 0.039 |
| TNEc (nmol/ml) | 43.6 (34.2) | 46.2 (46.5) | 0.272 | 57 (58.6) | 65.7 (57) | 0.025 |
Each as a percent of TNE
mean (SD)
geometric mean (interquartile range)
Salivary and Serum Cotinine
Salivary cotinine concentrations in UGT2B10 null smokers in Study 1 (343 ng/ml) and serum cotinine concentrations in study 2 (358 ng/ml) were significantly higher than in non-null (205 ng/ml, study 1; 240ng/ml, study 2) after adjusting for CPD and TNE (p<0.001, Table 4). The cotinine concentration of null smokers compared to non-null smokers was 68% higher in study 1 and 48% higher for study 2 (Table 4, p<0.001). After further adjustment for UGT2B10 activity (cotinine glucuronidation), there was no difference in saliva cotinine between the two groups in study 1, (ratio of geometric means, 0.98 p=0.788, Table 4). In study 2, after adjustment for UGT2B10 activity the ratio of serum cotinine in null to non-null smokers decreased from 1.48 to 0.83 (Table 4, p=0.019). The now 17% lower cotinine levels in the UGT2B10 null individuals may be due to incomplete adjustment for the significantly higher smoking by non-null individuals (Table 2, mean TNE 78.8nmol/ml vs 57.4 nmol/ml for null).
Table 4.
Saliva or serum cotinine and CYP2A6 phenotype (3HCOT/cotinine) stratified by UGT2B10 phenotypea
| UGT2B10 Null | UGT2B10 Non-null | Ratio (null/non-null) | P valuesb | Ratio (null/non-null)b | P valuesc | |
|---|---|---|---|---|---|---|
|
|
||||||
| Study 1 | n=60 | n=735 | ||||
| Saliva biomarkers | ||||||
| Cotinine (ng/ml) | 343 (340–346) | 205 (204.6–205) | 1.68 (1.46–1.92) | < 0.001 | 0.98 (0.85–1.13) | 0.788 |
| 3-hydroxycotinine/cotinine | 0.176 (0.173–0.178) | 0.222 (0.222–0.222) | 0.79 (0.67–0.94) | 0.007 | 0.86 (0.70–1.04) | 0.133 |
| Urine biomarkers | ||||||
| Total 3-hydroxycotinine/Cotinine | 2.67 (2.63–2.71) | 3.76 (3.76–3.77) | 0.71 (0.60–0.84) | < 0.001 | 1.09 (0.90–1.31) | 0.39 |
| Study 2 | n = 37 | n = 614 | ||||
|
| ||||||
| Serum biomarkers | ||||||
| Cotinine | 358 (352–361) | 240 (240.1–240.5) | 1.48 (1.27–1.74) | < 0.001 | 0.83 (0.71–0.97) | 0.019 |
| 3-hydroxycotinine/cotinine | 0.253 (0.248–0.258) | 0.332 (0.332–0.333) | 0.76 (0.62–0.94) | 0.011 | 0.94 (0.74–1.19) | 0.598 |
| Urine biomarkers | ||||||
| Total 3-hydroxycotinine/Cotinine | 3.31 (3.23–3.40) | 5.05 (5.05–5.06) | 0.66 (0.52–0.82) | < 0.001 | 1.05 (0.82–1.35) | 0.682 |
UGT2B10 phenotype is characterized by cotinine glucuronidation, smokers with no quantifiable cotinine glucuronide are defined as null
Geometric means (95%CI) adjusted for CPD and TNE
adjusted for CPD, TNE, and UGT2B10 activity (total cotinine/cotinine)
The ratio of 3HCOT to cotinine in saliva (study 1) and serum (study 2) was significantly lower in UGT2B10 null compared to non-null smokers [Table 4, p=0.007 (study 1) and p= 0.0011 (study 2)]. Similarly, the urine ratio of total 3HCOT/cotinine was significantly lower in null compared to non-null smokers (p<0.001). After adjustment for UGT2B10 activity none of these biomarkers of P450 2A6 activity were significantly different (Table 4). In both studies, the percentage of nicotine metabolized by C-oxidation (the sum of total cotinine plus total 3HCOT per TNE), which is another measure of P450 2A6 activity was not different for UGT2B10 null and non-null smokers (Table 2).
Urinary and salivary nicotine metabolites in African American compared to White smokers
In both studies, African Americans excreted significantly less cotinine N-glucuronide as a percentage of TNE than Whites (study 1, 10.9% versus 19.6%, p<0.001; study 2 10.3% versus 17.5%, p<0.001, Table 3). The mean percentage of cotinine glucuronidation was 40% (study 1) or 42% (study 2) for African Americans compared to 62% for Whites in both studies (Table 3). The mean levels of nicotine C-oxidation was also significantly, but modestly lower in African Americans compared to Whites (72.4% vs 75.6% p=0.003 in study 1 and 76.7% vs 80.4% p=0.039 in study 2). In study 2, both the mean and geometric mean TNE were significantly higher in Whites compared to African Americans, there was no difference in TNE concentrations between the two groups in study 1. However, as observed in many other studies the mean salivary or serum cotinine concentrations in African Americans compared to Whites was higher. After adjustment for CPD and TNE the saliva cotinine (study 1) and the serum cotinine (study 2) were 35% and 24% higher in African Americans compared to Whites, (p<0.001, Table 5). However, when saliva and serum cotinine are adjusted for UGT2B10 activity the concentrations in African Americans are no longer higher than in Whites (p=0.719 and P=0.489, Table 5).
Table 5.
Saliva or serum cotinine and CYP2A6 phenotype stratified by racea
| African American | White | Ratio African Americans/White | P valuesa | Ratio African Americans/Whiteb | P valuesb | |
|---|---|---|---|---|---|---|
|
|
||||||
| Study 1 | n=295 | n=416 | ||||
| Saliva biomarkers | ||||||
| Cotinine (ng/ml) | 256 (255.4–256.4) | 190 (189.9–190.4) | 1.35 (1.24–1.46) | < 0.001 | 1.01 (0.94–1.1) | 0.719 |
| 3-hydroxycotinine/cotinine | 0.207 (0.206–0.207) | 0.229 (0.229–0.230) | 0.90 (0.82–1.0) | 0.046 | 0.94 (0.8–1.01) | 0.314 |
| Urine biomarkers | ||||||
| Total 3-hydroxycotinine/Cotinine | 3.18 (3.17–3.19) | 4.02 (4.01–4.03) | 0.79 (0.72–0.87) | < 0.001 | 0.97 (0.87–1.08) | 0.598 |
| Study 2 | n = 200 | n = 386 | ||||
|
| ||||||
| Serum biomarkers | ||||||
| Cotinine (ng/ml) | 284 (282.8–284.2) | 229 (228.9–229.4) | 1.24 (1.05–1.24) | < 0.001 | 0.97 (0.89–1.06) | 0.489 |
| 3-hydroxycotinine/cotinine | 0.27 (0.269–0.271) | 0.367 (0.367–0.368) | 0.73 (0.66–0.82) | < 0.001 | 0.78 (0.69–0.88) | < 0.001 |
| Urine biomarkers | ||||||
| Total 3-hydroxycotinine/Cotinine | 4.23 (4.21–4.25) | 5.42 (5.41–5.43) | 0.78 (0.69–0.88) | < 0.001 | 0.94 (0.83–1.05) | 0.478 |
Geometric means (95%CI) adjusted for CPD and TNE
adjusted for CPD, TNE and UGT2B10 activity
As noted above, the percentage of TNE excreted as products of nicotine C-oxidation was significantly lower in African Americans compared to Whites (Table 3). Other biomarkers of P450 2A6 activity were also lower in African American (Table 5). The urinary ratio of total 3HCOT to cotinine was about 20% lower in both studies (p<0.001). Whereas, the ratio of 3HCOT/cotinine in saliva was 10% lower in study 1 and the plasma ratio of 3HCOT/cotinine 27% lower in study 2. [Table 5, p=0.007 and p< 0.001]. After adjustment for UGT2B10 activity neither biomarker of CYP2A6 activity in Study 1 was significantly different for African American compared to white smokers. In Study 2, the difference between the groups decreased slightly but remained significant for the plasma ratio of 3HCOT to cotinine (Table 5, p<0.001), but not for the urinary ratio.
Discussion
We report here for the first time that serum (and saliva) cotinine concentrations in smokers are significantly influenced by UGT2B10 activity and that the relatively high frequency of UGT2B10 non-functional alleles among African Americans (21) contributes to higher cotinine levels in African American smokers. In two study populations, each including more than 600 smokers, we found that after adjustment for CPD and TNE, a biomarker of nicotine dose, serum or saliva cotinine levels were 48% or 68% higher in smokers who have no active UGT2B10 enzyme relative to those with UGT2B10 activity. As previously observed in many studies (1–5,19), African Americans in our study had higher serum or saliva cotinine concentrations than Whites even after adjustment for extent of smoking. However, when further adjusted for UGT2B10 activity there was no significant difference between cotinine levels in African American and White smokers. We conclude from these data that lower UGT2B10 catalyzed-cotinine glucuronidation by African American smokers leads to the higher cotinine plasma concentrations routinely reported for African American smokers, African Americans exposed to ETS and African Americans using NRT compared to Whites.
Cotinine glucuronidation was used to phenotype UGT2B10 activity since we have previously determined that smokers who are genotyped as carriers of two non-functional UGT2B10 excrete no cotinine glucuronide (13). The number of smokers who do not glucuronidate cotinine to any significant extent in this study is consistent with the frequencies of UGT2B10 alleles that code for non-functional enzyme. We categorized 15.2% of 295 African American smokers in study 1 and 15.5% of 200 in study 2 as null for UGT2B10. These data are in agreement with a previous study of nicotine and cotinine glucuronidation in which 15 % of the African Americans smokers were genotyped as homozygous for either the UGT2B10 Asp67Tyr variant or the splice variant, or as carriers of both of these alleles (13). Smokers with these three genotypes in any ethnic/racial group excreted essentially no cotinine glucuronide and reduced levels of total cotinine. These data suggest that cotinine is less efficiently cleared in smokers who are deficient in UGT2B10 activity.
The higher serum and saliva cotinine concentrations found in this study for UGT2B10 null compared to non-null smokers are consistent with our earlier report of 20% higher plasma cotinine in smokers who were heterozygous for the UGT2B10 Asp67Tyr variant (12). The prior study was carried out before the UGT2B10 splice variant was characterized, but only 8% of the smokers in the study were African American and the splice variant is rare in Whites (allele frequency <0.3%) (13). In the present study, the geometric mean cotinine levels (adjusted for TNE and CPD) in saliva and serum from UGT2B10 null smokers were 68% and 48% higher than in non-null individuals. Based on the racial makeup of the study participants and the UGT2B10 allele frequencies, more than 40%- of the smokers classified as non-null are predicted to be heterozygous for either the UGT2B10 Asp67Tyr variant or the splice variant. Since smokers who are heterozygous for these alleles glucuronidate cotinine at about half the level of smokers homozygous for functional UGT2B10 alleles (13), we expect that the plasma cotinine concentrations of null smokers compared to smokers who carried no functional variants of UGT2B10 will be even greater than the approximately 50% mean difference reported here between null and non-null smokers. UGT2B10 activity will influence a smoker’s plasma cotinine levels independent of their ethnic/racial background. However, the relative frequencies of the UGT2B10 Asp67Tyr variant and the splice variant in African Americans (5% and 35%) compared to Whites (8.5% and 0.23%) would result in more African American smokers being affected (13), consistent with their lower plasma cotinine levels compared to Whites.
Low cotinine glucuronidation levels in African Americans were first reported in 1999 and have been subsequently confirmed in several studies (8,13,18). In the original report, it was suggested that decreased cotinine glucuronidation contributes to slower cotinine metabolism and presumable higher plasma cotinine in African American compared to White smokers. In the studies presented here, we have confirmed this hypothesis, since when either saliva or serum cotinine levels are adjusted for both smoking dose and UGT2B10-catalyzed cotinine glucuronidation there is no longer any difference between the concentrations in African American and White smokers. Recently, reduced P450 2A6 activity has been proposed as the explanation of higher plasma cotinine in African American smokers (19,24,25). However, there is little data to support this. If decreased P450 2A6 activity does result in reduced plasma cotinine levels, any effect in African Americans must be minimal and significantly overshadowed by the large effect of UGT2B10 activity on plasma cotinine.
Investigating the effect of cotinine metabolism on its plasma level was somewhat limited in the present study due to the lack of DNA and therefore genotyping data. If UGT2B10 and CYP2A6 genotypes were available for the smokers in this study, these genotypes could have been used as independent variables in assessing the effect of cotinine glucuronidation and oxidation on serum and saliva cotinine. However, while genotype may have improved our ability to define the contribution of UGT2B10 activity to cotinine levels, UGT2B10 phenotype clearly identified UGT2B10 null individuals, all of whom had significantly reduced saliva or serum cotinine.
In summary, UGT2B10 activity was shown to significantly affect serum and saliva cotinine concentrations in smokers. Cotinine levels in UGT2B10 null smokers were about 50% lower after correction for CPD and TNE. Therefore, when cotinine levels are used as a measure of tobacco or nicotine exposure it is critical to take UGT2B10 genotype into account when interpreting these data. Due to the relatively high prevalence of UGT2B10 null variants in African Americans; this is particularly important when comparing tobacco exposures across different racial/ethnic groups.
Acknowledgments
Financial support
Research reported in this publication was supported by the National Institute on Drug Abuse and FDA Center for Tobacco Products (CTP) (U54 DA031659 to E.C. Donny, D.K. Hatsukami, and S.E. Murphy). The content is solely the responsibility of the authors and does not necessarily represent the official views of the NIH or the Food and Drug Administration.
Footnotes
Conflict of Interest Statement
We confirm that there are no known conflicts of interest associated with this publication and there has been no significant financial support for this work that could have influenced its outcome.
Reference List
- 1.Wagenknecht LE, Cutter GR, Haley NJ, Sidney S, Manolio TA, Hughes GH, et al. Racial differences in serum cotinine levels among smokers in the Coronary Artery Risk Development in (Young) Adults study. Am J Public Health. 1990;80:1053–56. doi: 10.2105/ajph.80.9.1053. [DOI] [PMC free article] [PubMed] [Google Scholar]
- 2.Caraballo RS, Giovino GA, Pechacek TF, Mowery PD, Richter PA, Strauss WJ, et al. Racial and ethnic differences in serum cotinine levels of cigarette smokers - Third National Health and Nutrition Examination Survey, 1988–1991. J Am Med Assoc. 1998;280:135–39. doi: 10.1001/jama.280.2.135. [DOI] [PubMed] [Google Scholar]
- 3.Benowitz NL, Bernert JT, Caraballo RS, Holiday DB, Wang J. Optimal serum cotinine levels for distinguishing cigarette smokers and nonsmokers within different racial/ethnic groups in the United States between 1999 and 2004. Am J Epidemiol. 2009;169:236–48. doi: 10.1093/aje/kwn301. [DOI] [PubMed] [Google Scholar]
- 4.Jain RB. Trends in serum cotinine concentrations among daily cigarette smokers: data from NHANES 1999–2010. Sci Total Environ. 2014;472:72–77. doi: 10.1016/j.scitotenv.2013.11.002. [DOI] [PubMed] [Google Scholar]
- 5.Jain RB. Serum cotinine and urinary 4-(methylnitrosamino)-1-(3-pyridyl)-1-butanonol levels among non-Hispanic Asian American smokers and nonsmokers as compared to other race/ethnicities: data from NHANES 2011–2012. Chemosphere. 2015;120:584–91. doi: 10.1016/j.chemosphere.2014.09.069. [DOI] [PubMed] [Google Scholar]
- 6.Pirkle JL, Bernert JT, Caudill SP, Sosnoff CS, Pechacek TF. Trends in the exposure of nonsmokers in the U.S. population to secondhand smoke: 1988–2002. Environ Health Perspect. 2006;114:853–58. doi: 10.1289/ehp.8850. [DOI] [PMC free article] [PubMed] [Google Scholar]
- 7.Perez-Stable EJ, Herrera B, Jacob P, III, Benowitz NL. Nicotine metabolism and intake in black and white smokers. JAMA: the journal of the American Medical Association. 1998;280:152–56. doi: 10.1001/jama.280.2.152. [DOI] [PubMed] [Google Scholar]
- 8.Benowitz NL, Perez-Stable EJ, Fong I, Modin G, Herrera B, Jacob P., III Ethnic differences in N-glucuronidation of nicotine and cotinine. J Pharmacol Exp Ther. 1999;291:1196–203. [PubMed] [Google Scholar]
- 9.Hukkanen J, Jacob P, III, Benowitz NL. Metabolism and disposition kinetics of nicotine. Pharmacol Rev. 2005;57:79–115. doi: 10.1124/pr.57.1.3. [DOI] [PubMed] [Google Scholar]
- 10.von Weymarn LB, Retzlaff C, Murphy SE. CYP2A6 and CYP2A13-catalyzed metabolism of the nicotine delta 1′(5′) iminium ion. J Pharmacol Exp Ther. 2012;343:307–15. doi: 10.1124/jpet.112.195255. [DOI] [PMC free article] [PubMed] [Google Scholar]
- 11.Benowitz NL, Hukkanen J, Jacob P., III Nicotine chemistry, metabolism, kinetics and biomarkers. Handb Exp Pharmacol. 2009;192:29–60. doi: 10.1007/978-3-540-69248-5_2. [DOI] [PMC free article] [PubMed] [Google Scholar]
- 12.Berg JZ, von Weymarn LB, Thompson ET, Wickham KM, Weisensel NA, Hatsukami DK, et al. UGT2B10 genotype influences nicotine glucuronidation, oxidation and consumption. Cancer Epidemiol Biomarkers Prev. 2010;19:1423–31. doi: 10.1158/1055-9965.EPI-09-0959. [DOI] [PMC free article] [PubMed] [Google Scholar]
- 13.Murphy SE, Park SS, Thompson EF, Wilkens LR, Patel Y, Stram DO, et al. Nicotine N-glucuronidation relative to N-oxidation and C-oxidation and UGT2B10 genotype in five ethnic/racial groups. Carcinogenesis. 2014;35:2526–33. doi: 10.1093/carcin/bgu191. [DOI] [PMC free article] [PubMed] [Google Scholar]
- 14.Chen G, Blevins-Primeau AS, Dellinger RW, Muscat JE, Lazarus P. Glucuronidation of nicotine and cotinine by UGT2B10: loss of function by the UGT2B10 Codon 67 (Asp>Tyr) polymorphism. Cancer Res. 2007;67:9024–29. doi: 10.1158/0008-5472.CAN-07-2245. [DOI] [PubMed] [Google Scholar]
- 15.Kaivosaari S, Toivonen P, Hesse LM, Koskinen M, Court MH, Finel M. Nicotine Glucuronidation and the Human UDP-Glucuronosyltransferase UGT2B10. Mol Pharmacol. 2007;72:761–68. doi: 10.1124/mol.107.037093. [DOI] [PubMed] [Google Scholar]
- 16.Scherer G, Engl J, Urban M, Gilch G, Janket D, Riedel K. Relationship between machine-derived smoke yields and biomarkers in cigarette smokers in Germany. Regul Toxicol Pharmacol. 2007;47:171–83. doi: 10.1016/j.yrtph.2006.09.001. [DOI] [PubMed] [Google Scholar]
- 17.Wang J, Liang Q, Mendes P, Sarkar M. Is 24h nicotine equivalents a surrogate for smoke exposure based on its relationship with other biomarkers of exposure? Biomarkers. 2011;16:144–54. doi: 10.3109/1354750X.2010.536257. [DOI] [PubMed] [Google Scholar]
- 18.Berg JZ, Mason J, Boettcher AJ, Hatsukami DK, Murphy SE. Nicotine metabolism in African Americans and European Americans: variation in glucuronidation by ethnicity and UGT2B10 haplotype. J Pharmacol Exp Ther. 2010;332:202–09. doi: 10.1124/jpet.109.159855. [DOI] [PMC free article] [PubMed] [Google Scholar]
- 19.Roethig HJ, Munjal S, Feng S, Liang Q, Sarkar M, Walk RA, et al. Population estimates for biomarkers of exposure to cigarette smoke in adult U.S. cigarette smokers. Nicotine Tob Res. 2009;11:1216–25. doi: 10.1093/ntr/ntp126. [DOI] [PubMed] [Google Scholar]
- 20.Patel YM, Stram DO, Wilkens LR, Park SS, Henderson BE, Le Marchand L, et al. The contribution of common genetic variation to nicotine and cotinine glucuronidation in multiple ethnic/racial populations. Cancer Epidemiol Biomarkers Prev. 2015;24:119–27. doi: 10.1158/1055-9965.EPI-14-0815. [DOI] [PMC free article] [PubMed] [Google Scholar]
- 21.Fowler S, Kletzl H, Finel M, Manevski N, Schmid P, Tuerck D, et al. A UGT2B10 splicing polymorphism common in african populations may greatly increase drug exposure. J Pharmacol Exp Ther. 2015;352:358–67. doi: 10.1124/jpet.114.220194. [DOI] [PubMed] [Google Scholar]
- 22.Donny EC, Denlinger RL, Tidey JW, Koopmeiners JS, Benowitz NL, Vandrey RG, et al. Randomized Trial of Reduced-Nicotine Standards for Cigarettes. N Engl J Med. 2015;373:1340–49. doi: 10.1056/NEJMsa1502403. [DOI] [PMC free article] [PubMed] [Google Scholar]
- 23.Murphy SE, Wickham KM, Lindgren BR, Spector LG, Joseph A. Cotinine and trans 3′-hydroxycotinine in dried blood spots as biomarkers of tobacco exposure and nicotine metabolism. J Expo Sci Environ Epidemiol. 2013;23:513–18. doi: 10.1038/jes.2013.7. [DOI] [PMC free article] [PubMed] [Google Scholar]
- 24.Zhu AZ, Renner CC, Hatsukami DK, Swan GE, Lerman C, Benowitz NL, et al. The ability of plasma cotinine to predict nicotine and carcinogen exposure is altered by differences in CYP2A6: the influence of genetics, race, and sex. Cancer Epidemiol Biomarkers Prev. 2013;22:708–18. doi: 10.1158/1055-9965.EPI-12-1234-T. [DOI] [PMC free article] [PubMed] [Google Scholar]
- 25.Ross KC, Gubner NR, Tyndale RF, Hawk LW, Jr, Lerman C, George TP, et al. Racial differences in the relationship between rate of nicotine metabolism and nicotine intake from cigarette smoking. Pharmacol Biochem Behav. 2016;148:1–7. doi: 10.1016/j.pbb.2016.05.002. [DOI] [PMC free article] [PubMed] [Google Scholar]