

Abstract
Background
The purpose of this study was to characterize the repeatability of ectopic beats, defined by premature atrial contractions (PACs) and premature ventricular contractions (PVCs), on ambulatory electrocardiogram (aECG) monitoring and evaluate the effect of length of aECG monitoring on the repeatability estimates.
Methods
This analysis includes 95 randomly selected participants from the Atherosclerosis Risk in Communities Study (ARIC; 2011–2013). The participants wore a Holter monitor for two, 48‐hr periods separated by a mean of 38 days following an identical, standardized protocol. We divided each 48‐hr recording into 3‐, 6‐, 12‐, and 24‐hr recording periods and calculated intraclass correlation coefficients (ICCs) for PACs and PVCs and also as a percentage of the corresponding total of recorded beats per hour among these periods.
Results
All participants had ≥1 PAC during the 48‐hr recordings, and only two participants had no PVCs. ICCs were >0.83 for all indices and recording lengths ≥12 hrs. ICCs were intermediate for 6‐hr recordings (range 0.80–0.83) and lower for 3‐hr recordings (range 0.74–0.80). The ratio of the between‐ to within‐participant variation increased with recording length.
Conclusion
Repeatability of PACs and PVCs was excellent for recording lengths of 6–24 hr and fair for 3 hr. Repeatability varies over shorter duration recordings within the 48‐hr recording period, and thus the present results have implications for detection algorithms for ectopic beats and can facilitate epidemiologic and clinical applications in which knowledge of measurement variability and misclassification are needed.
Keywords: Holter, premature atrial contractions, premature ventricular contractions, supraventricular ectopic beats, ventricular ectopic beats
1. Introduction
Premature atrial and ventricular ectopic beats—aka premature atrial contractions (PACs) and premature ventricular contractions (PVCs)—are the most common findings on an ambulatory electrocardiogram (aECG). Frequent PACs from aECG recording are linked to an increased risk of atrial fibrillation (Larsen, Kumarathurai, Falkenberg, Nielsen, & Sajadieh, 2015) and mortality (Lin et al., 2015). Similarly, frequent PVCs are associated with AF (Binici, Intzilakis, Nielsen, Kober, & Sajadieh, 2010), heart failure (Dukes et al., 2015), stroke (Engstrom, Hedblad, Juul‐Moller, Tyden, & Janzon, 2000), and mortality in population‐based studies (Binici et al., 2010; Dukes et al., 2015; Ahn, 2013). In light of the prognostic significance of ectopic beats, there is a need to better understand the measurement variability of PACs and PVCs.
Most prior studies used 24‐ to 48‐hr aECG recording when assessing PACs and PVCs (Larsen et al., 2015; Lin et al., 2015; Binici et al., 2010; Dukes et al., 2015; Engstrom et al., 2000; Ahn, 2013; Chong et al., 2012). These studies, however, did not report the repeatability of PACs and PVCs, which would provide critical information about measurement variability that could impact interpreting the results. Repeatability of PVCs has been reported among clinical populations and those with ≥30 PVCs per hour (Winkle, 1978; Michelson & Morganroth, 1980; Anastasiou‐Nana, Menlove, Nanas, & Anderson, 1988; Raeder et al., 1988; Sami et al., 1980), but not among a community‐dwelling population. Furthermore, there is no consensus on the desirable length of aECG recording to detect ectopic beats. The aim of this study was to evaluate the reproducibility of PACs and PVCs in 48‐hr aECG recording and evaluate the influence of length of aECG recording on the repeatability estimates among a community‐dwelling population of older white and black adults in the Atherosclerosis Risk in Communities (ARIC) 48‐hr ambulatory ECG study.
2. Methods
2.1. Study population
Selected participants in the ongoing ARIC study, a longitudinal population‐based cohort study of cardiovascular disease and its risk factors, were invited to participate in an ancillary study that performed 48‐hr aECG recording. Participants were selected from two sites (Forsyth County, NC, and Jackson, MS) from among those attending the 5th ARIC study visit (2011–2013). The repeatability study described herein targeted the selection of 50 participants from each site, including 50 women and 60 blacks. A total of 101 participants consented to aECG recording for an additional 48 hrs within 2 months of completing the first 48‐hr recording.
At the first visit only, anthropometric and blood pressure measurements were performed, and interviewer‐administered questionnaires were used to obtain medical history and lifestyle information. Participants brought all prescription and nonprescription medications taken within 2 weeks. Medication names, strengths, and units were inventoried and used to therapeutically classify them. Body weight was measured to the nearest 0.1 kg, and height was recorded to the nearest centimeter. Three seated blood pressure measurements were obtained after a 5‐minute rest using an oscillometric automated sphygmomanometer (Omron HEM‐907 XL; Omron Co. Ltd., Kyoto, Japan), and the average of the last two measurements was used. Resting, standard 12‐lead, 10‐s ECGs were recorded following a standardized protocol. ECGs were recorded using the GE MAC 1200 electrograph (GE, Milwaukee, Wisconsin) with a 10 mm/mV calibration at a speed of 25 mm/s and centrally processed using the GE 12‐SL Marquette Version 2001 (GE, Milwaukee, Wisconsin). Hypertension was defined as SBP ≥140 mm/Hg, diastolic blood pressure (DBP) ≥90 mm/Hg, or anti‐hypertensive medication use. Diabetes was defined as fasting glucose ≥126 mg/dl, nonfasting glucose ≥200 mg/dl, anti‐diabetic medication use, or self‐reported physician diagnosis of diabetes. Prevalent coronary heart disease (CHD) and stroke were defined through ARIC cohort surveillance through August 30, 2013.
Both study visits included attachment, by trained staff, of the three‐channel aECG monitor (Holter monitor) and information on wearing the monitor. Participants received a new monitor, batteries, and electrodes during the repeat visit. The device was connected at the field center and the quality of the signal was confirmed. We excluded participants with evidence of AF (n = 4) or a paced rhythm (n = 2) on the 48‐hr Holter monitor. After exclusions, our analytic sample included 95 participants. Participants provided written informed consent, and the study was approved by the Institutional Review Boards at the field centers, the Collaborative Studies Coordinating Center, and the Epidemiology Cardiology Research Center (EPICARE).
2.2. Ambulatory ECG
Study staff attached seven electrodes to the participant using a “modified V3 placement” and placed the Holter monitor (SEER Light Extend Compact Digital Holter Recorder; GE, Milwaukee, WI, USA) in a carrying case that the participant could connect to a belt or wear using a strap across their body. Technicians at EPICARE (Wake Forest School of Medicine, Winston Salem, NC, USA) centrally processed the recordings using the GE MARS 8.0.2 (GE, Milwaukee, Wisconsin) with a standardized protocol. Separate counts of PACs and PVCs were automatically provided by the software and verified by an operator. We also expressed the counts as percentages of the corresponding total of beats per hour. For example, % PACs = (number of PACs/number of QRS complexes) × 100. These analyses only used complete hours from the recordings to avoid possible bias; therefore, we excluded the last hour for the 24‐hr recordings and the first hour for the 3‐, 6‐, and 12‐hr recordings.
2.3. Statistical analysis
Counts of PACs and PVCs and percentage of counts by visit and measure were reported as medians and interquartile interval (25th and 75th percentiles). We calculated the average difference between pairs of measurements within‐visit and between‐visit.
To examine within‐visit repeatability, each 48‐hr recording was divided into two 24‐hr recordings. In addition, we evaluated the effect of different lengths of recordings on repeatability by considering only the first 3‐, 6‐, and 12‐hr of recording for each 24‐hr recording. We used generalized linear random‐effects models (SAS PROC GLIMMIX) to accommodate the nonnormal distributions of the counts and percentage of counts. Nested random effects were used to estimate the between‐participant (σ2 p), between‐visit (σ2 bv), and within‐visit (σ2 wv) variation. Our assumptions were that the between‐visit variation is the same for all participants and the within‐visit variation is the same for all visits and all participants. To estimate the repeatability of counts, the intraclass correlation coefficient (ICC) was calculated by dividing the between‐participant variance by the total variance [σ2 p/σ2 total = σ2 p/(σ2 p+σ2 bv+σ2 wv)]. Analyses were performed using SAS, version 9.2 (SAS Institute, Inc., Cary, NC, USA), and all statistical tests were two‐sided with a nominal statistical significance level of p < .05.
3. Results
The mean age of the participants was 74.6 years, and the mean BMI was 29.4 kg/m2 (Table 1). There were 61 (64.2%) females and 55 (57.9%) blacks. The mean time between repeat visits was 38 days (range 11–130 days). All participants wore the Holter monitor for 48 hr and had <10% noise. During the 48‐hr recordings, all participants had ≥1 PAC and two participants had no PVC counts.
Table 1.
Participant characteristics of the repeatability study (N = 95)
| Characteristic | Mean ± SD or N (%) |
|---|---|
| Age, year | 74.6 ± 4.7 |
| Body mass index, kg/m2 | 29.4 ± 5.5 |
| Female, n (%) | 61 (64.2) |
| Black, n (%) | 55 (57.9) |
| Current smoker, n (%) | 8 (8.7) |
| Diabetes, n (%) | 29 (31.2) |
| Hypertension, n (%) | 80 (84.2) |
| Prevalent coronary heart disease, n (%) | 10 (10.5) |
| Prevalent atrial fibrillationa, n (%) | 3 (3.2) |
| Anticoagulant use, n (%) | 3 (3.2) |
| Aspirin use, n (%) | 66 (69.5) |
SD, standard deviation.
By June 1, 2011, from electrocardiogram readings from cohort visits and the International Classification of Diseases (ICD)‐9 discharge codes from hospitalizations.
The median counts of PACs and PVCs varied slightly within and between visits (Table 2). The counts per hour and percentage of counts were higher for PVCs than PACs. In general, the between‐visit differences were higher than the within‐visit differences in PACs and PVCs across recording lengths as shown by the larger interquartile intervals (Table 3).
Table 2.
Descriptive statistics for premature atrial contractions (PACs) and premature ventricular contractions (PVCs) by length of ambulatory electrocardiogram recording and by visit
| Variable | Visit 1 | Visit 2 | ||
|---|---|---|---|---|
| Measure 1 median (IQI) | Measure 2 median (IQI) | Measure 3 median (IQI) | Measure 4 median (IQI) | |
| PACs N/hr | ||||
| 24 hr | 3.2 (1.0, 28.0) | 3.2 (1.1, 20.2) | 2.7 (1.1, 20.7) | 3.4 (1.1, 12.3) |
| 12 hr | 1.9 (0.7, 24.6) | 2.3 (0.8, 30.8) | 2.7 (0.8, 13.3) | 3.0 (0.9, 12.1) |
| 6 hr | 2.3 (0.5, 17.5) | 2.3 (0.7, 20.7) | 1.8 (0.5, 13.2) | 2.8 (0.5, 12.2) |
| 3 hr | 2.0 (0.3, 20.3) | 2.0 (0.7, 11.3) | 2.0 (0.7, 18.0) | 2.7 (0.7, 9.7) |
| PVCs N/hr | ||||
| 24 hr | 3.3 (0.2, 20.3) | 4.1 (0.4, 20.9) | 4.2 (0.2, 25.8) | 4.5 (0.3, 28.0) |
| 12 hr | 2.3 (0.2, 27.8) | 4.8 (0.3, 23.6) | 5.0 (0.2, 29.4) | 4.0 (0.3, 37.3) |
| 6 hr | 2.7 (0.2, 26.2) | 4.0 (0.3, 27.8) | 4.5 (0.3, 36.7) | 3.3 (0.3, 35.8) |
| 3 hr | 2.3 (0.3, 24.3) | 4.3 (0.0, 21.3) | 5.3 (0.0, 31.0) | 3.8 (0.3, 32.7) |
| % PACs | ||||
| 24 hr | 0.06 (0.02, 0.62) | 0.07 (0.03, 0.42) | 0.06 (0.02, 0.59) | 0.08 (0.02, 0.39) |
| 12 hr | 0.05 (0.01, 0.59) | 0.05 (0.02, 0.68) | 0.06 (0.02, 0.32) | 0.07 (0.02, 0.33) |
| 6 hr | 0.06 (0.01, 0.51) | 0.05 (0.01, 0.50) | 0.04 (0.01, 0.30) | 0.06 (0.01, 0.29) |
| 3 hr | 0.04 (0.01, 0.54) | 0.04 (0.01, 0.30) | 0.04 (0.01, 0.47) | 0.06 (0.02, 0.33) |
| % PVCs | ||||
| 24 hr | 0.07 (0.00, 0.45) | 0.10 (0.01, 0.54) | 0.10 (0.01, 0.62) | 0.09 (0.01, 0.59) |
| 12 hr | 0.06 (0.00, 0.62) | 0.11 (0.01, 0.59) | 0.10 (0.00, 0.59) | 0.08 (0.01, 0.73) |
| 6 hr | 0.06 (0.00, 0.59) | 0.13 (0.01, 0.49) | 0.10 (0.01, 0.79) | 0.06 (0.01, 0.79) |
| 3 hr | 0.06 (0.01, 0.48) | 0.10 (0.00, 0.44) | 0.11 (0.00, 0.58) | 0.08 (0.01, 0.78) |
Values are median and interquartile interval (IQI; 25th, 75th percentile); N = 95 except for measure 4 where N = 94. % PACs = (number of PACs/number of QRS complexes) × 100. % PVCs = (number of PVCs/number of QRS complexes) × 100.
Table 3.
Difference within and between visit for premature atrial contractions (PACs) and premature ventricular contractions (PVCs) by length of ambulatory electrocardiogram recording
| Variable | Within visit | Between visit | ||
|---|---|---|---|---|
| Median | IQI | Median | IQI | |
| PACs N/hr | ||||
| 24 hr | 0.19 | −0.36, 1.28 | −0.23 | −2.29, 0.94 |
| 12 hr | 0.12 | −0.75, 1.04 | −0.13 | −2.17, 1.00 |
| 6 hr | 0.08 | −0.67, 1.17 | −0.17 | −2.50, 0.67 |
| 3 hr | 0.17 | −1.17, 1.20 | 0 | −2.33, 1.33 |
| PVCs N/hr | ||||
| 24 hr | 0.23 | −0.21, 2.80 | 0 | −1.65, 6.38 |
| 12 hr | 0.13 | −1.00, 3.17 | −0.04 | −4.58, 2.33 |
| 6 hr | 0 | −2.50, 2.67 | −0.17 | −3.00, 2.42 |
| 3 hr | 0 | −2.33, 4.00 | 0 | −3.83, 3.33 |
| % PACs | ||||
| 24 hr | 0 | −0.01, 0.03 | −0.01 | −0.06, 0.02 |
| 12 hr | 0 | −0.03, 0.02 | 0 | −0.05, 0.03 |
| 6 hr | 0 | −0.01, 0.03 | 0 | −0.06, 0.01 |
| 3 hr | 0 | −0.02, 0.02 | 0 | −0.05, 0.02 |
| % PVCs | ||||
| 24 hr | 0.01 | 0, 0.06 | 0 | −0.04, 0.12 |
| 12 hr | 0 | −0.02, 0.06 | 0 | −0.05, 0.06 |
| 6 hr | 0 | −0.05, 0.05 | 0 | −0.08, 0.06 |
| 3 hr | 0 | −0.06, 0.06 | 0 | −0.07, 0.05 |
Values are median and interquartile interval (IQI; 25th, 75th percentile); N = 95. % PACs = (number of PACs/number of QRS complexes) × 100. % PVCs = (number of PVCs/number of QRS complexes) × 100.
Between‐participant variation accounted for the majority of the total variation among all PAC and PVC measures (Figure 1 and 2). The between‐visit variation was higher than the within‐visit variation among the 12‐ and 24‐hr recordings. The between‐visit variation, however, was similar to the within‐visit variation among the 6‐hr recordings, but lower than the within‐visit variation among the 3‐hr recordings.
Figure 1.
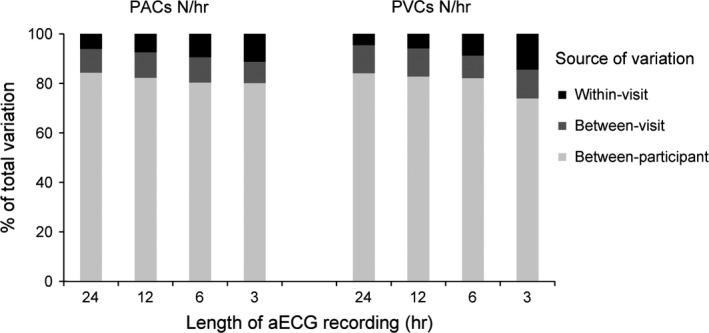
Components of measurement variation for number of premature atrial contractions (PACs) and premature ventricular contractions (PVCs) per hour by the length of ambulatory electrocardiogram (aECG) recording
Figure 2.
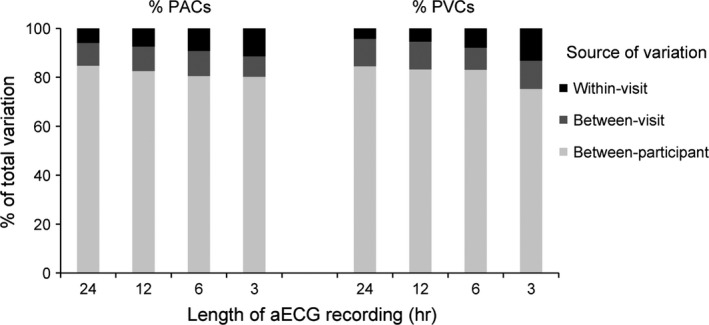
Components of measurement variation for percent of premature atrial contractions (PACs) and premature ventricular contractions (PVCs) by the length of ambulatory electrocardiogram (aECG) recording
For counts per hour, the ICCs across recording lengths ranged from 0.80 to 0.84 for PACs and 0.74 to 0.84 for PACs (Table 4). For the percentage of total counts, the ICCs ranged from 0.80 to 0.85 for PACs and 0.75 to 0.85 for PVCs. ICCs were >0.83 for all counts and percentages of total counts with recording lengths ≥12 hr. ICCs were lower for the 3‐hr recordings and intermediate for the 6‐hr recordings. ICCs for PVCs were slightly lower than PACs for the 3‐hr recordings.
Table 4.
Intraclass correlation coefficient (ICC) for premature atrial contractions (PACs) and premature ventricular contractions (PVCs) by length of ambulatory electrocardiogram recording
| Variable | ICC | 95% CI |
|---|---|---|
| PACs N/hr | ||
| 24 hr | 0.84 | (0.79, 0.90) |
| 12 hr | 0.83 | (0.76, 0.88) |
| 6 hr | 0.80 | (0.74, 0.87) |
| 3 hr | 0.80 | (0.74, 0.87) |
| PVCs N/hr | ||
| 24 hr | 0.84 | (0.79, 0.90) |
| 12 hr | 0.83 | (0.77, 0.89) |
| 6 hr | 0.82 | (0.76, 0.88) |
| 3 hr | 0.74 | (0.65, 0.83) |
| % PACs | ||
| 24 hr | 0.85 | (0.80, 0.90) |
| 12 hr | 0.83 | (0.77, 0.88) |
| 6 hr | 0.81 | (0.74, 0.87) |
| 3 hr | 0.80 | (0.74, 0.87) |
| % PVCs | ||
| 24 hr | 0.85 | (0.79, 0.90) |
| 12 hr | 0.83 | (0.77, 0.89) |
| 6 hr | 0.83 | (0.77, 0.89) |
| 3 hr | 0.75 | (0.67, 0.84) |
CI, confidence interval. % PACs = (number of PACs/number of QRS complexes) × 100. % PVCs = (number of PVCs/number of QRS complexes) × 100.
4. Discussion
To our knowledge, this study is the first to report the repeatability of PACs and PVCs with varying lengths of aECG recording in a community‐dwelling population. Our analysis showed that the repeatability of PAC and PVC assessments is excellent for recording lengths of 6–24 hr and fair for 3‐hr recordings, according to the ICC interpretation recommended by Fleiss (1986). As expected, the majority of the variation was between‐participant. The proportion of variability accounted for by within‐visit variation decreased with longer recording length. Recordings >3 hrs improved repeatability of PAC and PVC assessment, with only modest gains in repeatability after 12‐hr recording lengths.
The between‐visit variation estimated in our models represents the additional variation that is added when the measurements are repeated 38 days (on average) apart, above the variation that occurs when the measurements are repeated within a 48‐hr period (within‐visit). For 12‐ and 24‐hr recordings, the within‐visit variation was lower than the between‐visit variation, suggesting that more variation was added between visits. For 6‐hr recordings, the within‐ and between‐visit variation was similar. For 3‐hr recordings, the within‐visit variation was higher than the between‐visit variation suggesting that little variation was added when relating two PAC or PVC measurements from different visits compared with relating PAC or PVC measurements from a 48‐hr period.
The between‐participant, between‐visit, and within‐visit variation we observed in PACs and PVCs among our study could be attributed to biological variation in hemodynamics and arterial anatomy, technical factors, sensor placement, and environmental factors including medications. Variability in PAC and PVC measurements could also differ by comorbidity status, such as metabolic impairments and various forms of cardiomyopathy. Heart failure and CHD are associated with a greater variability in the frequency of ectopic beats (Anderson et al., 1990; Schmidt et al., 1988). This study population, however, comprised community‐dwelling participants without persistent AF.
To our knowledge, only one study evaluated the sources of variability for PVCs from a 72‐hr aECG recording taken about 3 months apart among 15 participants with CVD that included hypertensive cardiovascular disease, coronary artery disease, congestive cardiomyopathy, and valvular heart disease (Morganroth et al., 1978). The estimated sources of variation in PVCs per hour were 66% for between participant, 16% for between hours, 10% for between 8‐hr periods, and 8% for between days. Within participants, the estimated sources of variation in PVCs per hour were 48% for between hours, 29% for between 8‐hr periods, and 23% for between days. These results are similar to our study showing that the majority of the variation in PVCs was between participants and the majority of the variation within a participant was between hours, which correspond to our shortest recording interval of 3 hrs analyzed here.
Repeatability of PVCs on aECG has been reported in certain clinical populations such as those who exceed a threshold of 30 PVCs per hour, had congestive heart failure, or had CHD. These studies showed high level of short‐term variability in PVCs among these patient populations. The frequency of PVCs had high variability between hours (Winkle, 1978; Michelson & Morganroth, 1980) and between years (Anastasiou‐Nana et al., 1988), but measures over weeks were correlated (Anastasiou‐Nana et al., 1988; Raeder et al., 1988; Sami et al., 1980).
There was large variability in PVCs per ½ hour on a 5½ hour ECG rhythm strip among 20 participants with frequent PVCs (Winkle, 1978), suggesting that longer recording lengths may be necessary. The correlation coefficient between PVCs per hour from two consecutive 24‐hr ambulatory recording periods was fairly high at 0.84 in patients with ventricular tachyarrhythmias (Raeder et al., 1988). PVCs per hour were more reproducible on 24‐hr recordings 2 weeks apart among patients with coronary artery disease (correlation coefficient = 0.94, p < .0005) (Sami et al., 1980). Similarly, correlations between PVCs on 24‐hr ambulatory ECG recording taken 1, 2, 3, and 4 weeks apart were >0.87; however, correlations between weekly measures and PVCs measured 1 year later were weak (range 0.33–0.60) among 47 participants with frequent PVCs (≥30 PVCs/hr) (Anastasiou‐Nana et al., 1988). The sample size in the study was reduced at each follow‐up and only six participants were measured at 1 year. All these studies, however, reported correlation coefficients, which do not speak to repeatability; correlations only indicate the strength of a linear relationship between two variables (Bland & Altman, 1995, 2010).
Awareness of repeatability of ectopic beats has implications for clinical research and risk stratification. Ectopic beats predict AF (Binici et al., 2010), stroke, and mortality (Larsen et al., 2015; Lin et al., 2015; Binici et al., 2010; Dukes et al., 2015; Engstrom et al., 2000; Ahn, 2013; Chong et al., 2012), and they are assessed in patients on antiarrhythmic therapy. These studies failed to consider repeatability of PVCs, highlighting the need to incorporate measurement variability in the interpretation of study results. Repeatability could vary as a function of PAC or PVC severity and of the risk for AF, stroke, or death, since frequency of PACs or PVCs is greater among those groups. After an myocardial infarction, for example, the frequency of PVCs increases as a consequence of changes in the myocardial substrate (DeCamilla, Davis, & Moss, 1980). A lack of or differential repeatability of PACs and PVCs would increase the random error in the study, lead to lower precision, and incorrectly classify participants, suggesting that the magnitude of previously reported associations may be attenuated or imprecise. With regard to clinical management for people with frequent PACs and PVCs, repeatability is needed to gauge or monitor the efficacy of drug treatment beyond measurement variability, especially when therapeutic options depend on the observed PVC and PAC frequency.
This study examined the reliability of PACs and PVCs enumerated over repeat aECG recordings, not the accuracy of their detection over distinct recording lengths. Indeed, the increase in sensitivity of the aECG for PVCs with recording length is well‐known, e.g., among MI survivors (Thanavaro et al., 1980), participants with CHD, and controls (Kennedy, Chandra, Sayther, & Caralis, 1978). Moreover, it has been established that frequent PVCs can be readily detected by a resting, standard 12‐lead, 10‐s ECG (Evenson, Welch, Cascio, & Simpson, 2000). Consistent with such findings, it is notable that the 10‐s ECG was uniformly insensitive (4–6%) and specific (100%) for PACs and PVCs at all aECG recording lengths in this study, and that its sensitivity doubled to quadrupled at PVC and PAC rates ≥10/hr with negligible decrements in specificity. This suggests that while the 10‐s ECG may be useful at confirming ectopy among those with a high pretest probability of PACs or PVCs, or ruling out ectopy among those with a history of frequent PACs or PVCs, longer aECG recordings are necessary to detect infrequent ectopy.
By design, aECG recordings in this study were available at two time points, separated by an average of 38 days between repeat measurements, and thus our analysis is limited to short‐term repeatability for two visits. Although the visits used a standardized protocol and study procedures designed to minimize measurement variability, it is possible that conditions were not exactly the same. All aECGs in this study were centrally processed using standard reading procedures at EPICARE. Because the study participants are community‐dwelling older adults, the number of ectopic beats might be lower in this cohort compared to a patient population. Only 29 participants (30%) in this study had ≥30 PVCs per 48‐hr aECG monitoring, and thus we are unable to evaluate repeatability among those with frequent ectopic beats.
5. Conclusions
Repeatability was acceptable for all PAC and PVC measures from aECG recording for ≥6 hr recording lengths in a study of older adults, suggesting longer recording times are beneficial. Further investigation on the prognostic significance of PACs and PVCs is needed in patient populations and the general population. Understanding measurement variability of PACs and PVCs is critical for applications to risk assessment and for translation to clinical practice.
Conflict of Interest
The authors declared no conflict of interest.
Supporting information
Acknowledgments
Research reported here was supported by the National Heart, Lung, and Blood Institute (NHLBI) of the National Institutes of Health under award number R01HL116900. The Atherosclerosis Risk in Communities Study is carried out as a collaborative study supported by the National Heart, Lung, and Blood Institute contracts (HHSN268201100005C, HHSN268201100006C, HHSN268201100007C, HHSN268201100008C, HHSN268201100009C, HHSN268201100010C, HHSN268201100011C, and HHSN268201100012C). The authors thank the staff and participants of the ARIC study for their important contributions.
Meyer ML, Soliman EZ, Wruck LM, et al. Repeatability of ectopic beats from 48 hr ambulatory electrocardiography: The Atherosclerosis Risk in Communities (ARIC) Study. Ann Noninvasive Electrocardiol. 2017;22:e12426 10.1111/anec.12426
References
- Ahn, M. S. (2013). Current concepts of premature ventricular contractions. Journal of Lifestyle Medicine, 3, 26–33. [PMC free article] [PubMed] [Google Scholar]
- Anastasiou‐Nana, M. I. , Menlove, R. L. , Nanas, J. N. , & Barker, A. H. (1988). Changes in spontaneous variability of ventricular ectopic activity as a function of time in patients with chronic arrhythmias. Circulation, 78, 286–295. [DOI] [PubMed] [Google Scholar]
- Anderson, J. L. , Anastasiou‐Nana, M. I. , Menlove, R. L. , Moreno, F. L. , Nanas, J. N. , & Barker, A. H. (1990). Spontaneous variability in ventricular ectopic activity during chronic antiarrhythmic therapy. Circulation, 82, 830–840. [DOI] [PubMed] [Google Scholar]
- Binici, Z. , Intzilakis, T. , Nielsen, O. W. , Kober, L. , & Sajadieh, A. (2010). Excessive supraventricular ectopic activity and increased risk of atrial fibrillation and stroke. Circulation, 121, 1904–1911. [DOI] [PubMed] [Google Scholar]
- Bland, J. M. , & Altman, D. G. (1995). Comparing two methods of clinical measurement: A personal history. International Journal of Epidemiology, 24(Suppl 1), S7–S14. [DOI] [PubMed] [Google Scholar]
- Bland, J. M. , & Altman, D. G. (2010). Statistical methods for assessing agreement between two methods of clinical measurement. International Journal of Nursing Studies, 47, 931–936. [Google Scholar]
- Chong, B. H. , Pong, V. , Lam, K. F. , Liu, S. , Zuo, M. L. , Lau, Y. F ., … Siu, C. W . (2012). Frequent premature atrial complexes predict new occurrence of atrial fibrillation and adverse cardiovascular events. Europace, 14, 942–947. [DOI] [PubMed] [Google Scholar]
- DeCamilla, J. J. , Davis, H. T. , & Moss, A. J. (1980). Frequency and complexity of ventricular ectopic beats in the posthospital phase of myocardial infarction. Journal of Electrocardiology, 13, 125–134. [DOI] [PubMed] [Google Scholar]
- Dukes, J. W. , Dewland, T. A. , Vittinghoff, E. , Mandyam, M. C. , Heckbert, S. R. , Siscovick, D. S ., … Marcus, G. M . (2015). Ventricular ectopy as a predictor of heart failure and death. Journal of the American College of Cardiology, 66, 101–109. [DOI] [PMC free article] [PubMed] [Google Scholar]
- Engstrom, G. , Hedblad, B. , Juul‐Moller, S. , Tyden, P. , & Janzon, L. (2000). Cardiac arrhythmias and stroke: Increased risk in men with high frequency of atrial ectopic beats. Stroke, 31, 2925–2929. [DOI] [PubMed] [Google Scholar]
- Evenson, K. R. , Welch, V. L. , Cascio, W. E. , & Simpson, R. J., Jr . (2000). Validation of a short rhythm strip compared to ambulatory ECG monitoring for ventricular ectopy. Journal of Clinical Epidemiology, 53, 491–497. [DOI] [PubMed] [Google Scholar]
- Fleiss, J. L. (1986). The design and analysis of clinical experiments. New York: Wiley. [Google Scholar]
- Kennedy, H. L. , Chandra, V. , Sayther, K. L. , & Caralis, D. G. (1978). Effectiveness of increasing hours of continuous ambulatory electrocardiography in detecting maximal ventricular ectopy. Continuous 48 hour study of patients with coronary heart disease and normal subjects. American Journal of Cardiology, 42, 925–930. [DOI] [PubMed] [Google Scholar]
- Larsen, B. S. , Kumarathurai, P. , Falkenberg, J. , Nielsen, O. W. , & Sajadieh, A. (2015). Excessive atrial ectopy and short atrial runs increase the risk of stroke beyond incident atrial fibrillation. Journal of the American College of Cardiology, 66, 232–241. [DOI] [PubMed] [Google Scholar]
- Lin, C. Y. , Lin, Y. J. , Chen, Y. Y. , Chang, S. L. , Lo, L. W. , Chao, T. F. , … Chen, S. A . (2015). Prognostic significance of premature atrial complexes burden in prediction of long‐term outcome. Journal of the American Heart Association, 4, e002192. [DOI] [PMC free article] [PubMed] [Google Scholar]
- Michelson, E. L. , & Morganroth, J. (1980). Spontaneous variability of complex ventricular arrhythmias detected by long‐term electrocardiographic recording. Circulation, 61, 690–695. [DOI] [PubMed] [Google Scholar]
- Morganroth, J. , Michelson, E. L. , Horowitz, L. N. , Josephson, M. E. , Pearlman, A. S. , & Dunkman, W. B. (1978). Limitations of routine long‐term electrocardiographic monitoring to assess ventricular ectopic frequency. Circulation, 58, 408–414. [DOI] [PubMed] [Google Scholar]
- Raeder, E. A. , Hohnloser, S. H. , Graboys, T. B. , Podrid, P. J. , Lampert, S. , & Lown, B. (1988). Spontaneous variability and circadian distribution of ectopic activity in patients with malignant ventricular arrhythmia. Journal of the American College of Cardiology, 12, 656–661. [DOI] [PubMed] [Google Scholar]
- Sami, M. , Kraemer, H. , Harrison, D. C. , Houston, N. , Shimasaki, C. , & DeBusk, R. F. (1980). A new method for evaluating antiarrhythmic drug efficacy. Circulation, 62, 1172–1179. [DOI] [PubMed] [Google Scholar]
- Schmidt, G. , Ulm, K. , Barthel, P. , Goedel‐Meinen, L. , Jahns, G. , & Baedeker, W. (1988). Spontaneous variability of simple and complex ventricular premature contractions during long time intervals in patients with severe organic heart disease. Circulation, 78, 296–301. [DOI] [PubMed] [Google Scholar]
- Thanavaro, S. , Kleiger, R. E. , Hieb, B. R. , Krone, R. J. , deMello, V. R. , & Oliver, G. C. (1980). Effect of electrocardiographic recording duration on ventricular dysrhythmia detection after myocardial infection. Circulation, 62, 262–265. [DOI] [PubMed] [Google Scholar]
- Winkle, R. A. (1978). Antiarrhythmic drug effect mimicked by spontaneous variability of ventricular ectopy. Circulation, 57, 1116–1121. [DOI] [PubMed] [Google Scholar]
Associated Data
This section collects any data citations, data availability statements, or supplementary materials included in this article.
Supplementary Materials